Tradingroom


EURGBP: Potential bullish cypher patternOn the EURGBP 4H we have a potential bullish cypher pattern forming.

EURNZD: Finally filling the gap?Hey traders,
On the EURNZD we can see that we are getting closer and closer to the gap that formed a few weeks ago after the weekend. What usually happens is that these gaps turn into a great support area. Combined with the 61.8% Fibonacci retracement on the bigger timeframe, this seems like a nice setup.
Cheers!

GBPUSD: Potential bearish bat patternHey traders,
On the GBPUSD hourly timeframe we have a potential bearish bat pattern taking shape. Completion of this pattern is at point D, which is near the 50% and 61.8% Fibonacci retracement of the larger moves.
Cheers

GBPAUD: Potential bearish bat patternHey traders,
On the GBPAUD we have a potential bearish bat pattern taking shape on the 4 hour timeframe.
Good luck!

AUDUSD: Potential bullish bat patternHey traders,
On the AUDUSD we have a potential bullish bat pattern taking shape on the hourly timeframe. Completion of this pattern is at point D.
Good luck!

USDJPY: Potential bullish bat patternHey traders,
On the USDJPY we have a potential bullish bat pattern taking shape on the hourly timeframe. Completion of this pattern is at point D. The stop will go below X, which will also be protected by the 38.2% Fibonacci retracement of the larger bullish move.
Good luck!

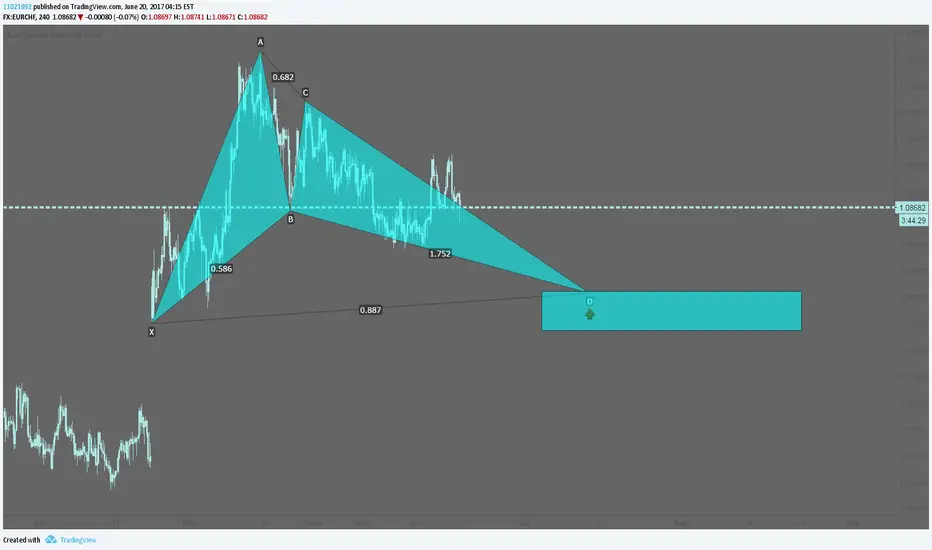
EURCHF: Potential bullish bat patternHey traders,
On the EURCHF we have a potential bullish bat pattern taking shape on the 4H timeframe. The point X is a usually a big support level due to the weekend gap that formed a few weeks ago.
Good luck!
AUDNZD: Long at the 38.2% Fibonacci retracementHey traders,
On the AUDNZD we can see a big bullish move, followed by a shallow retracement that is taking quite some time now. This is an indication that it is likely to see more bullish movement the next few days.

EURGBP: Potential bullish bat patternHey traders,
On the hourly EURGBP we have a potential bullish bat pattern taking shape. Completion of this pattern is at point D.
Cheers!

AUDUSD: Potential bullish gartley patternHey traders,
On the AUDUSD hourly timeframe we have a potential bullish gartley pattern taking shape. Completiong is at point D.
Cheers

CHFJPY: Potential bearish bat patternHey traders,
On the hourly CHFJPY we have a potential bearish bat pattern taking shape. Completion at point D.
Cheers

EURNZD: Shorting the retestHey traders,
On the EURNZD 240 minute timeframe we can see that price has broken the bullish trendline. I'm not expecting a retracement back to the trendline / previous structure area for an entry.
Cheers

USDJPY: Potential bearish bat patternHey traders,
On the USDJPY we are very close to the completion of this bearish bat pattern.
Good luck!

EURCAD: Potential bullish gartley patternHey traders,
It's been ages since I've traded a Gartley pattern, but I do want to give it a try on this setup. Looks pretty good to me. Completion of this pattern is at point D.
Cheers

NZDCAD: Let's draw some Fibs and trianglesHey traders,
On the daily NZDCAD we can see a potential bearish butterfly pattern taking shape on the daily timeframe. It completes at the 127.2% and 161.8% Fibonacci extension.
Let's see how this works out!

XAUUSD: Long as soon as the market opensHey traders,
On the daily gold chart I'm looking to enter long as soon as the market opens, based on price movement.
First target is at the completion of an AB=CD pattern and the recent swing high, in the 1337 (haha?) area.
Second target is at the 127.2% Fibonacci extension, the 161.8% Fibonacci extension and the highest high on this chart at 1375 area.

EURUSD: Potential bullish bat patternHey traders,
On the EURUSD 240 minute timeframe we have a potential bullish bat pattern taking shape.
Entry: 1.11225
Stop: 1.10920
Target 1: 1.11794
Target 2: 1.12478
Target 3; 1.13210
Cheers

USOIL: Potential bullish bat patternHey traders,
On the USOIL 4H timeframe we have a potential bullish bat pattern taking shape. Completion of this pattern is at point D.
