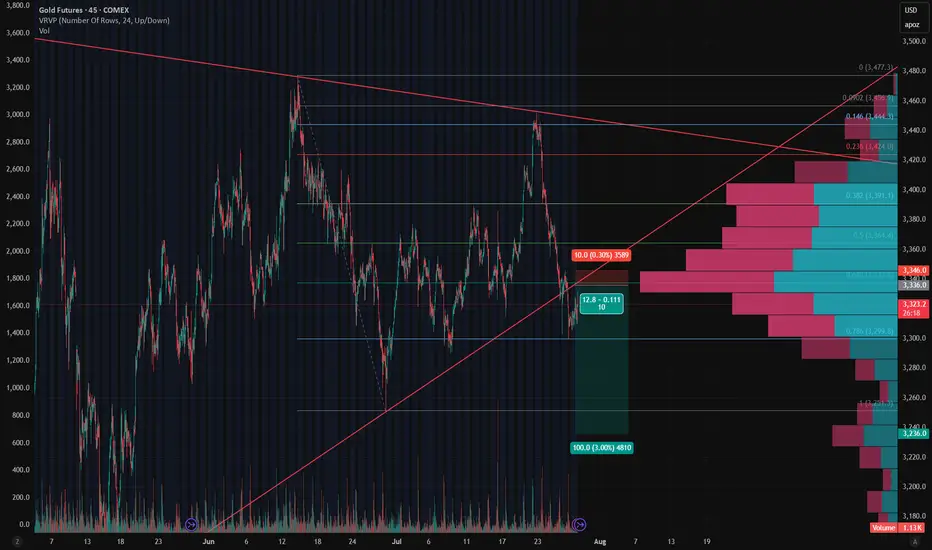
Gold - Short Setup Off Major Trendline Rejection📉 Gold - Short Setup Off Major Trendline Rejection
Gold has broken down through the rising trendline and is now retesting it — the moment of truth! 🧐
🔻 Short Entry: 3,336
🎯 Target: 3,236 (Fib 1.0 + HVN gap fill)
🛑 Stop: 3,346 (Above trendline retest)
⚖️ Risk/Reward: ~1:10
📊 Bonus: High volume node above adds resistance. Bearish volume profile structure confirms the breakdown bias.
Watching for volume to pick up on the move down. Let's see if GC bleeds into August. 🩸📆
Tradingsetup
MARA: shoulders done, now walk toward the targetOn the daily chart, MARA completed a textbook inverse Head & Shoulders reversal with a clear breakout above the descending trendline. A corrective pullback followed, and the price is now heading into the key buy zone at 15.21–15.77 - aligning with the 0.72 and 0.79 Fibonacci retracements, and the upper boundary of the broken channel. This is the area to watch for a potential continuation of the bullish impulse.
Volume on the breakout was above average, confirming strong buyer interest. The EMAs are trending below the price, supporting the upward structure. The first target is located at 21.57 (previous resistance), with a potential extension to 28.77 (Fibonacci 1.618).
Fundamentally, MARA remains highly correlated with BTC and crypto sentiment. As interest returns to crypto-related assets due to ETF flows and possible Fed easing, mining stocks like MARA gain attention. Recent reports also show improved production efficiency and lowered costs - a tailwind for bulls.
Tactically, the best setup would be a confirmed reaction from the buy zone — whether a strong candlestick formation, volume surge, or reclaim of a key level. If that happens, aiming for 21.57 and 28.77 becomes a solid plan.
The pattern played out - now it's time for the market to walk the talk.

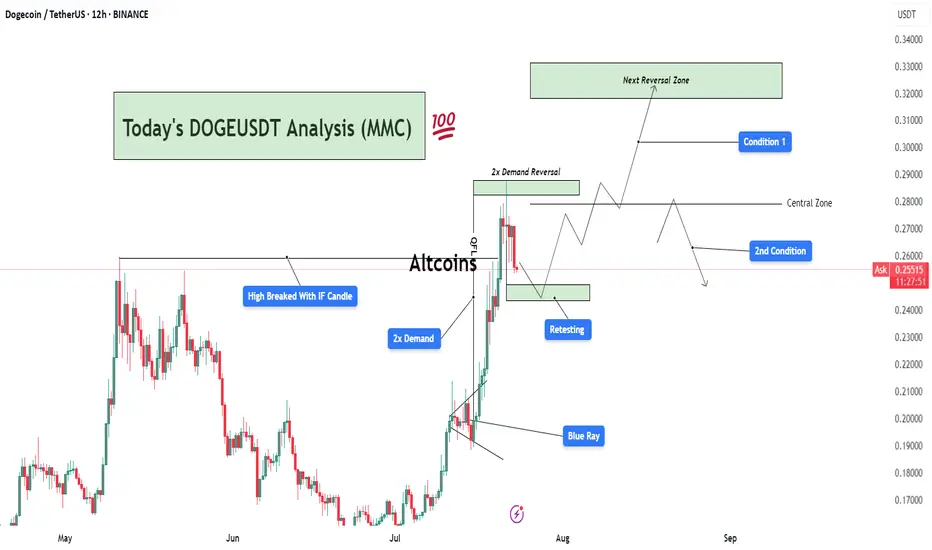
DOGEUSDT Analysis : Demand Zone Retest Before New Highs Target📊 Overview:
Today's DOGEUSDT analysis (12H chart) under the Mirror Market Concept (MMC) framework reveals a potential bullish continuation or corrective phase based on two major conditions. The market structure is transitioning after a strong impulsive move, triggered by a 2x Demand Zone breakout, and is now in the retesting phase.
🔍 Key Technical Breakdown:
High Broken with IF Candle:
A significant previous swing high was broken decisively by an Initiation Flow (IF) candle, indicating institutional activity or aggressive buying pressure.
This confirms a shift in market structure toward a bullish trend.
2x Demand Zone:
This zone has served as a strong base for price accumulation and an impulsive breakout.
The market responded well with a sharp rally post this demand, validating it as a critical support.
Blue Ray Zone (Support Zone):
The bullish breakout was partially driven by this inner trendline zone (referred to as Blue Ray), where price respected the rising support channel before breakout.
This shows smart money liquidity engineering prior to the breakout.
Retesting Zone:
Currently, the price is retracing toward a previously broken demand zone.
If this zone holds, it could provide an optimal entry for continuation.
📈 Two Scenarios (Conditions):
✅ Condition 1: Bullish Breakout to Next Reversal Zone
If the retest holds and price prints bullish confirmation (e.g., engulfing or pin bar), we can expect price to move up toward the next key reversal zone between $0.3100–$0.3300.
This zone is marked as a potential supply/reversal zone, where large sell-offs may occur.
This path follows the continuation structure under MMC, aligning with trend-following buyers.
⚠️ Condition 2: Failure to Hold Demand → Deeper Pullback
If the current demand zone fails to hold and price re-enters below the central zone (~$0.2700), we could expect a deeper correction.
Price may then revisit lower demand regions, potentially toward $0.2200 or lower, depending on rejection strength.
📌 Important Notes:
The central zone acts as a pivot level, defining whether bulls or bears gain short-term control.
Monitor the reaction from retesting area closely — candle confirmation is key before any trade execution.
This chart follows Mirror Market Concepts (MMC), combining smart money behavior, demand/supply reversal logic, and psychological market zones.
💬 Final Thoughts:
DOGEUSDT is currently in a critical phase. The market has shown strength, but now it's about confirmation. Patience is key — wait for a clean break or rejection around the retesting zone to determine the next direction. The analysis favors bullish continuation, but being flexible with both scenarios gives traders an edge.
ARKK: when a breakout isn’t just a breakout-it’s a runway to $91On the weekly chart, ARKK has broken out of a long-standing ascending channel, ending a year-long consolidation phase. The breakout above $71.40, with a confident close and rising volume, signals a transition from accumulation to expansion. The move came right after a golden cross (MA50 crossing MA200), further confirming institutional interest. Price has already cleared the 0.5 and 0.618 Fibonacci retracements — and the 1.618 extension points to $91.40 as the next technical target.
Momentum indicators like MACD and stochastic remain bullish with room to run. Volume profile shows low supply above $75, which could fuel an acceleration toward the target zone.
Fundamentally, ARKK remains a high-beta, high-risk vehicle — but one with focus. The ETF is positioned around next-gen tech: AI, robotics, biotech, and automation. Assets under management now exceed $9.3B with +$1.1B net inflow in 2025. YTD return stands at 37%, and its top holdings (TSLA, NVDA, COIN) are back in favor. This isn’t just a bet on innovation — it’s diversified exposure to a full-blown tech rally.
Tactical setup:
— Entry: market $69.50 or on retest
— Target: $80.21 (1.272), $91.40 (1.618 Fibo)
Sometimes a breakout is just technical. But when there’s volume, a golden cross, and billions backing it — it’s a signal to buckle up.

Why EUR/USD Dropped: A Step-by-Step Breakdown for Learners📉 Overview:
The EUR/USD has recently approached a key resistance zone near 1.17726, showing signs of a potential rejection after a bullish rally. The price is currently hovering around 1.17468, forming a short-term bearish setup that could lead to a retracement or reversal.
⸻
⚙ Key Technical Zones:
• 🔼 Resistance: 1.17500 – 1.17726
Price was strongly rejected after testing this area. This level has historically acted as a supply zone.
• 🔽 Support: 1.15500 – 1.16000
This is a historically significant demand zone, where price previously consolidated and reversed.
• 🎯 Target Zone: 1.16308
Marked as a potential take-profit level based on prior price structure and volume profile imbalance.
⸻
🧠 Indicators & Tools:
• Bollinger Bands: Price touched the upper band in overbought conditions, suggesting a possible mean reversion.
• Volume Profile (VRVP): Indicates declining volume near resistance, pointing to weak buyer momentum.
• Price Action: Bearish engulfing candle and strong rejection wick at resistance, confirming selling pressure.
⸻
🧭 Market Bias:
📌 Short-Term Bearish
A short opportunity is forming based on the rejection from resistance and overextension of price.
⸻
🧩 Possible Scenario:
1. Breakdown below 1.17061 (mid-level support) could trigger acceleration to the downside.
2. 1.16500 and 1.16308 are ideal short targets before reevaluation for continuation or bounce.
⸻
🛑 Risk Management Tips:
• Consider SL above 1.17800 (previous high).
• Monitor for confirmation before entry (e.g., bearish candle close below 1.17000).
• Adjust size and risk-reward ratio appropriately.
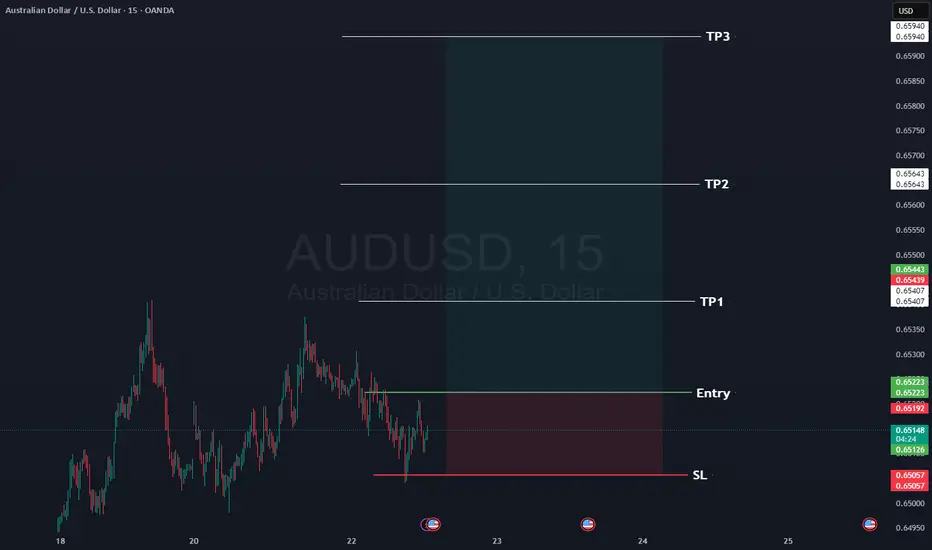
AUDUSD Here is our signal for AUDUSD
Occasionally we give a free signal, so here's AUDUSD long.
Rules:
1- Wait for the 15 minute to close with momentum above the entry, ideally we want a re-test of the entry.
2- at TP1 move your SL to entry.
3- If you want to close at TP2 then do so.
📊Entry: 0.65223
⚠️SL: 0.65057
✔️TP1: 0.65407
✔️TP2: 0.65643
✔️TP3: 0.65940
Happy Trading,
Sarah
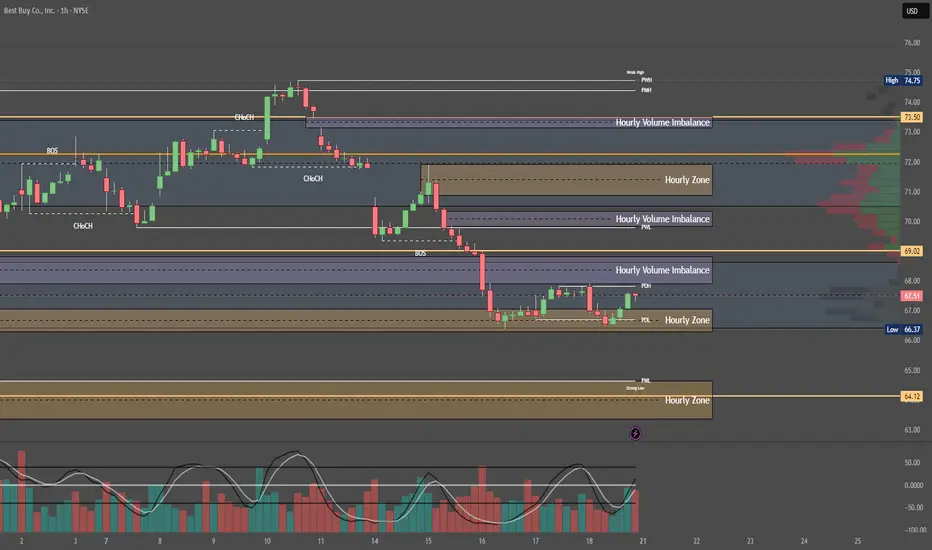
Quantum's BBY Outlook 7/20/25🚀 G.O.D. Flow (Gamma, Orderflow, Dealer Positioning)
1. 🧩 Summary Overview
Ticker: BBY
Current Price: $67.50
Flow Setup Date: Current Session
Trade Type: Intraday / 0–2 Day Swing
2. 🔬 Flow Breakdown
🔵 GEX (Gamma Exposure):
Highest -GEX at 70 → potential volatility pocket and resistance zone.
Despite matching +GEX at 70, net gamma is negative — bearish skew.
Additional +GEX at 72 & 73, but overwhelmed by -GEX at 68 and 67.
🔺 Overall gamma environment favors chop and downside unless 70 is reclaimed.
🟡 DEX (Delta Exposure):
Mirrors GEX layout.
Dealer short delta bias = likely selling into strength.
Reclaim of 70+ may signal a squeeze, but not favored without sweep confirmation.
🟣 Vanna:
Strong -Vanna clusters from 70 to 77: if IV rises, dealers sell into strength.
⚠️ This limits bullish continuation unless IV drops drastically.
Minor +Vanna at 60 = support base on deep dip (liquidity pocket if flushed hard).
🔴 Charm:
Extreme -Charm peak at 70 = time decay creates headwind at this level.
Additional -Charm pressure at 72, 73, and 77.
Minor +Charm at 60 suggests dealer support only comes much lower.
⚪ Volatility:
Neutral past week.
If vol spikes, expect dealer selling pressure to intensify under this skew.
🟢 Open Interest:
Heavy put OI at 70 = possible support IF price breaks hard.
Calls OI lighter at 72 and 73, meaning less resistance absorption if price does push up.
3. 📊 Chart Structure Setup
Price: $67.50, sitting below key gamma and charm cluster at 70.
Chart bias: Bearish unless strong reclaim of 70.
Key flush zones: 68 → 67 → 65
Confirmed supply above 70 due to clustered charm/vanna.
4. 🎯 Trade Plan
🟥 Bias: Bearish unless 70 is reclaimed and held with size.
🛠 Entry Triggers:
Rejection of 69.50–70 zone → PUT
Break and retest of 67 → PUT
📦 Contract Picks (0–5 DTE):
67p, 65p, 60p
🛑 Risk Stop:
Breakout and hold above 70.50 with size = exit or flip long bias intraday
🎯 Targets:
Target 1: 66.00 (Gamma flush)
Target 2: 63.00 (next +Charm liquidity zone)
Gold Just Flipped Is the Drop Coming?🚨 Gold Market Update – Are You Ready? 🚨
Yesterday, the gold market swept the liquidity from the previous days taking out stop orders and clearing out weak positions. After the sweep, price closed lower, showing clear signs of weakness. 📉
But that’s not all...
In the process, it also broke through a key bullish Fair Value Gap (FVG) an area where buyers had previously shown strength. That FVG is now inverted, meaning it could act as a strong resistance level going forward.
With this shift in structure, there's a real possibility that gold could drop further, potentially hunting the liquidity resting near previous lows. The market might be gearing up for a deeper move.
🔥 So the question is:
Are YOU ready for the next leg down?
📌 As always Do Your Own Research (DYOR)
This is not financial advice just reading the tape.

Gold Market Analysis (XAU/USD) – MMC Analysis + Liquidity Target🧠 Market Context Overview:
Gold recently experienced a highly impulsive move from a major demand zone, suggesting strong smart money activity. The market is currently in the redistribution phase of the MMC (Market Maker Cycle), transitioning between a reversal impulse and a liquidity targeting move.
Let’s dissect the key zones, structure, and confluences that support the ongoing market narrative.
📍 1. Strong Demand Reaction (3X Demand Spike):
We start with a triple-tap demand rejection, where the price sharply reversed to the upside. This kind of movement typically represents:
Institutional Entry Points
Stop-Hunt Below Previous Lows
Liquidity Grab Before Expansion
This strong bullish engulfing candle signifies position building by smart money, often the beginning of a significant leg up.
🧱 2. Reversal Zone & Liquidity Imbalance:
The highlighted green zone between $3,370–$3,375 is crucial. Why?
It’s an inefficiency zone where price moved too fast with low resistance.
This created a liquidity void that typically needs to be revisited (also known as FVG – Fair Value Gap).
The area also coincides with structural resistance, making it a high-probability target for price to revisit and reject again or break through with intent.
📌 Smart money always returns to areas of unfilled liquidity to close their positions or trap late retail entries.
🔺 3. Volume Contraction (Wedge Pattern Formation):
After the explosive push upward, the market started compressing, forming a descending wedge — a classical volume contraction pattern.
What does this mean?
Volatility is decreasing
Liquidity is building up
Big breakout is expected
It’s like pulling a slingshot — the more it contracts, the stronger the release will be. The direction will depend on which side breaks first.
🔁 4. Previous Structure Flipped (Support turned Resistance):
You’ll notice a key level around $3,353–$3,355 acting as a flipped structure.
This was previously a support zone that got broken.
Now it’s acting as resistance — a classic example of support/resistance flip.
This adds confluence to the idea of a possible rejection or reaction in this area.
🧠 Structure flipping is a smart money trick — break structure, retrace to trap liquidity, and then run the opposite direction.
📊 5. MMC Logic – Market Maker Cycle in Play:
Here’s how the MMC is flowing:
Accumulation (bottom consolidation)
Manipulation (liquidity sweep below demand)
Expansion (aggressive upward move)
Contraction (volume dies, price slows down)
Now we’re waiting for the next manipulation or expansion phase.
The current wedge is the pause before the next move, which could fill liquidity in the reversal zone or go lower to sweep resting sell-side liquidity.
🎯 Trading Scenarios:
✅ Bullish Bias (if breakout happens):
Break and close above the wedge
Retest previous flipped structure successfully
Target: Liquidity zone at $3,370–$3,375
🎯 This move would fill the imbalance and potentially tag sell-side liquidity sitting at the top.
❌ Bearish Bias (if rejection holds):
Failure to break above flipped structure
Breakdown from the wedge
Target: Demand origin around $3,325–$3,315
🧲 A move lower would make sense if liquidity remains uncollected beneath the range.
🧵 Final Thoughts:
Gold is currently in a high-probability setup zone. We have:
✅ Clear demand reaction
✅ Imbalance above
✅ Volume contraction
✅ Flipped structure
✅ Strong MMC confluence
Now it's a waiting game. Let the market show its hand — either a clean breakout with volume or a fakeout/rejection and reversal.
📌 "Trade what you see, not what you think. Let the levels and liquidity guide your decision."

EURUSD 4H Structure Analysis | MMC Strategy + Channel + CurveIn this EURUSD 4-hour chart analysis using MMC (Market Mind Concept), we are observing a textbook rising channel structure accompanied by a black mind curve (evidence of psychological support behavior). Let's break it down:
📊 Structure Overview:
Straight Ascending Channel:
Price has been respecting a clean, straight rising channel, forming higher highs and higher lows over the past several weeks. This structure provides a controlled bullish bias, but we are approaching an inflection point.
Black Mind Curve Support (Evidence 2):
A curved trendline (Mind Curve) is providing dynamic support. This curve intersects with the lower boundary of the rising channel—creating a confluence zone, which is likely to act as strong short-term support or the base of a reversal.
Major BOS (Break of Structure):
A significant bullish BOS occurred earlier, confirming momentum strength. This previous break is acting as a reference point for bullish continuation scenarios.
📉 Bearish Scenario:
If the price breaks below the channel and mind curve support, this would invalidate the current bullish channel structure.
A clean breakout + retest below the support zone may invite strong selling pressure, targeting previous support zones around 1.1500 – 1.1350.
📈 Bullish Scenario:
If the price holds above the mind curve and continues upward, we may see a breakout above the top of the channel.
A confirmed breakout could send price toward the 1.1900 – 1.2000 resistance zone.
Patience is key—wait for a confirmed breakout from the channel (either side) before engaging.
⏳ Strategy Outlook:
✅ Wait for channel breakout confirmation (up or down)
⚠️ Watch for fakeouts or liquidity grabs near channel boundaries
🔁 Mind Curve Support adds another layer of decision-making structure
🧠 Trade with the trend, but remain adaptable to shift if channel breaks
🔍 Summary:
The EURUSD pair is in a decision-making zone—either we get a bullish continuation breakout, or the structure fails and we flip into a bearish correction. The confluence of the straight channel and mind curve makes this setup high-quality for both trend traders and breakout traders.

XAU/USD Potential Head & Shoulders Pattern FormingXAU/USD - Potential Head & Shoulders Pattern Forming 🔍
A possible Head and Shoulders pattern is taking shape on the 2H chart. With the right shoulder now forming and price nearing resistance, this setup could indicate a short opportunity.
🎯 Short Target: 3,304
🛑 Stop Out: 3,370
This setup offers a clean risk-to-reward ratio. Let’s see how price reacts in the coming hours!
💬 Drop your thoughts in the comments – do you agree with this setup? Let's support each other with ideas!
👍 Don’t forget to like and share if you find this helpful – your support means a lot!

Ethereum - This structure decides everything!Ethereum - CRYPTO:ETHUSD - trades at a key structure:
(click chart above to see the in depth analysis👆🏻)
After Ethereum retested the previous all time high in the end of 2024, we saw quite a harsh move lower. This move was followed by an expected recovery, however Ethereum is still trading below a key structure. Either move is still possible and will shape the future of Ethereum.
Levels to watch: $2.500, $4.000
Keep your long term vision!
Philip (BasicTrading)

No change in EURUSDYesterday, EURUSD held above 1,1600 and maintained its bullish momentum.
Keep an eye out for a continuation of the trend and potential new highs.
New buying opportunities may arise after a pullback or on a breakout and retest.
Next target: 1,1706!

Oil Price: Breakout or Fakeout? Watch This Zone Closely Technical Overview:
The current price action is testing the upper boundary of a descending wedge, a bullish reversal pattern. The recent strong green candle indicates a potential breakout attempt, yet price is hovering near a critical resistance level at $74.20 (Fib 0.5).
Key levels from the Fibonacci retracement are:
🔼 Resistance at $74.20 (0.5), then $78.16 (0.618)
🧲 Local support at $69.78 (0.382)
🛡️ Strong demand zone near $63.81 (0.236) if rejection occurs
Structure + Patterns:
Price has been compressing inside a falling wedge, which statistically resolves to the upside.
The breakout candle broke above the 20 EMA and touched the upper wedge resistance — signaling a decision point.
Volume is rising on bullish candles — initial confirmation of buyer interest, but not yet decisive.
Scenarios to Watch
Bullish Case:
Break and close above $74.20 on higher volume → likely move toward $78–$86 resistance zone.
Confirmation of wedge breakout could trigger trend reversal, aligning with bullish fib levels.
Momentum could accelerate if macro factors support demand (see geopolitics below).
Bearish Case:
Failure to close above $74.20 = fakeout risk → price may reject down to $69.78 or even retest $63.81.
Bearish rejection wick on the daily/4H would be an early signal.
Macro & Geopolitical Factors to Monitor:
Middle East Tensions: Any escalation (especially around Iran or shipping lanes) could spike oil due to supply fears.
US Strategic Reserves & Elections: Moves to refill reserves or control inflation could support demand.
China Demand Recovery: Data showing improved industrial output or stimulus from PBoC may strengthen global oil outlook.
Final Thoughts:
Price is at a pivot zone — breaking this wedge with strength could shift the short-to-midterm trend. Until then, this remains a "show me" breakout . Watch how the next 1–2 weekly candles close around the $74–$75 area to confirm direction.

EURAUD Potential Longs - Technical Outlook 17.06.2025Overall Trend & Context:
FX:EURAUD has been in an overall uptrend since mid May when price reacted off a daily demand level.
Technical Findings:
Price is currently trading just above the discount (equilibrium).
Would prefer to see it drop into the discount area - There are areas of demand on the 1h chart which we could possibly consider however the 4h demand shown on the chart above qualifies as a STRONG zone to trade from.
Notes:
If we see a 15m shift in structure it may be worth getting involved.

NZDCAD - a few technical things togetherFib's retracement level of 50.00% will probably give the trend some strong upward impulse,
After that, this "Bull Flag" will come into play, and the price will go up a little bit higher,
The next step is to enter the price into the current "Most meaningful" channel...
Our take profit is: 0.82550. (Near +24 pips from current price).

Bitcoin potential short tradeThe world is unstable and the crypto market is consolidating, I don’t expect a break out to all time high or new lows soon. Just a ranging market for now.
Entry: $109,700
Stop-loss: $110,919
Take-profit: 102,500
Let’s see this probability 70% chance of playing out ✔️

EURUSD LongHere is our EUR USD Signal that we posted
As you can see it's running nicely at 258 Pips.
EURUSD Buy
📊Entry: 1.13538
⚠️SL: 1.12594
✔️TP1: 1.14732
✔️TP2: 1.16256
✔️TP3: 1.18194
We have 5 big swing trades running at present, all of which comes from our trading strategy that is solely based on pure maths. So far in 2025 we have hit 1 stop loss from over 100 trades.
My point to this post is to encourage you all to keep trying, don't give up. It took us over 2 years to perfect this strategy, and we know it works.
If you want any help just ask me, and I will help you.

Gold (XAUUSD) Technical Analysis : MMC Setup Confirmed + Target📊 1. Market Structure Overview
After a strong rally earlier this month, XAUUSD entered a corrective phase and formed a descending trendline which acted as resistance for multiple days. This trendline has just been tested and broken, suggesting that the correction may be coming to an end.
At the same time, price is showing signs of strength by bouncing off the lower boundary of a long-standing parallel ascending channel—a structure that has acted as dynamic support over the past two weeks.
🧱 2. Key Technical Elements
🟦 Support/Resistance Interchange Zone (S/R Flip)
Price recently interacted with a horizontal S/R interchange zone around the $3,310–$3,330 area.
This zone served as resistance during the earlier part of the trend and is now acting as support after the breakout.
It also overlaps with the mid-section of the ascending channel, adding confluence to this support area.
📐 Descending Trendline Break
The break above the descending trendline signals a potential shift in momentum.
Traders often view this kind of breakout as an early indicator of bullish continuation, especially when combined with volume or retests.
🟩 Next Reversal/Target Zone
A green box is highlighted around the $3,345–$3,355 zone, which could act as the next resistance or reversal level.
This is based on prior market structure and Fibonacci extension zones.
This area may offer a take-profit level for longs or a short-term reversal zone for countertrend traders.
🔍 3. What to Watch
✅ Bullish Scenario
If the price sustains above $3,310 and holds above the broken trendline, we could see a push toward the $3,345–$3,355 area.
Ideal long entries may occur on a retest of the trendline or the S/R flip zone, confirming it as support.
❌ Bearish Scenario
Failure to hold above the $3,300–$3,310 support region would invalidate the breakout.
A clean break below this zone could result in a drop back to the lower parallel channel boundary near $3,270 or even lower.
⚙️ 4. Trading Plan & Bias
Short-term Bias: Bullish (Trendline break + support hold)
Mid-term Bias: Cautiously Bullish (until major resistance is tested)
Risk Management: Stop-loss for long entries should be placed below $3,300 with targets near $3,345 and $3,355.
💬 Conclusion
This setup presents a classic case of trendline breakout + S/R flip confluence, which often leads to favorable risk/reward opportunities. Gold traders should monitor the retest behavior around current levels closely, as it will likely determine the next directional move.
📌 Always wait for confirmation, manage risk, and don’t chase moves—especially near major zones.

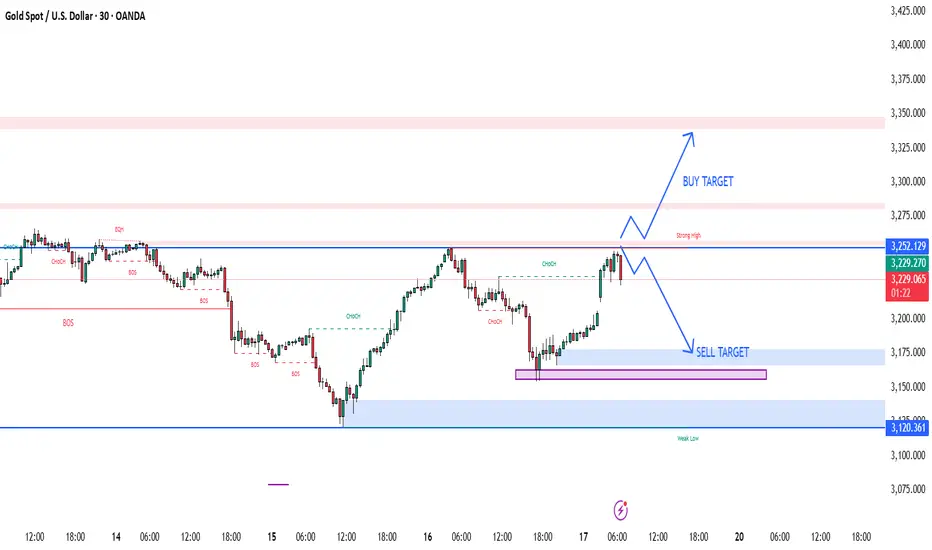
BEST XAUUSD M30 BUY & SELL SETUP FOR TODAY 📉📊 Gold (XAU/USD) Technical Outlook – Key Decision Zone Incoming! ⚠️📈
Gold prices are currently testing a crucial support zone around 3,251, following a strong bearish momentum. As shown on the M30 chart, the market is now at a make-or-break level, where two potential scenarios could unfold: either a bullish reversal toward the 3,280–3,300 area if price holds and confirms support ✅, or a bearish continuation if the level breaks, pushing price lower toward 3,220 or beyond ❌. Traders should watch for price action signals and wait for a clear breakout or strong bounce confirmation before entering any trades 🧠🔍. This is a high-volatility reaction zone — trade smart! 🎯📉📈


XAUUSD M30 BEST BUY AND SELL SETUP FOR TODAYGold (XAUUSD) is trading near a 🔴 strong resistance zone (3,239–3,252). If price shows a bearish rejection from this area, it could be a sign of a 🧨 liquidity grab or fake breakout. This sets up a potential 📉 sell opportunity, targeting the support zones at 3,175 and possibly down to 3,120 where the 🧊 weak low and demand lie. A safe 🛑 stop-loss can be placed above 3,260 to manage risk. However, if the price gives a strong breakout and 📈 retest above 3,252, then a bullish continuation toward 3,325–3,350 is likely 🎯. Patience is key—wait for clear confirmation before entering the trade ⚖️📊.
TBO TEK LTD – 19 May Trendline Resistance Test Incoming 📌 Trade Plan (Aggressive Swing Setup):
Buy above: ₹1,250 (on breakout + volume confirmation)
Stoploss: ₹1,195
Target 1: ₹1,310
Target 2: ₹1,385
Sell Below: ₹1,180 (if price rejects the trendline with high volume)
🔎 Technical Insights:
Strong volume buildup near resistance
RSI trending upwards with bullish momentum
Trendline acting as dynamic resistance since Nov 2024
For Education Purposes Only
