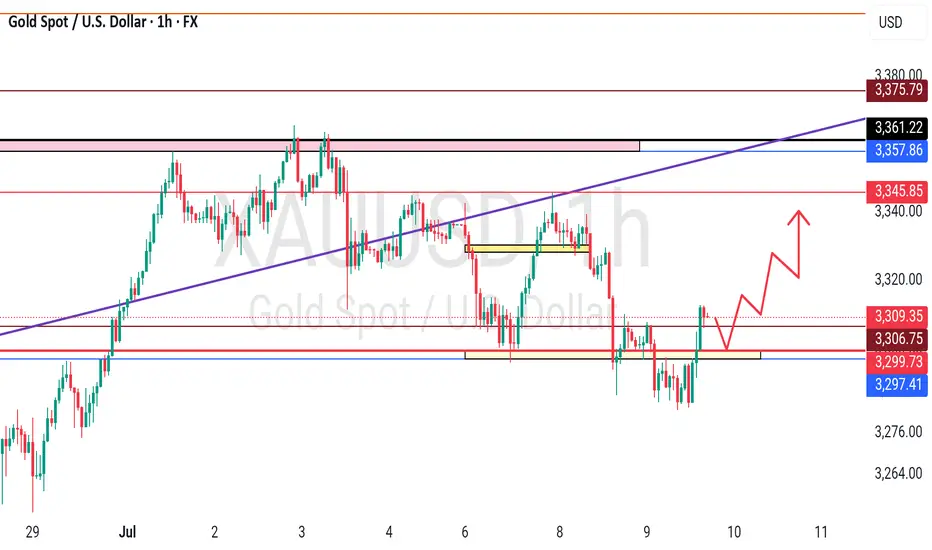
GOLD .. Alternative scenarios, long now??#GOLD.. market perfectly brokenhis today resistance that was at 3296-97
So now if market rholds above and sustains then bounce expected towards 3340 again..
Good luck
Trade wisely
Tradingsignal
Gold (XAU/USD) at a Critical Level – Key Zones to WatchCurrently, there is mixed bias in the market. On the higher timeframe (D1), the candle is rejecting with strong momentum, indicating selling pressure. However, there is also a possibility that it is forming a bottom wick, which could lead to a rejection from key levels like 2930.
Key Observations:
If 2930 acts as support, we may see a bounce, leading to a potential upside move.
If 4H sustains below 2930, it could indicate further downside continuation.
Trade Setup: 30m
🔹 Buy above 2045 if price shows bullish confirmation.
🔹 Sell below 2030 if price sustains under this level.
📊 Waiting for price action confirmation before entering a trade.

Chainlink - Preparing for trend reversalBINANCE:LINKUSDT (1D CHART) Technical Analysis Update
LINK is currently trading at $16.39 and currently we are seeing trend reversal and heading towards breakout from the bearish trend, if the price continues the bullish momentum we expect a clear breakout and bullish start of the bullish trend.
Entry level: $ Enter after breakout 18
Stop Loss Level: $14
TakeProfit 1: $ 20
TakeProfit 2: $ 22
TakeProfit 3: $ 26
TakeProfit 4: $ 30
TakeProfit 5: $ 35
Max Leverage: 2x
Position Size: 1% of capital
Remember to set your stop loss.
Follow our TradingView account for more technical analysis updates. | Like, share, and comment your thoughts.
Cheers
GreenCrypto

#APEUSDT remains bullish📈 LONG BYBIT:APEUSDT.P from $0.7715
🛡 Stop Loss: $0.7640
⏱ 1H Timeframe
✅ Overview:
➡️ BYBIT:APEUSDT.P is showing strong upward momentum, breaking through resistance levels and heading toward a new liquidity zone.
➡️ POC (Point of Control) at $0.6958 – a key volume area that acted as an accumulation zone before this move.
➡️ The price has broken out of consolidation and is approaching $0.7820 – $0.7910, where resistance was previously observed.
⚡ Plan:
➡️ Enter long after a breakout above $0.7715, confirming the bullish movement.
➡️ Stop Loss at $0.7640 – placed below the nearest support level.
🎯 Take Profit Targets:
💎 TP 1: $0.7820
🔥 TP 2: $0.7910
🚀 BYBIT:APEUSDT.P remains bullish – expecting further upside movement!
📢 BYBIT:APEUSDT.P is showing strength but approaching key resistance levels. At $0.7820 – $0.7910, watch for price reaction.
📢 If volumes support the breakout, further growth is likely.
📢 However, partial profit-taking is a wise approach.

ATOM LongThis chart represents a long-term price action view of ATOM/USDT, showcasing the accumulation phase and a potential future bullish trend.
The current price action suggests that ATOM is in a period of accumulation around the $4.80 - $5.00 zone. The highlighted region in blue represents a potential area for price to push into, driven by buysid liquidity, with the expectation of a possible breakout towards the $17.20 target.
Key points:
Accumulation phase around the $4.80 - $5.00 range.
Potential bullish movement towards $17.20, driven by liquidity zones.
Key low as a critical support zone, protecting the downside.
Target levels around $17.20 for upside potential.
Always monitor the price action closely for any confirmation before executing a trade.

NEAR IS READY TO MAKE A MOVE !!!Currently we got a Change Of Character on #NEARUSDT on 4hrly time frame, which indicates the sign of strength.
By this, we may see #NEAR tapping into it's support and then bullish move upto targets as mentioned in chart

ALUMINIUM - Short Opportunity in sight PEPPERSTONE:ALUMINIUM is nearing a critical resistance zone that has consistently acted as a barrier for bullish momentum. This area aligns with prior supply levels and may attract seller interest.
If rejection patterns, such as bearish engulfing candles or long upper wicks, appear, I anticipate a move toward 2,600. A break above this resistance could indicate a shift in sentiment.
What you should monitor closely is confirmation before entering short positions. If you have any thoughts or agree with this analysis, I’d love to hear your perspective in the comments!

EURJPY LongHi Everyone,
Hope you're ok. Here is our signal for EURJPY. I hope that it brings profit for you all.
We want the 15 minute candle to close above the entry, and then respect the entry. Then we will enter.
RiskReward is essential. If you are blowing an account, only once, you are doing something wrong. Probably your lot size is too big. Take the time to learn.
EURJPY Buy 🦇
📈Entry: 162.160
⚠️SL: 160.435
✔️TP1: 163.899
✔️TP2: 165.902
✔️TP3: 168.548
Happy trading hope you all make lovely profit. Drop me a like if you do.
Best wishes

DOGE Ready to Soar Breakout Confirmed with Consolidation AboveBreakout Confirmed
The price has broken out of the symmetrical triangle pattern on the 4-hour timeframe, indicating a bullish momentum.
Higher Time Frame Alignment
If higher time frames (like daily or weekly) are also showing bullish signs, it strengthens the breakout's validity and suggests the trend is likely to continue upwards.
Consolidation Above Trendline
The price is consolidating above the previous resistance (upper trendline), which has now turned into support.
This consolidation is a healthy sign of market strength, as it allows buyers to gain control before the next leg up.
Next Move
A breakout from this consolidation phase would confirm the continuation of the uptrend.
Immediate targets are $0.42 and $0.45, with a potential to move toward $0.50 if bullish momentum sustains.
Entry Strategy
Wait for a bullish breakout from the consolidation with increased volume for a safer entry.
Place a stop-loss just below the trendline or consolidation zone.
Risk Management
Maintain proper risk-reward ratios to account for any potential pullbacks.

LINK on the Verge Bullish Breakout Sparks Momentum !Pattern
The chart shows a descending wedge pattern. This is generally a bullish pattern, indicating potential price reversal or breakout to the upside.
Breakout
The price has broken above the upper trendline of the wedge. This breakout is a positive signal, suggesting that bullish momentum is building.
Volume Confirmation
Check if there’s an increase in volume during the breakout. A breakout with strong volume provides confirmation.
Retest
After a breakout, it's common for the price to retest the previous resistance (now turned support). Waiting for this retest can provide a safer entry point with reduced risk.
Targets
First target: The recent swing high near $24.50.
Second target: $28.50, where there’s visible resistance.
Risk Management
Place a stop-loss below the breakout level or the lower trendline of the wedge in case the breakout fails.

Trading opportunity for Bitcoin BTCUSDTBased on technical factors there is a Buy position in :
📊 BTCUSDT
🔵 Buy Now
🪫Stop loss 91700.00
🔋Target 99000.00
📏 R/R 2.5
💸RISK : 1%
We hope it is profitable for you ❤️
Please support our activity with your likes👍 and comments📝

XAUUSD prices increased mainly due to Russia-Ukraine tensionsPreviously, investors expected that Mr. Trump could end the Ukraine conflict within 24 hours as announced after his election. Expectations that geopolitical tensions will cool in many areas have caused gold to plummet, from a peak of 2,789 USD/ounce recorded today, October 30, to 2,540 USD, November 14.
But now, the forum in Ukraine may change. Ukraine believes that US long-range missiles can "change their address", while Russia will certainly respond strongly if Kiev uses long-range missiles to target Russian territory.
According to Bloomberg, Moscow has just attacked Ukraine and launched a long-range missile made by an American manufacturer into Russia's Bryansk province. This is a very bad signal for this area.
With the latest forums, gold recorded a very rapid increase in purchasing power. Goldman Sachs has just reported that gold will reach 3,000 USD/ounce in 2025.
In the medium and long term, gold is still supported by the interest rate cycle of the US Federal Reserve (Fed).
🔥 XAUUSD BUY 2622 - 2620🔥
💵 TP1: 2630
💵 TP2: 2635
💵 TP3: OPEN
🚫 SL: 2614
🔥 XAUUSD SELL 2644 - 2642🔥
💵 TP1: 2635
💵 TP2: 2630
💵 TP3: OPEN
🚫 SL: 2652

Gold's long-term trend is still forecast to increase in price.Geopolitical tensions are expected to cool down under Donald Trump. And the US economy will attract international capital flows. Cash flow poured heavily into many high-risk assets such as the stock market, cryptocurrency market,... thereby putting more pressure on gold.
However, in the medium and long term trend, gold is still forecast to increase in price. Many organizations have not changed their forecasts that gold will reach 3,000 USD/ounce by 2025.
Many experts believe that public debt, leverage and extreme taxes of Mr. Donald Trump have the ability to bring gold prices back to before. After a period of time, many private investors will overcome the debt situation and the pressure to control the US budget. Gold will then increase again.
With the recent sharp decline, it is likely that bottom-fishing demand from the "big players" in the market will increase again. China has stopped buying gold for 6 consecutive months, but may return to buying when prices fall deeply. China, Russia and many other countries are still accelerating the process of reducing the proportion of reserve assets denominated in USD.
🔥 OANDA:XAUUSD BUY 2590 - 2592🔥
💵 TP1: 2600
💵 TP2: 2610
💵 TP3: OPEN
🚫 SL: 2583
🔥 OANDA:XAUUSD SELL 2628 - 2630🔥
💵 TP1: 2620
💵 TP2: 2610
💵 TP3: OPEN
🚫 SL: 2637

Gold’s Next Big Move: Election Night’s Hidden Chart Signals!Chart Analysis Summary
In both charts, we see a prominent ascending channel on a higher time frame (HTF), suggesting an overall bullish structure initially. However, there are signs of potential reversals, especially around critical levels where price fails to break higher and instead forms correctional structures. The ascending channel shown aligns with The Rule of Three, as it often precedes reversals after the third touch due to exhaustion in the trend.
Reversal Signal: Double Top with Bearish Flag
The first chart illustrates a double top pattern within the broader ascending channel, a common reversal signal. This pattern suggests a weakening bullish momentum, aligning with a probable corrective phase. Following the double top, we observe a bearish flag or descending channel, indicating that the price may continue downward after a break. This aligns with Patterns within Patterns, where a smaller bearish flag within a larger corrective structure increases the probability of a downside move.
Bull Flag Structure and Liquidity Zone Testing
The second chart labels a large bull flag on the higher time frame (4H) near a liquidity zone. The corrective phase within this flag aligns with the market psychology of retracement after an impulsive move. Multi-Touch Confirmation indicates that these structures gain credibility with multiple touches on key support/resistance lines, making the upcoming third touch a critical point for deciding the direction.
Potential Entry and Exit Scenarios
Based on Entry Types from your strategy:
High-Probability Entry: Enter on a break of the corrective structure (such as the bear flag or descending channel) following multiple touches. Place a stop loss above the recent high if you’re anticipating a downside continuation, using a reduced-risk entry if you see low-momentum candles and ascending channels close to the top.
Wait for Confirmation: Given the corrective nature, it might be safer to wait for a confirmed breakout rather than entering at the top without solid confirmation. Back-tested data often shows better results when entries are taken after the third touch or initial pullback post-breakout.
Confluence of Multi-Touch and Patterns
The multi-touch confirmation method supports the idea of a third touch before a potential breakout or breakdown. Additionally, patterns within patterns enhance reliability, as seen with ascending or descending channels within larger structures, suggesting the market’s next probable moves more accurately.
Strategy Application:
Assess the Momentum: Enter on the first pullback (flag formation) after a significant breakout if momentum is strong. For a conservative approach, watch for a third touch on the boundary of the corrective channel.
Risk Management: As part of your trading plan, place stops conservatively to avoid getting caught in corrective waves, as tight stops near liquidity zones may result in unnecessary stop-outs.
Psychological Preparation: Avoid the perfectionist trap; if the confluence signals are strong but not perfect, following the 80/20 rule may be more beneficial than waiting for ideal entries, as markets rarely align perfectly with expectations.

$DOGS Trading Idea: Falling Wedge Breakout with Retest IncomingWe’ve just witnessed a classic breakout from a falling wedge pattern on BINANCE:DOGSUSDT . After an extended downtrend, marked by lower highs (LH) and lower lows (LL), the asset broke through the wedge resistance, signaling a potential bullish reversal. This pattern, known for its bullish nature, often indicates an upcoming shift in momentum from sellers to buyers.
Key Levels & Strategy:
Entry Point: The optimal entry for this trade would be around the 0.001030 area, which coincides with an order block (OB) just below the current price action. This level presents a good opportunity as we expect DOGSUSDT to retest this zone before making its move upwards.
Stop Loss: For risk management, consider placing your stop loss slightly below the OB. There are two scenarios to accommodate different leverage profiles:
High Leverage Traders: Use a stop around 0.001010 to manage the increased risk.
Low Leverage Traders: A more conservative stop should be set around 0.000974 to allow room for volatility.
Take Profits: Scaling out profits is key in volatile markets like DOGSUSDT. Here are the take profit (TP) levels:
TP1: 0.001163, aligning with a strong resistance point.
TP2: 0.001346, marking the next major liquidity zone.
TP3: 0.001659, the upper target where DOGSUSDT could reach if bullish momentum sustains.
Market Sentiment:
The overall market structure has been shifting in favor of the bulls after several CHoCH (Change of Character) moments during the downtrend, hinting that bears are losing strength. The falling wedge breakout further supports the case for an upside movement. In such scenarios, patience is key as we wait for the retest of the OB and the market to confirm bullish momentum.

NEAR Trading targets 2024-25Quick T/A update for September 2024 - December 2025
Monthly chart of NEAR price from the beginning. Purple and blue fibs are what I call 'Origin Fibs', which I use for medium to long-term crypto trading. When close together they can create trading zones that I check for historic resistance and support. One of my principles is that zones need to become 'confirmed support zones' before a meaningful push to the higher zones becomes more likely to occur.
With crypto, hype and fear dramatically influences price, which is expressed in big peaks and sudden troughs. I therefore take a longer term view.
With NEAR, the $8-$9 zone is a confirmed support zone, which in my view increases the likelihood of this zone being overcome in the short term and reduces the likelihood of a confirmation move (i.e. price can shoot through it without requiring a re-touch for confirmation).
Trading Target Zone I ($11-$14) however, is a yet-unconfirmed support zone and therefore a different story. Selling in the high end within this zone, can result in a good buying opportunity later as the price meanders back down (potentially as low as $11, with an intra-month spike even below that) to confirm this zone as a support zone.
Trading Zone II is highly likely to spark a pull-back before it may be overcome later. I'm not speculating beyond this point.
Good luck NEAR hodlers and LT traders.

Bitcoin Analysis | Follow-Up: Key Level & Potential TradeIn this video, I present a follow-up to my previous Bitcoin analysis, diving deep into a crucial key level. I’ll outline a potential trade scenario that could develop in the coming days and discuss why this setup is particularly interesting to me. I also explain which trading setup I prefer and why it’s the best fit for my strategy.
If you find this analysis helpful, please give it a like and share your thoughts in the comments. Your support motivates me to keep creating valuable content for you!

How to win More Trades (Using Probability)I had a shit last 2 days so I am actually taking today off, I have some work to do on one of my cars so I am going to do that today.
This is also very important, taking a break when you aren't feeling that up to it.
But in this video we discuss probability and how probable any given scenario could be in your favor. If you aren't taking this into consideration you aren't doing what you are supposed to do.

USDCHF:Hello Traders,
I'll short the pair after a confirmation, I'm more eager to short around top of the short-term channel.
This is the daily chart, A clear bearish channel is obvious. We have perfectly reacted to the top of this channel.
And this is 2h chart.
A bullish channel formed and is broken now! We even observed a reversal and we are waiting for more bearish days, At least to the middle of long-term channel.

EURUSD analysis week 28☘️The EUR/USD exchange rate fluctuated strongly after the US Nonfarm Payrolls (NFP) report was released mixed on Friday. The price is trading around 1,083 near the three-week peak.
☘️European industrial output fell more sharply than expected. EU-wide retail sales beat forecasts, coming in at 0.3% year-on-year versus an expected 0.1%, but still down from 0.6% previously.
☘️Yarn traders will pay attention to the appearance of Federal Reserve (Fed) Chairman Jerome Powell on Tuesday, followed by final inflation figures from both the EU and US on Thursday. Next Friday will close out next week with German Retail Sales, as well as US Producer Price Index (PPI) inflation and the University of Michigan's Consumer Sentiment Index survey results.
☘️GBPUSD has approached the 1.085 peak area, continuing to bring EURO back to being the world's leading currency. Momentum has shifted in favor of buyers as depicted by the Relative Strength Index (RSI) price increase. The nearest resistance level at 1,085 should prevent a surprise rally after the US data. If the price breaks through that level, the price will reach a recent two-month high around 1,090. On the other hand, if the sellers push the price down, the pair has many important support levels to maintain the stability of the uptrend first around the disputed 1,079 EMA support zone. If this support fails, the next demand zone will be the Break out of the sideway trend at 1.075.
Support: 1,085-1,089
Resistance: 1.079-1.075
Trading signals
SELL EURUSD zone 1.089-1.091 SL 1.093
BUY EURUSD zone 1.075-1.073 SL 1.071

GOLD - one n only support, holding or not??#GOLD... a perfect move is going on according to our video analysis and as you can see market perfectly hold 2 times 2331 32 and dropped.
and our last day supporting area 2321 is still valid guys don't take it easy,
a triangle is also on table. keep close the tringle.
TECHNICAL:
2321 is one of the most important on chart in hour and 4 hours chart. in yesterday market perfectly hold it and now again hat is your area, short only below that area with mentioned tp's
good luck
trade wisely

Gold is driven to return to 2400Despite the increase in the US Dollar and US bond yields, spot gold prices still increased and reached 2,365 USD/ounce.
Data last week showed labor market and price pressures were easing, while weak retail sales data released on Tuesday showed economic activity remained sluggish in the second quarter.
Rising geopolitical risks have fueled gold's bullish trend. Tensions are rising in the Middle East as Israel threatens to attack Lebanon. Combined with the recently signed agreement between Russia and North Korea through President Putin's state visit, this could increase the appeal of gold as it increases geopolitical risks in the region. , is currently trading near key resistance levels reported to readers in yesterday's edition.
Gold is still rising on safe-haven demand as global geopolitical threat levels rise again and global powers move troops on the global strategic chessboard.
Analysis of technical prospects for gold prices
On the daily chart, gold is temporarily limited by key resistance that readers noticed in yesterday's edition after gold moved above the 34 EMA.
The current $2,385 technical level is the closest notable resistance and once it is broken gold has the wherewithal to head for a new bullish cycle with a near-term target of $2,400 raw price.
Support: 2345 - 2336 - 2332 - 2325 - 2320
Resistance: 2370 - 2375 - 2385
SELL zone 2388- 2390 stoploss 2394
BUY zone 2345 - 2343 stoploss 2339
BUY zone 2332 - 2330 stoploss 2326

USTECH Trade Plan Timeframe: 1DUSTECH Trade Plan Timeframe: 1D
#NDX100 #NASDAQ #USTECH #USTECH #TradingOpportunity #Divergence #TradingSignal #USTECHtradingsignal #Forex
Hey traders! 👋 Let's dive into a potential trading opportunity on the USTECH pair using technical analysis. 📊
📉 Previously Bullish Trend:
Firstly, on the 1D- timeframe, we've been witnessing a Bullish trend in the USTECH pair. 🐻
🔄 Bullish Flag :
However, it's crucial to note that recently, we have started to observe a Bullish Flag pattern on the One Day Time Frame. This is an important signal that the Bullish momentum might be More Stronger. 📉🔄
📊 Trade Opportunity:
Currently, we are looking at a potential trade opportunity with a Bullish bias.
📈 Entry Price: 15940
🎯 Stop Loss Level: 14042
🚀TP1: 17826
🚀TP2: 19711
💰 Investment Advice:
Please remember that trading carries risks, and it's essential to have a well-defined trading plan, proper risk management, and stop-loss orders in place. This analysis is for educational and informational purposes only and should not be considered as financial advice. Make sure to do your research and consider your risk tolerance before entering any trade.
Happy trading, and may the pips be in your favour! 🚀📈💰 #HappyTrading #ProfitOpportunity #TradeSmart #CryptoSignal #StockSignal #TradingwithBelieve
