Trading opportunity for GPSUSDTBased on technical factors there is a Buy position in :
📊 GPSUSDT
🔵 Buy Now
🪫Stop loss 0.02200
🔋Target 0.04300
📏 R/R 3,2
💸RISK : 1%
We hope it is profitable for you ❤️
Please support our activity with your likes👍 and comments📝
Tradingsignals

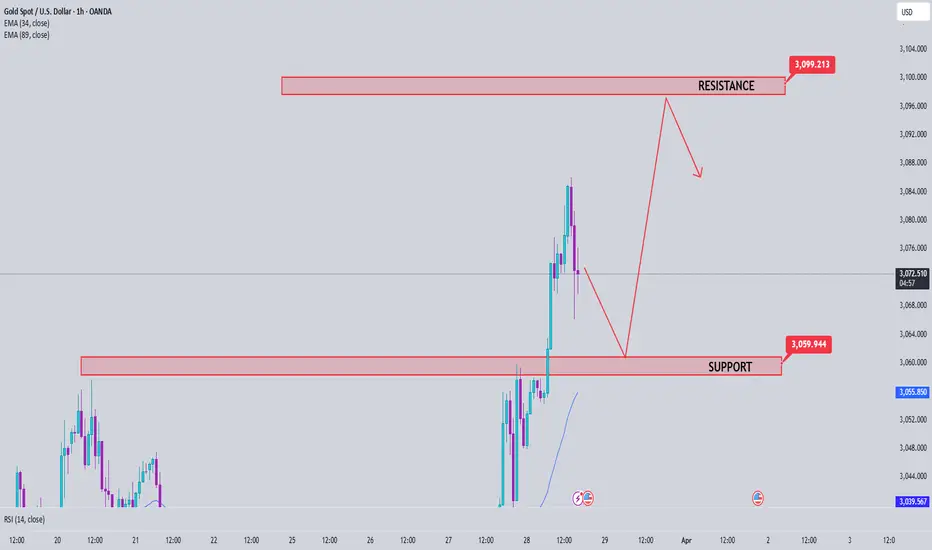
Gold Price Analysis March 31Fundamental Analysis
Gold price attracts safe-haven flows for the third straight day amid rising trade tensions.
Fed rate cut bets weigh on the USD and also lend support to the non-yielding yellow metal.
Overbought conditions on the daily chart now warrant some caution for bullish traders.
Technical Analysis
Gold continues to hit ATH levels and is very difficult to trade with a large amount of Fomo BUY. The important point to retest the BUY signal today is at 3100-3098. And 3145 is the target level for the ATH peak of Gold today.
What do you think of the above analysis? Please leave your comments.

#AUCTIONUSDT shows continued buyer weakness📉 Short BYBIT:AUCTIONUSDT.P from $16.370
⚡️ Stop loss $16.735
🕒 1H Timeframe
⚡️ Overview:
➡️ The POC (Point of Control) is located at $17.734, indicating the highest volume area and now acting as a strong resistance.
➡️ Price BYBIT:AUCTIONUSDT.P continues to trade below the accumulation zone, confirming sellers' control.
➡️ After a local bounce, the chart shows a breakdown below $16.370 — this triggers a potential short setup.
➡️ Target zones are set near previous reaction levels, making them suitable for profit-taking.
🎯 TP Targets:
💎 TP 1: $16.165
💎 TP 2: $16.040
💎 TP 3: $15.850
📢 Watch for solid confirmation below $16.370 — this would strengthen the case for downside continuation.
📢 If price moves back above $16.735, the short setup is invalidated.
BYBIT:AUCTIONUSDT.P shows continued buyer weakness — downside movement is expected if pressure remains.

Trading opportunity for GRASSUSDTBased on technical factors there is a Sell position in :
📊 GRASSUSDT
🔴 Sell Now
🪫Stop loss 1.9000
🔋Target 1.3200
📏 R/R 1,5
💸RISK : 1%
We hope it is profitable for you ❤️
Please support our activity with your likes👍 and comments📝

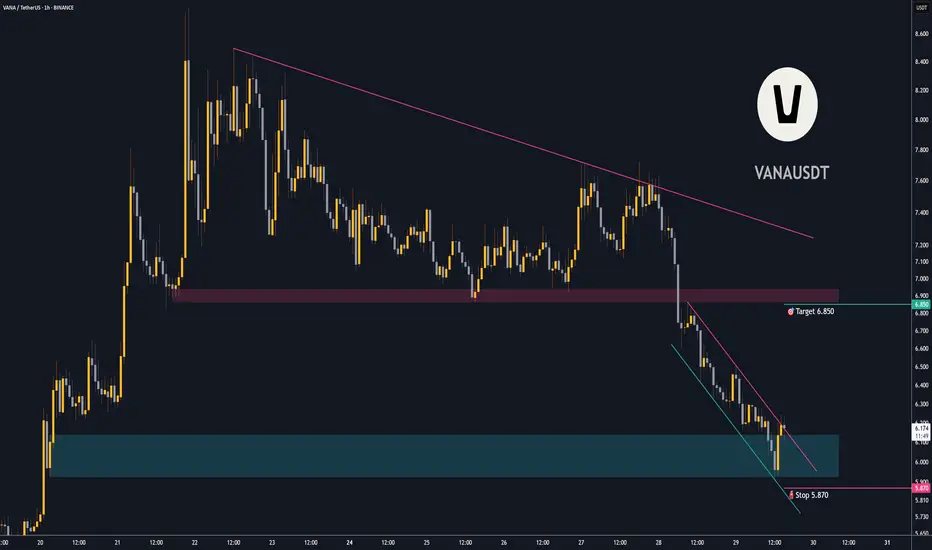
Trading opportunity for VANAUSDTBased on technical factors there is a Buy position in :
📊 VANAUSDT
🔵 Buy Now
🪫Stop loss 5.870
🔋Target 6.850
📏 R/R 2
💸RISK : 1%
We hope it is profitable for you ❤️
Please support our activity with your likes👍 and comments📝
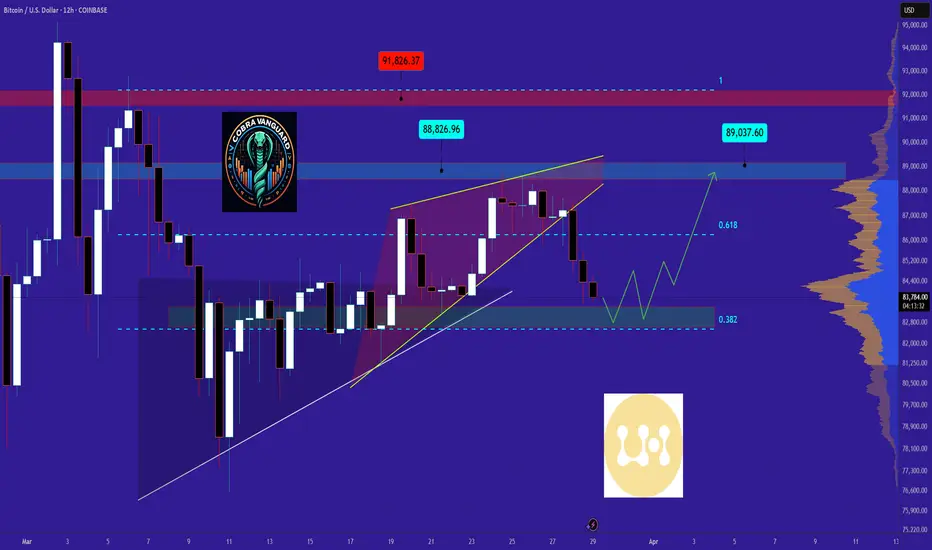
Bitcoin Outlook after the Dip. What to expect NOW?Finally, the price broke the wedge, and the price experienced a significant drop. I think now is the time for Bitcoin to rise again to 89K . STRONG SUPPORT 0.382=82500
Give me some energy !!
✨We spend hours finding potential opportunities and writing useful ideas, we would be happy if you support us.
Best regards CobraVanguard.💚
_ _ _ _ __ _ _ _ _ _ _ _ _ _ _ _ _ _ _ _ _ _ _ _ _ _ _ _ _ _ _ _
✅Thank you, and for more ideas, hit ❤️Like❤️ and 🌟Follow🌟!
⚠️Things can change...
The markets are always changing and even with all these signals, the market changes tend to be strong and fast!!
USDJPY analysis week 14🌐Fundamental Analysis
The Federal Reserve (Fed) kept interest rates unchanged in the 4.25% - 4.50% range and forecast core PCE inflation to average 2.8% by year-end. The higher-than-expected inflation data reinforced expectations that the Fed will maintain current interest rates for an extended period. Investors are concerned that these tariffs could add to global inflationary pressures and trigger a recession.
In Japan, the Tokyo CPI rose sharply in March, boosting expectations that the Bank of Japan (BoJ) will continue to raise interest rates this year. The hot inflation data also supported the Yen's appreciation against other currencies.
🕯Technical Analysis
USDJPY is still in a bullish recovery. The pair is facing support at 149.200, preventing further declines. The weekly high around 151.100 is still acting as key resistance before the pair breaks out to 152.000. Conversely, if the trend breaks at 149.200, weekly support is seen at 148.300.
📈📉Trading Signals
SELL USDJPY 151.300-151.100 SL 150.500
SELL USDJPY 152.000-152.200 SL 152.400
BUY USDJPY 149.300-149.100 SL 148.900

XAU/USD: Possible Fall Ahead? (READ THE CAPTION)By examining the gold chart on the 4-hour timeframe, we can see that, as expected, the price continued its bullish movement and climbed close to its all-time high of $3057, reaching $3056 today. Since this level acted as a Bearish Rejection Block, we’re now seeing a price correction from that area, with gold currently trading around $3049. If the price stabilizes below the $3050 mark, we may see further downside. Potential bearish targets are $3045, $3040, and $3035, respectively.
Please support me with your likes and comments to motivate me to share more analysis with you and share your opinion about the possible trend of this chart with me !
Best Regards , Arman Shaban

Gold Price Analysis March 28Fundamental Analysis
Gold (XAU/USD) continued its upward trend, hitting a record high of $3,086 during the European session on Friday. Global risk sentiment weakened due to concerns over US President Donald Trump's auto tariffs and uncertainty over upcoming tariffs, boosting safe-haven demand for gold.
In addition, expectations of an early Fed rate cut due to concerns over Trump's trade policies affecting US economic growth also supported gold's gains. Although the USD recovered slightly ahead of the US personal consumption expenditure (PCE) price index report, this did not reduce the appeal of XAU/USD.
Technical Analysis
Gold is quite difficult to trade around the ATH zone today. Note that the lower boundary zone of 3060 is converging with the EMA 34 zone and the SELL zone around the 3100 round-trip barrier. The basic trading strategy requires your patience as the market is not easy to trade at the moment.
Gold Analysis March 27Yesterday's D1 candle is still a contested candle with no clear winner. If it maintains this, there may be a strong sell-off on Friday.
The wave structure is expanding in an upward direction after a push into the Asian session. The price is reacting around the 3028 area. If gold cannot break 3028, it is possible to BUY back to the peak of the Asian session in the morning around 3038. If this peak is broken, DCA will add an order towards the target of 3044. On the contrary, if the European session cannot break the peak of 3038, SELL to 3020 and if the US breaks 3020, DCA SELL to 3006. On the contrary, if it does not break, Buy back around 3020 and the gold margin will fluctuate around 3020-3028 until the end of the day.

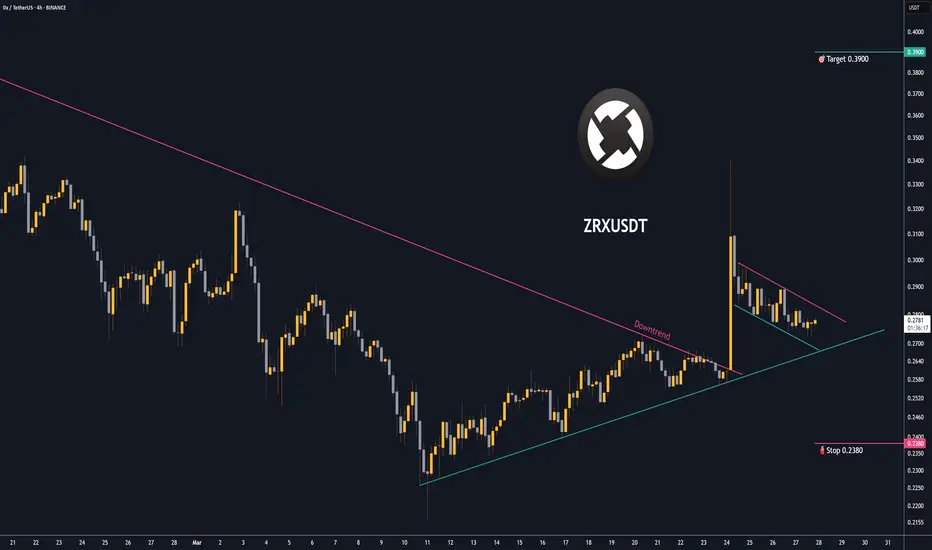
Trading opportunity for ZRXUSDTBased on technical factors there is a Buy position in :
📊 ZRXUSDT
🔵 Buy Now
🪫Stop loss 0.2380
🔋Target 0.3900
📏 R/R 2,7
💸RISK : 1%
We hope it is profitable for you ❤️
Please support our activity with your likes👍 and comments📝
GDP Data in Focus – Gold Traders Prepare for Volatility⚠️ GDP Data in Focus – Gold Traders Prepare for Volatility
🟡 Market Brief – 27/03/2025
📰 Trump’s Latest Tariff Remarks Leave Markets Unshaken
Earlier this morning (end of US session), Donald Trump made new comments on tariff policy.
However, unlike previous occasions, his speech did not trigger significant market volatility.
He stated:
“Reciprocal tariffs will be eased, broadly applied to all countries, but not harshly.”
🔹 A 25% import tariff on cars will take effect from April 2
🔹 No additional tariffs for now on semiconductors or pharmaceuticals
→ It appears the market had already priced in this announcement, resulting in a muted reaction.
📊 Today’s Spotlight – Final US GDP (q/q)
This is the broadest measure of inflation, reflecting price changes for all goods and services included in GDP.
Given the weakness in recent US inflation indicators (CPI & PPI),
AD anticipates today’s GDP may also come in weaker than expected.
⚠️ However, market reaction might remain limited (≈30 pts),
as Core PCE data tomorrow is expected to be the true driver of weekly volatility.
🟡 Gold Strategy – Intraday Setup
Gold may retest resistance levels or recent highs,
before a potential strong move to the downside – the BIG SHORT scenario AD has been tracking.
📌 Plan for Today:
Look for intraday BUY opportunities during the Asian and European sessions,
especially near key support levels marked on the chart.
🧭 Key Technical Levels:
🔻 Support: 3019 – 3011 – 3002 – 2988
🔺 Resistance: 3036 – 3046 – 3056
🎯 Trade Zones – 27/03:
🟢 BUY ZONE: 3002 – 3000
SL: 2996
TPs: 3006 – 3010 – 3014 – 3018 – 3022 – 3026 – 3030
🔴 SELL ZONE: 3055 – 3057
SL: 3061
TPs: 3051 – 3047 – 3042 – 3038 – 3034 – 3030
🧠 Final Note:
This week’s volatility hinges on two major macro releases:
✅ Today’s Final GDP report
✅ Tomorrow’s Core PCE data
→ During Asia & London sessions: respect the levels and trade reactively
→ For New York session: stay alert — AD will update instantly if needed
Good luck, trade safe, and stay disciplined.
— AD | Money Market Flow

Gold Analysis March 26Candle D still shows that the battle between buyers and sellers has not yet been defeated.
3033 Plays an important role in the current downtrend structure. H4 Closes above the 3033 zone, officially breaking the wave and giving priority to the BUY side.
Gold is pushing up and wants to break the dynamic resistance of 3027. Closes above 3027, gold is heading towards 3033-3035. If it does not break this zone, you can SELL to 3005 and if the US breaks 3005, hold to 2983. If the 3033 zone is broken, wait for BUY to break 3033, the daily target is towards 3045.

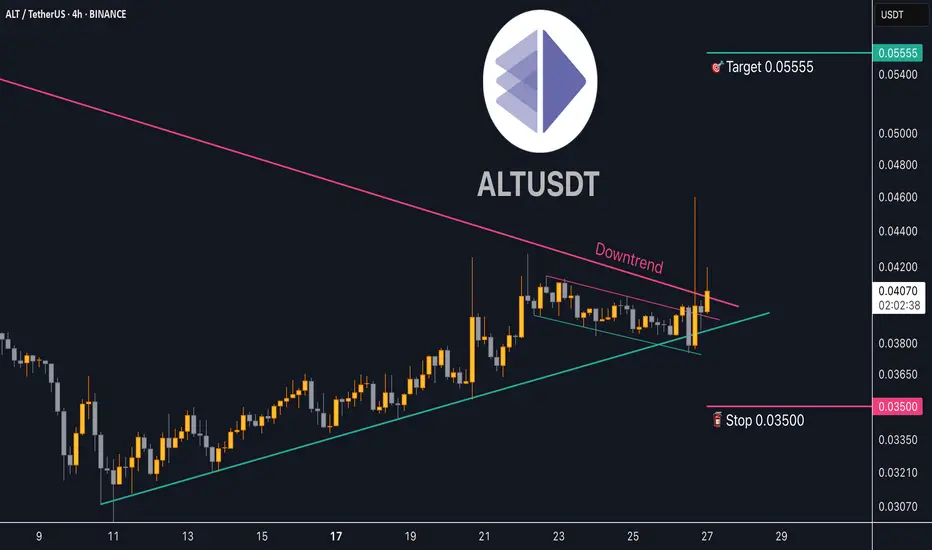
Trading opportunity for Altlayer ALTUSDTBased on technical factors there is a Buy position in :
📊 ALTUSDT
🔵 Buy Now
🪫Stop loss 0.03500
🔋Target 0.05555
📏 R/R 2,4
💸RISK : 1%
We hope it is profitable for you ❤️
Please support our activity with your likes👍 and comments📝
Gold Outlook – Steady Range Before Key Data Hits🟡 Market Context:
Gold has been trading in a steady range since the start of the week, with no significant breakout or momentum shift observed.
Today’s session is expected to remain quiet, as there are no major economic events scheduled.
All eyes are on the Thursday GDP release and Friday’s PCE inflation data from the US — both of which are likely to determine the direction for gold into the end of the month and quarter.
📆 Key Data to Watch:
Thursday: US Quarterly GDP
Friday: US PCE Price Index (Federal Reserve’s preferred inflation gauge)
These events are considered high-impact catalysts that may trigger sharp moves in gold, especially if surprises occur.
🔍 Technical Structure:
Price continues to respect key support and resistance zones identified earlier this week.
There is no confirmed breakout yet, so the strategy remains range-based:
➡️ Trade the levels. Watch for reaction signals at extremes.
➡️ Wait for clearer momentum following the macro releases.
🧭 Key Price Levels:
🔺 Resistance: 3,010 – 3,036 – 3,046 – 3,057
🔻 Support: 3,010 – 3,001 – 2,988
🎯 Trade Plan – 26/03
BUY ZONE: 2988 – 2986
SL: 2982
TP: 2992 – 2996 – 3000 – 3004 – 3008 – 3015
SELL ZONE: 3045 – 3047
SL: 3051
TP: 3042 – 3038 – 3034 – 3030 – 3026 – 3020
🧠 Final Notes:
The market remains in accumulation mode ahead of key US data.
No need to rush — protect your capital, wait for clean setups, and let the market reveal its hand.
— AD | Money Market Flow

Trading opportunity for PEPEUSDTBased on technical factors there is a Buy position in :
📊 PEPEUSDT
🔵 Buy Now
🪫Stop loss 0.00000640
🔋Target 0.00000900
📏 R/R 1,6
💸RISK : 1%
We hope it is profitable for you ❤️
Please support our activity with your likes👍 and comments📝

Gold hit 3300 , why not ? The Conference Board (a non-profit research organization in the United States, specializing in providing reports and analysis on economic issues, jobs, labor markets and long-term trends) announced on Tuesday that the US consumer confidence index fell to 92.9, down from a revised 100 in February.
This data was weaker than expected, as economists had predicted a smaller decline, only falling to 94.2.
Société Générale (SocGen - a large multinational bank based in France) has just announced its multi-asset portfolio strategy for the second quarter. The bank still holds 7% of its portfolio in gold and forecasts that the price of gold could reach $4,000/ounce.
At 7%, gold remains the largest commodity position in SocGen’s portfolio. “Gold remains a strong asset amid the geopolitical reshaping of the US, which has triggered strong policy responses,” the analysts said.
Although gold prices are currently hovering above $3,000 an ounce, SocGen expects gold prices to continue to rise. The French bank forecasts gold prices to average around $3,300 an ounce in the fourth quarter.
Geopolitical uncertainty continues to support gold as an important global currency, the analysts said. They also pointed to conditions that could push prices to $4,000 an ounce.

Trading opportunity for AVAILUSDTBased on technical factors there is a Buy position in :
📊 AVAILUSDT
🔵 Buy Now
🪫Stop loss 0.03700
🔋Target 0.04700
📏 R/R 2
💸RISK : 1%
We hope it is profitable for you ❤️
Please support our activity with your likes👍 and comments📝

Trading opportunity for Grass GRASSUSDTBased on technical factors there is a Buy position in :
📊 GRASSUSDT
🔵 Buy Now
🪫Stop loss 1.1900
🔋Target 1.6000
📏 R/R 1,8
💸RISK : 1%
We hope it is profitable for you ❤️
Please support our activity with your likes👍 and comments📝

Gold Price Analysis March 25The D1 gold candlestick confirmed a clear decline. Some late-day buying pressure around 3000 pushed the gold price a bit.
H4 has formed a bearish wave with an important price of 3028. If H4 cannot break 3028 today, there will likely be a strong sell-off of gold at the end of the day.
Trading scenario. Gold is pushing up from the 3015 price zone. Target in the European session is 3027-3028. If this zone cannot be broken at the end of the session, SELL and hold at 3008. If the US confirms a break of 3008, hold at 2983. In case of a break of 3028, the sellers are weak. Be careful of false break of 3028. If the break is real, wait for 3035 to SELL today.
Gold does not push up to 3027 but closes below 3015, then SELL to 3008. At the end of the session, if it breaks 3008, hold to 2983. If it doesn't break, then BUY again to the 3008 area, target 3028.

Trading opportunity for 1000SATSUSDT SATS (Ordinals)Based on technical factors there is a Buy position in :
📊 1000SATSUSDT
🔵 Buy Now
🪫Stop loss 0.0000950
🔋Target 0.0001850
📏 R/R 2,2
💸RISK : 1%
We hope it is profitable for you ❤️
Please support our activity with your likes👍 and comments📝

USOIL - at resistance ? What's next ??#USOIL.. market just reached at his resistance area.
Keep close it and if market thold it in that case we can see again drop from here.
Don't be lazy here..
Good luck
Trade wisely

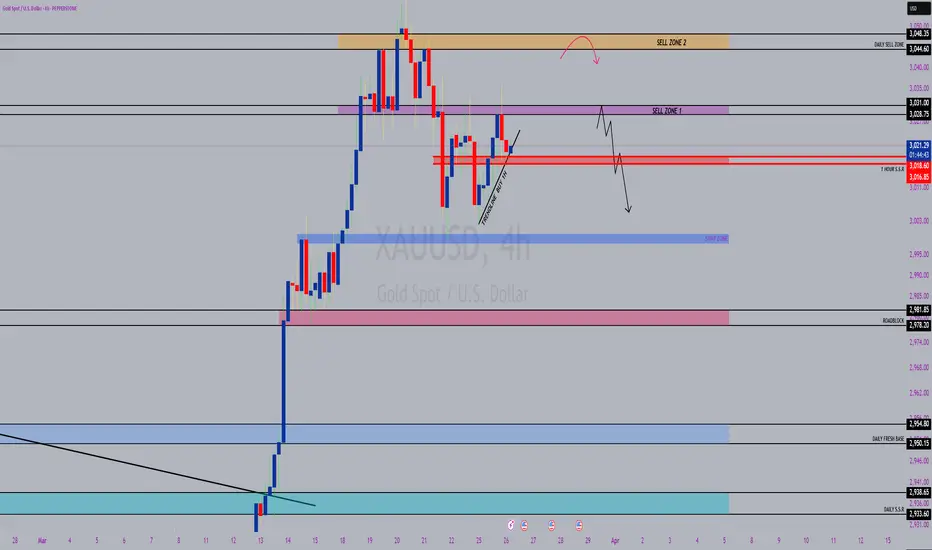
GOLD, XAUUSDTHIS ANALYSIS FOR "XAUUSD , GOLD" ON MULTIPLE TIME FRAME.
- What i can see on Gold right now price wanna make a big retreacement on daily time frame as we can see DXY already make clear breakout resistance on time frame 4 hour, possible now its time for DXY make a retracement.
- If trendline 1 hour and 1 hour S.S.R zone breakout just wait price comeback into this zone then we can SELL
- Or we can find opportunity on SELL ZONE 1
- If price make Sell desicon point on sell zone 2 please hold the position a bit far
- But if price break Sell zone 2 and minor resistance we just focus Buy
#TradeWhatYouSeeNotWhatYouThink
All the best !!!
If you want more update on "XAUUSD , GOLD". Kindly follow and like.
Feel free to comment my outlook and share with your friends. Thanks!