Trading opportunity for AMP AMPUSDTBased on technical factors there is a Buy position in :
📊 AMPUSDT
🔵 Buy Now or by Breakout
🪫Stop loss 0.003700
🔋Target 0.006000
📏 R/R 3,5
💸RISK : 1%
We hope it is profitable for you ❤️
Please support our activity with your likes👍 and comments📝
Tradingsignals

#BERAUSDT shows bullish momentum 📈 Long BYBIT:BERAUSDT.P from $8.080
🛡 Stop loss $7.905
🕒 1H Timeframe
⚡️ Overview:
➡️ The main POC (Point of Control) is at 6.699, indicating the area of highest volume accumulation.
➡️ The 7.905 level acts as the nearest support zone and is a key stop-loss reference point.
➡️ The chart BYBIT:BERAUSDT.P shows a strong bullish breakout with consolidation above previous range, signaling a possible trend continuation.
➡️ Rising volume confirms strength behind the move.
🎯 TP Targets:
💎 TP 1: $8.204
💎 TP 2: $8.320
💎 TP 3: $8.430
📢 Watch key levels closely — better to enter after signal confirmation!
📢 If the price holds above $8.080, the TP targets are likely to be hit.
📢 If stop level is breached, the setup may need reevaluation.
BYBIT:BERAUSDT.P shows bullish momentum — looking for further upside!

GBPAUD Bearish Breakout Imminent: Points to Potential Downside4-hour chart of GBPAUD reveals a critical juncture. We've observed a recent uptrend culminating in what appears to be a rising wedge formation. This pattern, characterized by converging trendlines, often signals a potential reversal, particularly after a sustained bullish run. The upper trendline has faced repeated tests, indicating weakening upward momentum. Crucially, the 2.04938 level acts as immediate support. A decisive break below this point would validate the wedge breakdown and likely trigger a significant bearish move.
Key Levels and Targets:
Immediate Support: 2.04938
Target 1: 2.03263 (Initial downside target)
Target 2: 2.00516 (70.0% Fibonacci Retracement)
Target 3: 1.97478 (100.0% Fibonacci Retracement)
Fibonacci Analysis: The price action has breached the 50.0% retracement level, suggesting a potential continuation towards the 61.8% and lower levels. The 70.0% and 100.0% retracements are critical downside targets.
Trading Implications:
Short Entry: A confirmed break below 2.04938 is the primary trigger for a short entry.
Stop Loss: A conservative stop-loss should be placed above the recent swing high or the upper trendline of the wedge to mitigate risk.
Risk Management: Given the potential for volatility, prudent risk management is essential.
Considerations:
Confirmation: A break below 2.04938 must be accompanied by strong bearish momentum and ideally, increased volume to validate the signal.
Fundamental Factors: Keep a close eye on upcoming economic data releases from both the UK and Australia, as these can significantly impact the pair.

Trading opportunity for STPTUSDTBased on technical factors there is a Buy position in :
📊 STPTUSDT
🔵 Buy Now
🪫Stop loss 0.04200
🔋Target 0.06450
📏 R/R 3
💸RISK : 1%
We hope it is profitable for you ❤️
Please support our activity with your likes👍 and comments📝

ETH/USD Breakout – Long Position Activated!Hi Traders ! Ethereum on the 1H chart has been trading within a descending channel and is now testing the upper boundary. I’ve placed a long entry expecting a breakout, targeting the $2,061 - $2,070 zone. Stop-loss set in case of a false breakout. RSI is showing signs of recovery. Let’s see how it plays out! 🔥👀
Disclaimer: This is not financial advice. Trade at your own risk. 🚨

Gold Price Analysis March 24Fundamental Analysis
Meanwhile, the US Dollar (USD) is struggling to capitalize on a three-day rally from multi-month lows amid expectations that a tariff-driven US economic slowdown could force the Federal Reserve (Fed) to resume its rate-cutting cycle soon. This, coupled with geopolitical risks, acted as a non-yielding driver for Gold and helped limit downside momentum. Hence, it would be prudent to wait for a strong follow-through before confirming that XAU/USD has topped out in the near term and positioning for any meaningful corrective slide.
Technical Analysis
Friday's D1 saw strong selling pressure with the sharpest drop from 3046 to 3000. Late in the day, bulls pushed the price back 50% of the D candle. This shows that bears have entered the market but the downtrend will take some time.
The h4 structure is quite nice to see the buy and sell wave structure.
Scenario 1: In the 3026 zone of the European session, selling pressure has appeared. If the price pushes up to break the 3026 zone at the end of the session, it will give a BUY signal, break 3026, target 3037. When the US session breaks 3037, keep the order until 3045. The 3045 zone gives a good SELL signal for today if the price finds it. When the price reaches 3037 and cannot break this zone when the US enters, it can SELL to 3026, further than 3018. Scenario 2: The price does not break 3026 but falls, then wait for support around 3013 and support 3003.

Gold prices remain on the riseLast week, the world gold price surpassed the historical peak of over 3,057 USD/ounce but quickly decreased due to profit-taking pressure from investors. However, the price remained above the psychological support level of 3,000 USD/ounce - a level that many experts predicted would be an important support in the coming time.
The general sentiment in the market is still leaning towards optimism. Many central banks continue to increase their gold reserves as a way to diversify away from the USD. Meanwhile, individual investors and ETFs have also begun to return to the gold market.
Data from the SPDR Gold Shares fund shows that the amount of gold held has increased by more than 37 tons this year, to 910 tons. Although this figure is still lower than in 2020, the upward momentum is returning due to concerns about inflation and escalating trade tensions.

Trading opportunity for FLRUSDTBased on technical factors there is a Buy position in :
📊 FLRUSDT
🔵 Buy Now
🪫Stop loss 0.01350
🔋Target 0.01900
📏 R/R 3
💸RISK : 1%
We hope it is profitable for you ❤️
Please support our activity with your likes👍 and comments📝

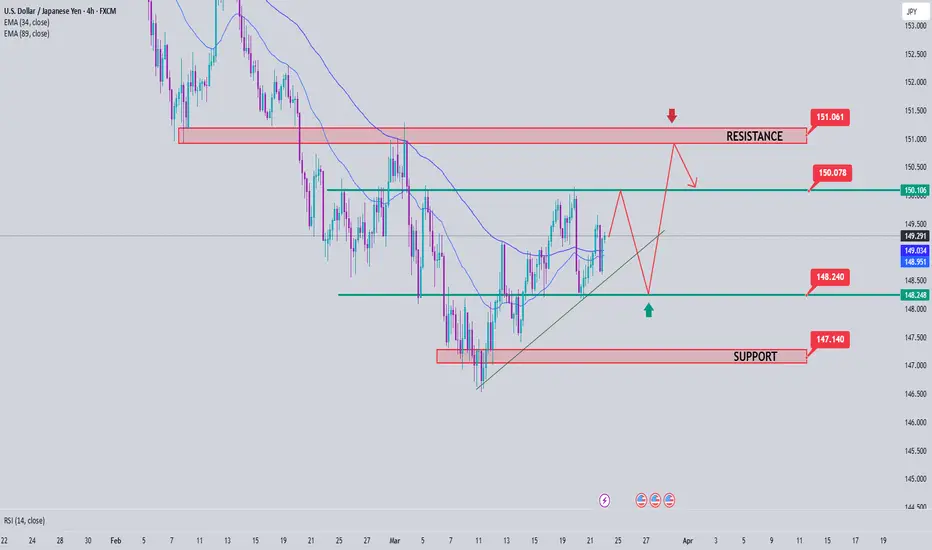
USDJPY Analysis week 14Fundamental Analysis
The US dollar continues to attract cash flows as the US Federal Reserve (Fed) is unlikely to cut interest rates in the near future. Fed Chairman Jerome Powell stressed that the Fed is in no hurry to adjust policy amid growing economic uncertainty under President Donald Trump, while warning of the negative impact of tariff policies on growth and inflation.
In the Asia-Pacific region, weak Japanese CPI data in February put pressure on the Yen (JPY), although the growth rate still reached 3%. However, expectations of tightening policy by the Bank of Japan (BoJ) remained after the Rengo union announced a 5.4% wage increase this year.
Technical Analysis
The short-term range is limited to 150,100-148,200. This border area is also very easy to break because there is a lot of buying and selling in this area and just enough factors will break the border area. Krado is aiming for the resistance area of 150,900 which will be the weekly resistance area. Important support when the price breaks out of the trendline is extended to 147,300 for buying force to jump into the market.
Eth to $2,500?Hello friends! Well, I'm sharing my opinion. Eth is feeling boring. There isn't much volatility, however, the rebound is clear. It's clear that it will be testing the $2,250 area. However, there are two scenarios:
A) A brief approach with a very sharp rejection.
B) A strong upward breakout to use the $2,250 area as support and reach the famed $2,500, which is a highly liquid area.
In conclusion, the price will seek the $2,250 area early in the week, and buying pressure will determine the final direction.
Disclaimer: This is only an opinion; it should not be used as investment advice or recommendation.

Trading opportunity for FLOKIUSDTBased on technical factors there is a Buy position in :
📊 FLOKIUSDT
🔵 Buy Now
🪫Stop loss 0.00005200
🔋Target 0.00009000
📏 R/R 2,3
💸RISK : 1%
We hope it is profitable for you ❤️
Please support our activity with your likes👍 and comments📝

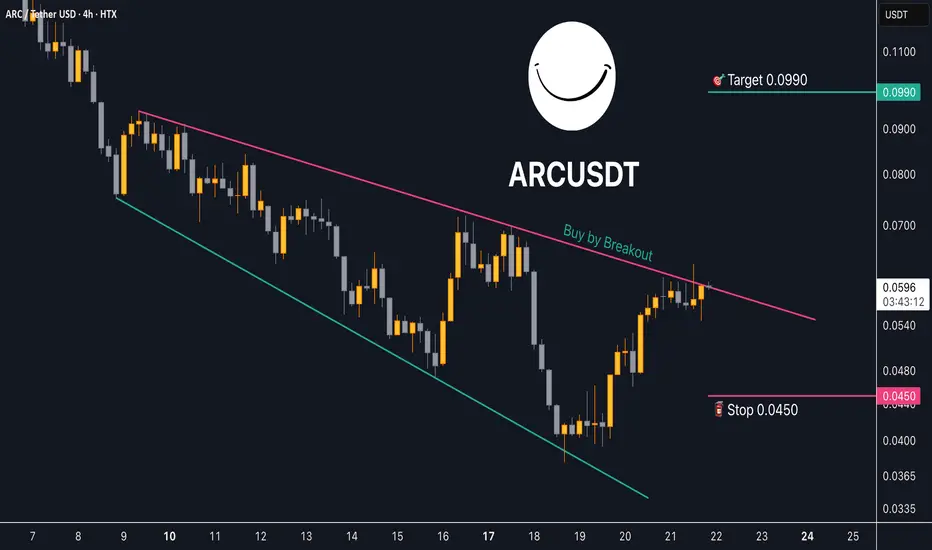
Trading opportunity for AI Rig Complex ARCUSDTBased on technical factors there is a Buy position in :
📊 ARCUSDT
🔵 Buy Now
🪫Stop loss 0.0450
🔋Target 0.0990
📏 R/R 2,7
💸RISK : 1%
We hope it is profitable for you ❤️
Please support our activity with your likes👍 and comments📝
Gold price analysis March 21⭐️Fundamental Analysis
The Federal Reserve’s forecast of only two 25 basis point (bps) rate cuts by the end of the year helped the US Dollar (USD) gain positive momentum for the third consecutive day, which, in turn, is seen as undermining the commodity. The decline could also be due to some profit-taking heading into the weekend.
However, bets that the Federal Reserve (Fed) will continue its rate-cutting cycle will limit the USD’s gains and act as a non-yielding driver for Gold prices. Moreover, uncertainty over US President Donald Trump’s aggressive trade policies and their impact on the global economic outlook, coupled with geopolitical risks, deter traders from placing strong bearish bets on the safe-haven bullion.
⭐️Technical analysis
D1 candle has started to show a bearish candle after many consecutive days of increase. However, the buyers have pushed the price from the 3026 area, showing that a strong buying force is still in this area.
The European session, gold traded within the 3025 and 3038 range, the h4 structure shows this. Gold is pushing up to 3038, until the end of the European session, gold cannot break 3038, giving a SELL signal to 3025, the US breaks 3025, then it heads towards support 3008. In the opposite direction, Gold pushes back to 3025 first and does not break this area in the European session, giving a BUY signal to 3038 and heads towards ATH when the US breaks this area. Pay attention to the 2 areas of 3025 and 3038 to trade breakouts.

Gold Price Analysis March 20⭐️Fundamental analysis
Gold prices fell slightly after hitting a record high on Thursday, ending a three-day winning streak. Profit-taking pressure from buyers, along with positive risk sentiment in the market, weakened gold. At the same time, the modest increase in the USD also put downward pressure on gold prices in the European trading session.
However, expectations of an early Fed rate cut could limit the USD's rise, supporting gold prices. In addition, concerns about former President Donald Trump's trade policy and escalating tensions in the Middle East could continue to act as factors driving gold demand. This requires investors to be cautious before making trading decisions.
⭐️Technical analysis
The D1 candle has not yet shown any signs of a reversal in GOLD. Therefore, the trading strategy has not yet shown any signs of peak detection or peak catching. BUY is still easier to win.
Yesterday's US session buy zone 3038 in today's European trading session plays an important resistance zone. Currently, gold has confirmed a break of 3045 for a SELL signal and is heading towards 3038. Before 2 hours of the end of the European session, if gold does not break through this zone, it is still possible to BUY around 3038. 3031 and 3029 play the role of resistance zones for the day when breaking through 3038. Today, waiting for a retest to BUY is the safest

Trading opportunity for ARCUSDTBased on technical factors there is a Buy position in :
📊 ARCUSDT
🔵 Buy Now
🪫Stop loss 0.0310
🔋Target 0.0600
📏 R/R 1,8
💸RISK : 1%
We hope it is profitable for you ❤️
Please support our activity with your likes👍 and comments📝

Nasdaq: Wave A Done – Now Lining Up for a Strong BounceThe Nasdaq is starting to look really interesting here. In my view, we've completed Wave ((a)) to the downside—a clean (abc) correction. Why do I think it's done? Because we've just tapped into a Fair Value Gap (FVG) and saw a strong reaction, just above last year’s VWAP, which I always consider a key reference point on the higher time frame.
Ideally, I would have liked to see that 19,090 level get tagged—unfortunately, we didn’t quite reach it. But honestly, this reaction is solid enough to still keep the bullish scenario intact.
Adding to that, the RSI is now in oversold territory, and the last two times we’ve seen that, it was followed by strong upward moves. Based on all of this, I’m expecting a solid bounce over the coming weeks, likely lasting into Q1 or even Q2 2025 .
Where could this move take us? I see two key zones: the first between 22,000 and 22,425 and the second between 23,320 and 23,675. Could it land somewhere in between? Sure. But one of those zones is where I expect this corrective structure to wrap up. That would likely complete the larger ((abc)) correction, after which we’ll finally begin forming the macro Wave A—which will open the next big leg of structure.
So the bigger picture is in play here. In the meantime, I’ll be hunting for entries on the lower time frames, because I do think we’re setting up for a pretty solid push on this index in the coming weeks.

Watch This Before Trading Delta Airlines Stock in 2025!The Art of Trading: Price Action, Supply and Demand, and Patience in Delta Airlines. Trading in the stock market is a skill that requires a deep understanding of market dynamics, disciplined decision-making, and the ability to remain patient in the face of volatility. Among the most effective strategies for achieving consistent success are price action analysis, supply and demand principles, and meticulous money management. This supply and demand stock analysis will explore how these strategies can be applied to Delta Airlines (DAL), focusing on key price levels, candlestick patterns, and the importance of patience in making informed investment decisions.
A strong demand level for Delta Airlines (DAL) has been identified at $43. This level represents a price zone where buyers have historically shown significant interest, leading to price reversals. By waiting for the stock to retrace to this level, traders can enter positions with a higher probability of success as the likelihood of renewed buying pressure increases.

EURCHF LongHi Everyone,
Hope you are all well and enjoyed my gold signal that hit all TP's
Here is our EURCHF Signal. wait for the 15 minute candle to close above the entry, and then for price to respect the entry, then we can enter. Here are the numbers.
EURCHF Buy
📊Entry: 0.95727
⚠️Sl: 0.95176
✔️TP1: 0.96349
✔️TP2: 0.97141
✔️TP3: 0.98148
Stick to the rules
Hope you all earn lots of profit.
Best wishes,
Sarah

GOLD (XAU/USD) Trading Plan: Can Gold Surge Past $3100?🚀Published by MMFlowTrading on 20 March 2025
📊 Market Snapshot
Gold (XAU/USD) is riding a strong uptrend on the H1 chart, moving within a clear ascending channel 📈. After breaking the $3000 psychological barrier, bullish momentum remains intact 💪. However, with key resistance ahead and US economic data on the horizon, volatility could spike. Let’s break down the setup for today’s trading session! 🧠
🔍 Technical Analysis
Ascending Channel:
Gold is trading in a well-defined ascending channel (highlighted in orange on the chart) 📉📈. The price has respected both the upper and lower boundaries, confirming a solid uptrend. It’s currently testing the upper channel resistance at $3070.612 🚧
Key Resistance Levels:
Immediate resistance at $3070.612, a high-volume area (VPOC) where sellers may step in 🛑
A break above could target $3081.053, then $3097.774, with $3100 as the next psychological level 🎯
Key Support Levels:
Nearest support at $3031.774, aligning with the channel’s lower boundary and a prior VPOC 🛡️.
A deeper pullback might test $3024.254 or $3017.197, where buyers previously defended (marked by yellow circles) 📍
Additional Levels to Watch:
Resistance: $3054 - $3061 - $3070 🚧
Support: $3044 - $3038 - $3031 - $3026 🛡️
🌍 Fundamental Insights
US Dollar Dynamics:
Gold often moves inversely to the USD 💱. Today, 20 March 2025, markets are focused on the US Jobless Claims data (due at 13:30 GMT) and Fed speeches, which could sway the Dollar 📅. A weaker-than-expected US report may weaken the USD, boosting Gold towards $3100 🚀.
Safe-Haven Demand:
Geopolitical tensions (e.g., Middle East unrest, US-China trade talks) continue to support Gold as a safe-haven asset 🛡️. This underpins the bullish outlook for now.
Interest Rate Environment:
The Fed’s dovish tone in early 2025 has lowered the opportunity cost of holding Gold, supporting its upward trajectory 📉. Meanwhile, keep an eye on UK inflation data this week, as it could impact GBP and indirectly influence Gold.
📝 Trading Plan
Buy Opportunity (Buy Zone: $3032 - $3030) 🟢
Stop Loss (SL): $3026 ⛔
Take Profit (TP): $3038 - $3042 - $3046 - $3050 - $3060 💵
Sell Opportunity (Sell Zone: $3069 - $3071) 🔴
Stop Loss (SL): $3075 ⛔
Take Profit (TP): $3065 - $3060 - $3055 - $3050 💵
⚠️ Market Alert
Gold has been hitting all-time highs following the FOMC meeting earlier today 🌪️. With US data due during the London session, expect volatility—stick to your TP/SL to safeguard your account! 🛡️💡

Bajaj Finance - Multi-year breakout NSE:BAJFINANCE - Multi-year breakout suggests strong bullish momentum
🔹 Current Price: ₹8,633.20
🔹 Breakout Above Resistance 🚀
🔹 Pattern: Ascending Triangle 📐
🔹 Target Price: ₹12,439.20 (+53.31%)
✅ Volume confirmation supports further upside
⚠️ Support level at ₹8,000 should hold for bullish bias
📢 Traders & investors should watch for sustained breakout strength!
#BajajFinance

Gold- I'm looking to sell for 500+ pips targetAs I explained before, when I trade TRADENATION:XAUUSD , I aim for targets of 400-500 pips , sometimes even more. That’s why I always try to determine where "the BIG move" is. In Gold’s current situation, I believe this move is down, not up (though, of course, I don’t have a crystal ball).
Let me explain...
Since the beginning of March, Gold has surged by more than 2000 pips. While we need to adjust our pip calculations given Gold’s current price levels , this is still an enormous rise. More importantly, out of these 2000 pips, 1700 were gained just since last Wednesday. This makes a correction highly likely, especially considering that if we look at the chart, we see almost no pullbacks in the past week—only a consolidation in a rectangle.
From a technical standpoint, the trend is undoubtedly up. However, even if Gold drops to 2990, the overall uptrend would still remain intact. Additionally, looking at the chart, we can spot a rising wedge—typically a reversal pattern.
My Take:
Currently, I’m out of the market, but I expect a strong correction of 500+ pips. I’m looking to sell if there’s an upward spike followed by signs of exhaustion.
Conclusion:
In my opinion, "the big move" is down, not up. I expect Gold to drop below 3000 and at least test the 2990 zone.
Disclosure: I am part of Trade Nation's Influencer program and receive a monthly fee for using their TradingView charts in my analyses and educational articles.

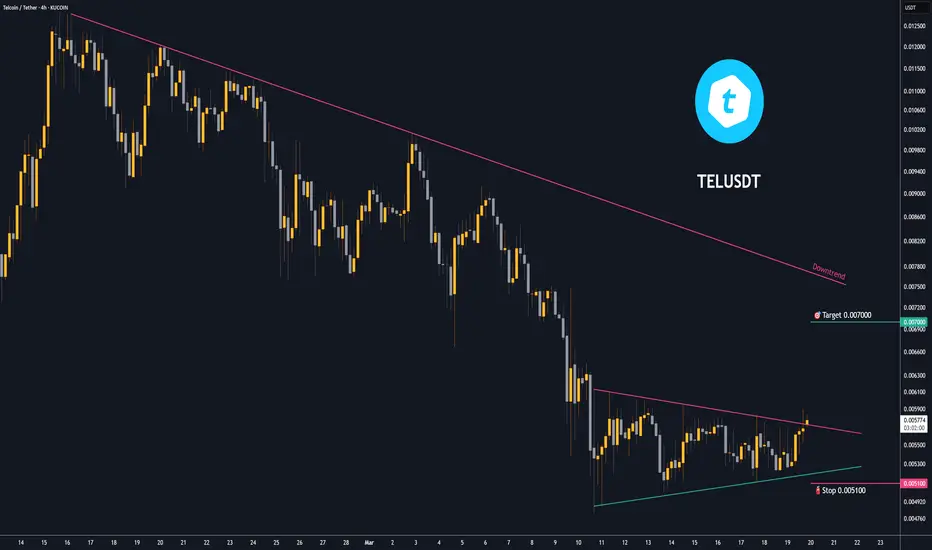
Trading opportunity for TELUSDTBased on technical factors there is a Buy position in :
📊 TELUSDT
🔵 Buy Now
🪫Stop loss 0.005100
🔋Target 0.007000
📏 R/R 2
💸RISK : 1%
We hope it is profitable for you ❤️
Please support our activity with your likes👍 and comments📝
Trading opportunity for MOCAUSDT Moca NetworkBased on technical factors there is a Buy position in :
📊 MOCAUSDT
🔵 Buy Now
🪫Stop loss 0.07000
🔋Target 0.15000
📏 R/R 2
💸RISK : 1%
We hope it is profitable for you ❤️
Please support our activity with your likes👍 and comments📝
