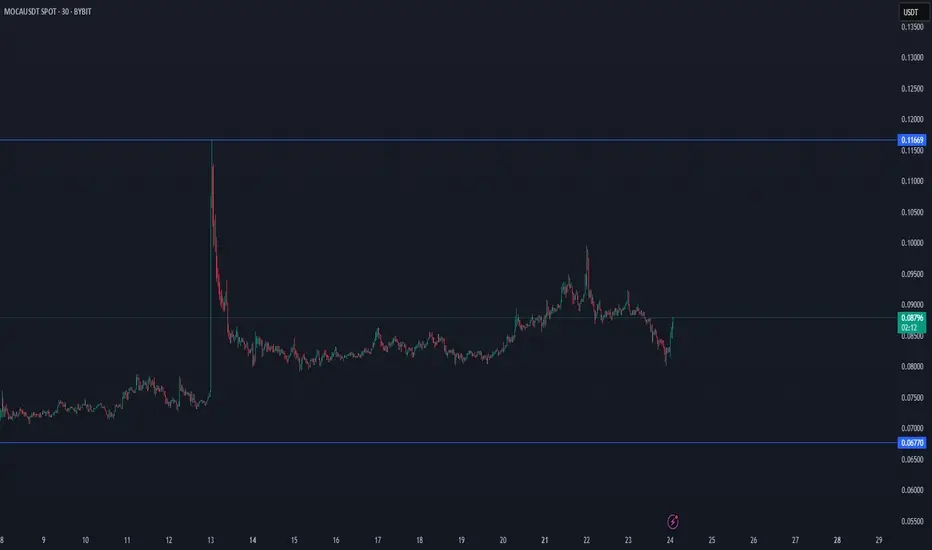
MOCA/USDT NEW VOLUME RANGEMOCA/usdt starting with new volume range, which can get confirmed in the next hours.
our follow will here for this coin to see new confirmations.
Tradingsignals
GOLD - One n Single Support, holding or not??#GOLD.. market just reached at his current ultimate supporting area and that is 3385
Keep close it and if market hold it in that case we can see again bounce otherwise not..
Note: we will go for cut n reverse below 3385 on confirmation.
Good luck
Trade wisely
Gold Price Analysis July 23📈 Gold Trend Analysis – Strong Uptrend but Signs of Slowdown
Gold continued to set a new peak for the week when closing the day above 3430 – confirming that the uptrend is still dominant. However, buying power is starting to slow down as the market formed a fairly wide range, around 50 prices in today's session.
Profit-taking pressure at high prices can create a short-term correction, opening up two-way trading opportunities for flexible investors.
🔑 Important technical levels (Key Levels):
🔻 Resistance zone & Sell zone:
3445: Price rejection zone – can consider selling if price fails to break through.
3463: Strong Sell zone – expect increased supply here.
🎯 Sell target:
3405: Nearest support, target for short-term sell orders.
🟢 Buy Setup:
3402: Breakout zone in US session – if price breaks strongly through this support with good volume, consider buying on the next uptrend.

BITCOIN UPDATE Bitcoin seems to be preparing to fix its lows so it’s time to target a trade to the up side because, it had dropped to a fair amount of lows
XAUUSD M30 BEST BUYING ZONE 📈 Gold is in a strong buying trend!
As always, I follow the trend — and right now, the trend is bullish. Here's what to look for:
✅ Strong Buying Zone
Look to buy if you see a solid bullish candlestick confirmation in this area.
📍 Alternative Entry Point
If price sweeps below 3416, we’ll look for a potential buy opportunity there — but again, only with candlestick confirmation.
🔓 Open Your Layers
Be prepared for both setups. Follow the market reaction and adapt accordingly.
⚠️ Risk Management is Key
No matter how strong the trend looks, always stick to your risk management rules. Discipline protects profits! 💼
🚀 Let’s ride the trend and stay smart!

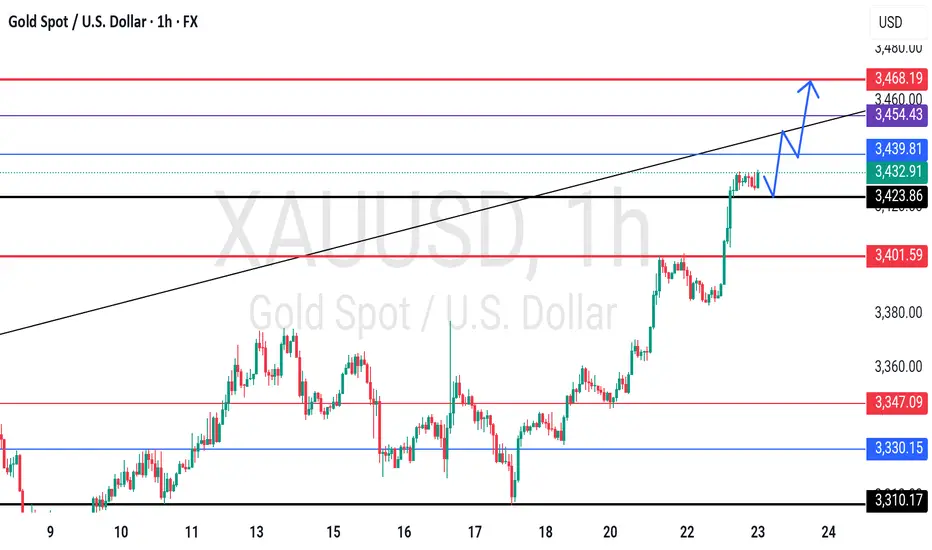
GOLD - single supporting area, further bounce??#GOLD - market perfectly moveed as per our video analysis and above our cut n reverse area as well.
Now market have single supporting area, tha tia around 3423-24
Keep close it and if market hold it then upside further bounce expected.
Good luck
Trade wisely
USDJPY is continuing its uptrend, let's BUY✏️ OANDA:USDJPY broke the price channel and continued its uptrend at 151,000. The previous h4 candle wick had a liquidity sweep to 147,000, showing that the buyers are dominating the market. The USDJPY trading strategy will mainly BUY to the old peak around 151,000. When the price breaks 147,000, a corrective downtrend will begin to form.
📉 Key Levels
Support: 148.200 - 147.200
Resistance: 150.100 - 151.100
Buy trigger: Breakout above 148,800
BUY 147,200 (buyer liquidity zone)
Target: 145,000
Leave your comments on the idea. I am happy to read your views.

Price channel break. Will the downtrend take place?✏️USDCAD broke the price channel and started forming a bearish wave. The resistance zone of 1.370 played an important role in starting the bearish wave. 1.365 is the immediate support zone that the pair faces. If it wants to extend the decline, it needs to close the h1 candle below this price zone. The convergence between the trendline and the resistance of the Asian session will be a reliable support point for a downtrend to take place.
📉 Key Levels
Support: 1.365-1.356
Resistance: 1.370
SELL Trigger: Rejects bellow 1.370
SELL DCA Trigger: Break support 1.365
Target 1.356
BUY Trigger: Break and trading above resistance 1.370
Leave your comments on the idea. I am happy to read your views.

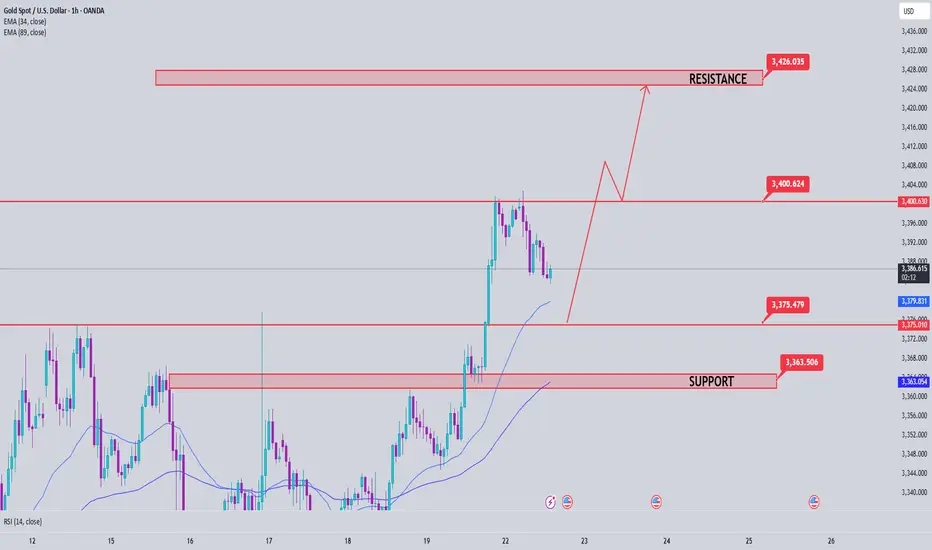
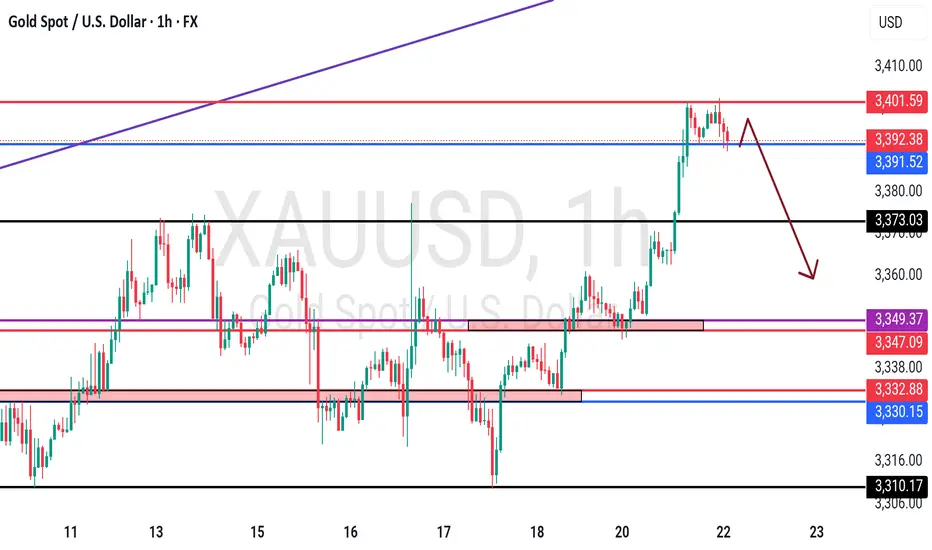
Gold Price Analysis July 22Gold continues to maintain its upward momentum as expected, and yesterday's session reached the target of 3400. This is a signal that the bullish wave structure is still holding. In today's European trading session, the price is likely to make a technical correction to important support zones before continuing the main trend in the US session.
The current trading strategy still prioritizes following the uptrend, focusing on observing price reactions at support zones to find safe entry points. Waiting for buyers to confirm participation is a key factor to avoid FOMO at the wrong time.
🔑 Key Levels
Support: 3375 – 3363
Resistance: 3400 – 3427
✅ Trading Strategy
Buy Trigger #1: Price reacts positively and rejects the support zone at 3375
Buy Trigger #2: Price rebounds strongly from the deeper support zone at 3363
Buy DCA (Moving Average): When price breaks and holds above 3400
🎯 Next Target: 3427
📌 Note: It is necessary to closely monitor price reaction at support zones to determine whether buying power is strong enough. If there is no clear confirmation signal, it is better to stay on the sidelines and observe instead of FOMOing to place orders.
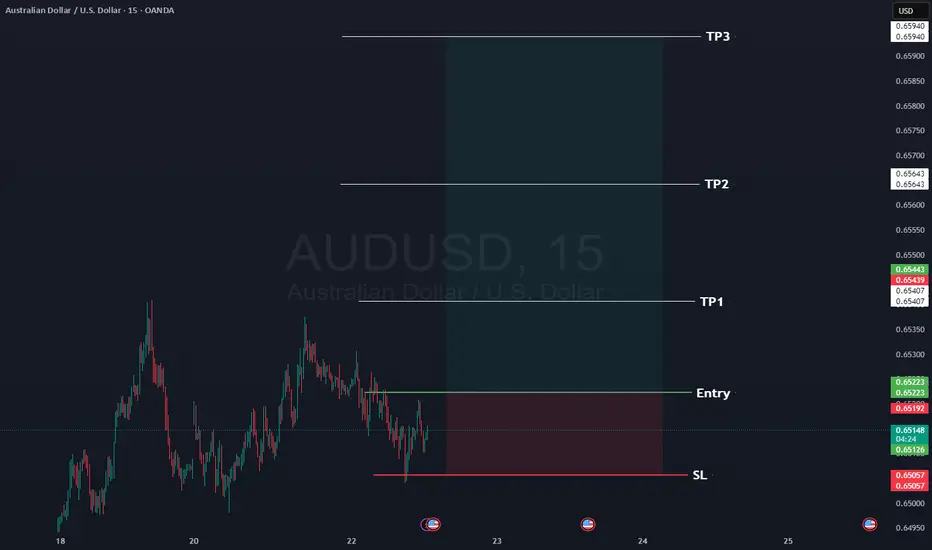
AUDUSD Here is our signal for AUDUSD
Occasionally we give a free signal, so here's AUDUSD long.
Rules:
1- Wait for the 15 minute to close with momentum above the entry, ideally we want a re-test of the entry.
2- at TP1 move your SL to entry.
3- If you want to close at TP2 then do so.
📊Entry: 0.65223
⚠️SL: 0.65057
✔️TP1: 0.65407
✔️TP2: 0.65643
✔️TP3: 0.65940
Happy Trading,
Sarah
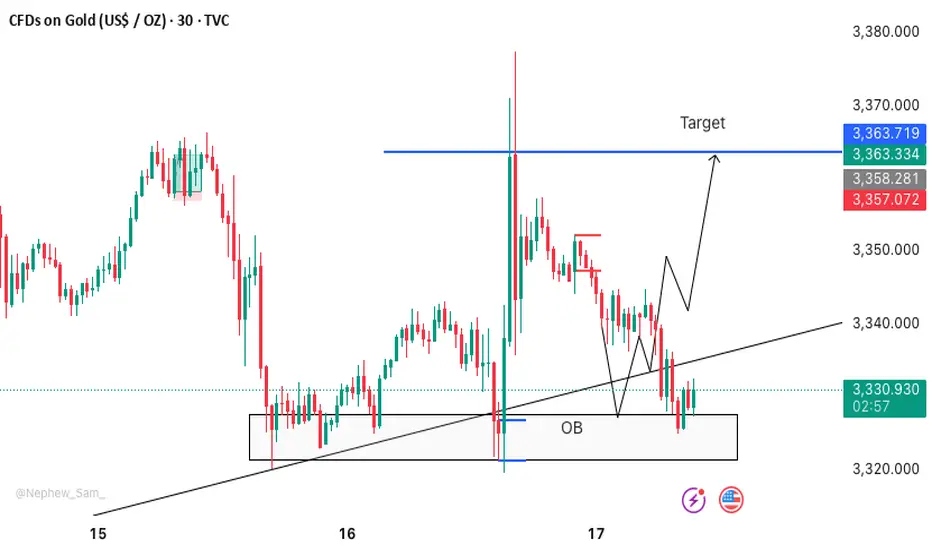
GOLD - at cit n reverse area? What's next??#GOLD... market perfectly moved as per our video analysis and now market just reached at his current ultimate swing area
That is around 3402
So if market holds 3402 in that case selling expected otherwise not.
NOTE: we will go for cut n reverse above 3402 on confirmation.
Good luck
Trade wisely
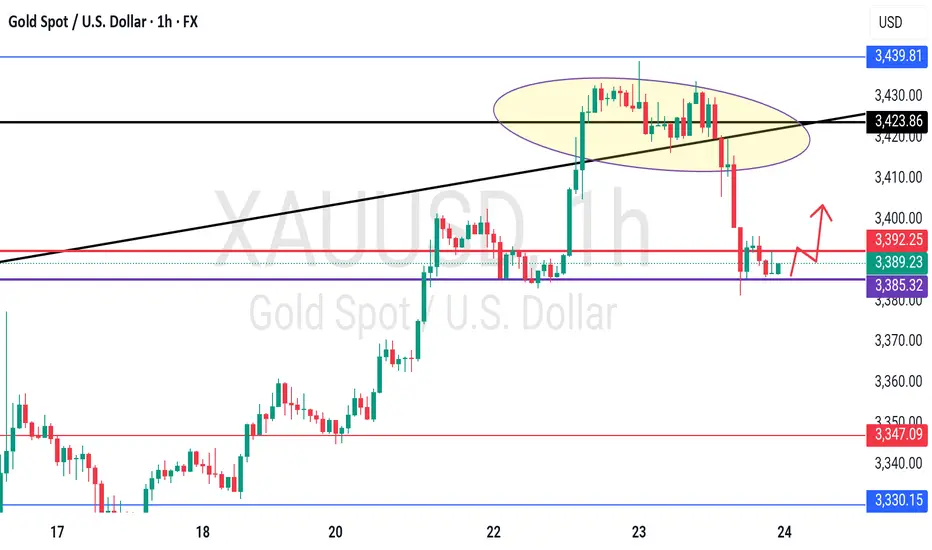
XAUUSD M30 BEST SETUP FOR TODAY📉 Gold Analysis:
🔸 Gold is forming an M-pattern – a potential bearish setup.
➡️ We can look for a sell opportunity if we get a strong candle closing below the M-pattern structure.
📈 Buying Setup (Support Zone):
🔹 There's a strong buy zone at the bottom, marked by:
✅ Fair Value Gap (FVG)
✅ Order Block (OB) confirmation
🕵️♂️ Wait for clear price action confirmation before entering any trades.

GBPAUD's wide trading range remains intact✏️GBPAUD is trading in a wide range. After the increase on Friday, the pair is retesting the support zone breaking past resistance. And the current reaction point also coincides with the 20 SMA. There is not much momentum for the pair to break out of the wide trading range, so buying the pair to the upper range of 2.097 is a reasonable choice at the moment.
📉 Key Levels
Support: 2.058
Resistance: 2.083-2.096
BUY Trigger: Confirmed bounce from 2.059 (EMA support)
Target 2.09600
BUY DCA Trigger: Break 2.083
Leave your comments on the idea. I am happy to read your views.

ETHUSD heading towards the top of the D1 frame✏️ CRYPTO:ETHUSD is in a strong uptrend towards the resistance zone of the 3800 daily frame. There are not many conditions for the sellers to jump in and reverse the current trend. Wait for the price reaction at the resistance of the D1 frame to consider the SELL strategy. Because currently if BUY is too Fomo.
📉 Key Levels
Sell trigger: Rejection from 3800
Target 3400, potentially 3,380
Leave your comments on the idea. I am happy to read your views.

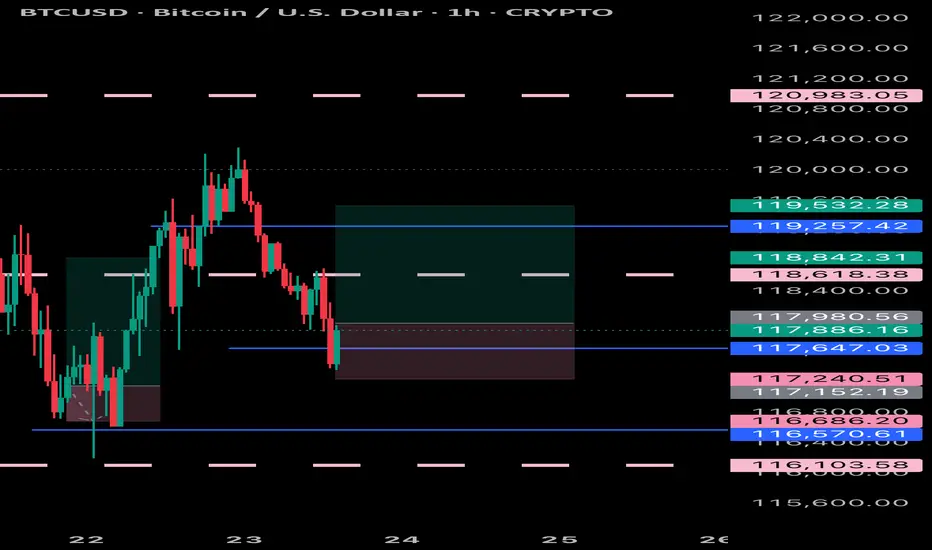
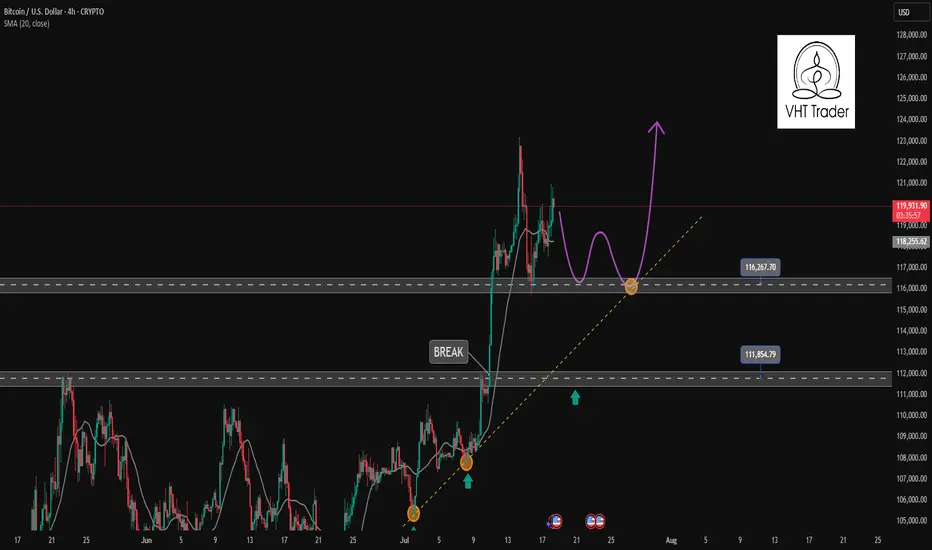
Find a recovery point to continue buying BTC✏️ CRYPTO:BTCUSD is trading near the all-time high. The trading strategy is to wait for some investors to take profit so that the price can return to the nearest support zones and continue to buy to the new all-time high zones.
📉 Key Levels
BUY Trigger: confirms the recovery from the support trend line 116000
BUY zone 112000 (Strong support zone)
Target 129000
Leave your comments on the idea. I am happy to read your views.
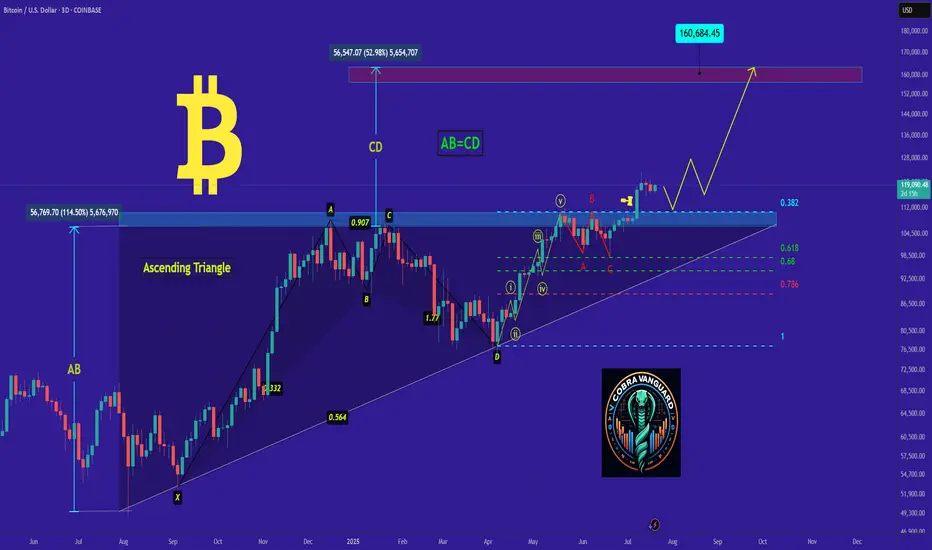
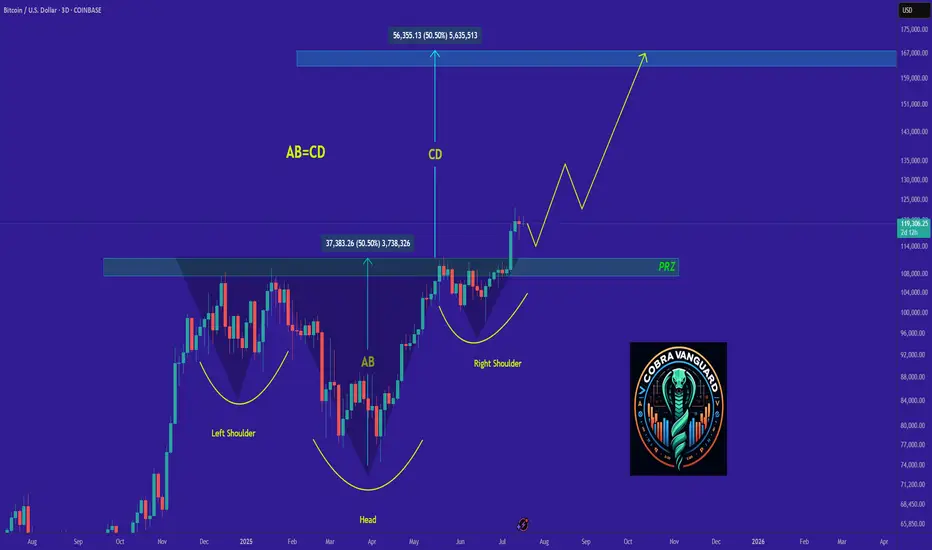
𝐛𝐢𝐭𝐜𝐨𝐢𝐧's Situation, A Comprehensive Analysis !!!As I said, Bitcoin broke the triangle, and now with a slight price correction, it could surge to $160,000, and you still think I'm joking!!
Previous analysis
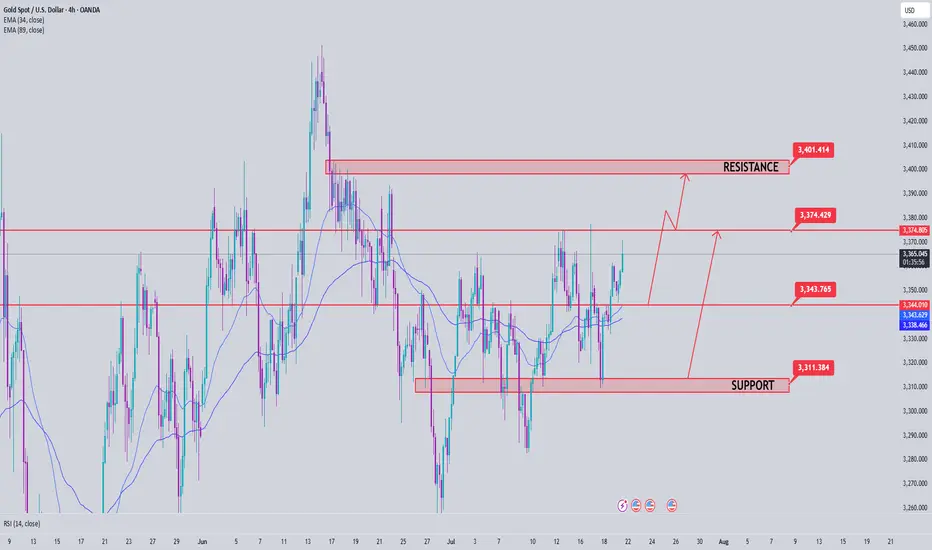
Gold Price Analysis July 21After being reinforced by CPI data last week, gold prices have regained their bullish momentum and are currently trading in a wide range. The technical structure still shows a dominant uptrend, with the trendline continuing to act as reliable support, targeting the important resistance zone of 3400 next week.
📌 Preferred trading strategy:
Watch the price reaction around the support zone of 3343. If there is a rejection signal of this zone accompanied by buying pressure, that will be the ideal entry point.
If the price continues to correct deeper, the strong support zone of 3322 will be a reasonable DCA point.
It is not recommended to SELL if the price breaks the confluence zone of 3373, as this is a signal confirming the strong bullish momentum continues.
📍 Important price zones:
Support: 3343 – 3322
Resistance: 3373 – 3400
🚀 Buy Trigger:
Price rejects 3343 zone with clear bullish signal
Strong bounce from 3322 zone
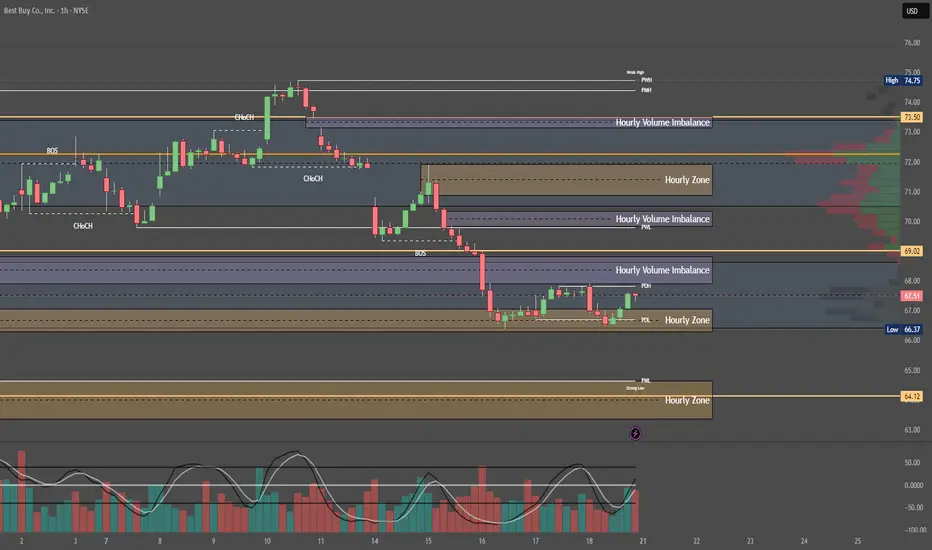
Quantum's BBY Outlook 7/20/25🚀 G.O.D. Flow (Gamma, Orderflow, Dealer Positioning)
1. 🧩 Summary Overview
Ticker: BBY
Current Price: $67.50
Flow Setup Date: Current Session
Trade Type: Intraday / 0–2 Day Swing
2. 🔬 Flow Breakdown
🔵 GEX (Gamma Exposure):
Highest -GEX at 70 → potential volatility pocket and resistance zone.
Despite matching +GEX at 70, net gamma is negative — bearish skew.
Additional +GEX at 72 & 73, but overwhelmed by -GEX at 68 and 67.
🔺 Overall gamma environment favors chop and downside unless 70 is reclaimed.
🟡 DEX (Delta Exposure):
Mirrors GEX layout.
Dealer short delta bias = likely selling into strength.
Reclaim of 70+ may signal a squeeze, but not favored without sweep confirmation.
🟣 Vanna:
Strong -Vanna clusters from 70 to 77: if IV rises, dealers sell into strength.
⚠️ This limits bullish continuation unless IV drops drastically.
Minor +Vanna at 60 = support base on deep dip (liquidity pocket if flushed hard).
🔴 Charm:
Extreme -Charm peak at 70 = time decay creates headwind at this level.
Additional -Charm pressure at 72, 73, and 77.
Minor +Charm at 60 suggests dealer support only comes much lower.
⚪ Volatility:
Neutral past week.
If vol spikes, expect dealer selling pressure to intensify under this skew.
🟢 Open Interest:
Heavy put OI at 70 = possible support IF price breaks hard.
Calls OI lighter at 72 and 73, meaning less resistance absorption if price does push up.
3. 📊 Chart Structure Setup
Price: $67.50, sitting below key gamma and charm cluster at 70.
Chart bias: Bearish unless strong reclaim of 70.
Key flush zones: 68 → 67 → 65
Confirmed supply above 70 due to clustered charm/vanna.
4. 🎯 Trade Plan
🟥 Bias: Bearish unless 70 is reclaimed and held with size.
🛠 Entry Triggers:
Rejection of 69.50–70 zone → PUT
Break and retest of 67 → PUT
📦 Contract Picks (0–5 DTE):
67p, 65p, 60p
🛑 Risk Stop:
Breakout and hold above 70.50 with size = exit or flip long bias intraday
🎯 Targets:
Target 1: 66.00 (Gamma flush)
Target 2: 63.00 (next +Charm liquidity zone)
EURUSD Analysis week 30🌐Fundamental Analysis
The USD rose after June retail sales beat expectations and initial jobless claims fell to 221,000. However, the USD's gains were limited as US stocks rebounded late in the session.
On Friday morning, US stock index futures rose 0.2%, indicating that risk sentiment remains dominant. If this trend continues, EUR/USD could hold support.
The next focus is on the Consumer Sentiment and Inflation Expectations Index data from the University of Michigan. If the data is positive, the USD could regain support and put pressure on EUR/USD.
🕯Technical Analysis
EURUSD is in a corrective downtrend towards the 1.145 support. If this support zone is broken, the EURUSD trend will turn to a Downtrend. Currently, the main trading strategy will be to look for SELL points. After price reacted at EMA and trendline and headed to temporary bottom 1.156 and hit important support soon.
📈📉Trading Signals
SELL EURUSD 1.17500-1.17700 Stoploss 1.18000
BUY EURUSD 1.14500-1.14300 Stoploss 1.14000

ETH SCALP SHORT RR 3:1 Ethereum just hit weekly level with two 15min lower high and lower low. Rules are telling us to not short against trend, but there can be hedge for long positions.
I don't ask to trade more then 0.5 % capital per trade.

Bitcoin is bullish now & many Traders don't see it !!!I might be wrong and this might never happen, but it might come true From a technical perspective!!!
Remmember
Stay Awesome , CobraVanguard.
XAUUSD M30 BUY SETUP FOR TODAYScenario:
Best buy zone for Gold as of now: 3327–3323 💰
Strong Order Block zone + Double Bottom pattern 📉📈
Let’s ride the 🚀 from here — follow proper risk management! 🛡️📊