Good opportunity to wait for recovery and buy GoldOANDA:XAUUSD Confirmation of breaking Key level 3330 on Friday has formed an Uptrend in Gold. Reaction at GAP 3368 is obvious in an uptrend. Gold trend is favoring buying to 3388 and 3400 next week.
Support: 3345-3331
Resistance: 3387-3400
BUY Trigger: Retest and Reject support 3345
BUY Trigger: 3331 ( Strong support zone)
Target: 3400
SELL Trigger: rejection 3387 with bearish confirmation
Leave your comments on the idea. I am happy to read your views.
Tradingsignals

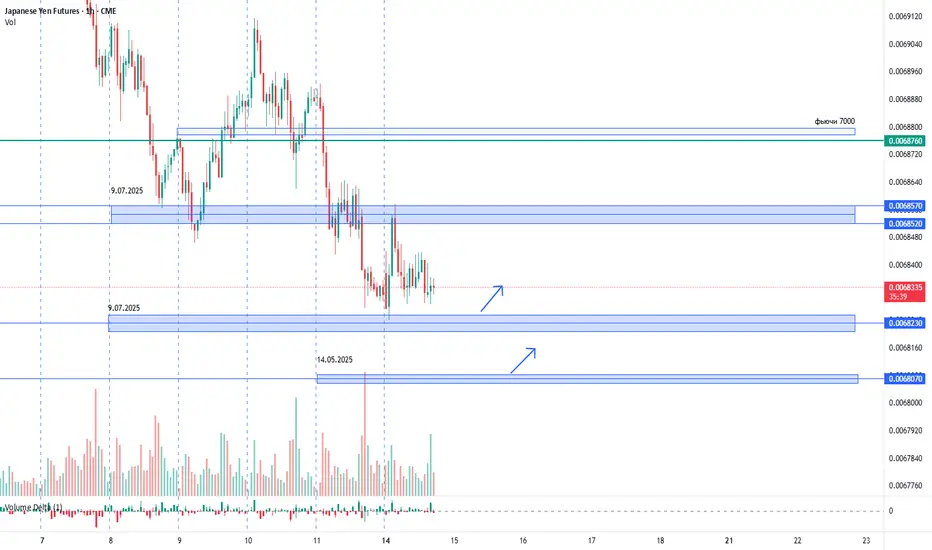
USDJPY. 14.07.2025. The plan for the next few days.The nearest interesting resistance zones have already been worked out at night and have given a good reaction. Let's mark the others where we can expect a reaction. It's not certain that there will be a major reversal, but I believe we will see a correction that can be monetized. We are waiting for a reaction and looking for an entry point.
The post will be adjusted based on changes.
Don't forget to click on the Rocket! =)
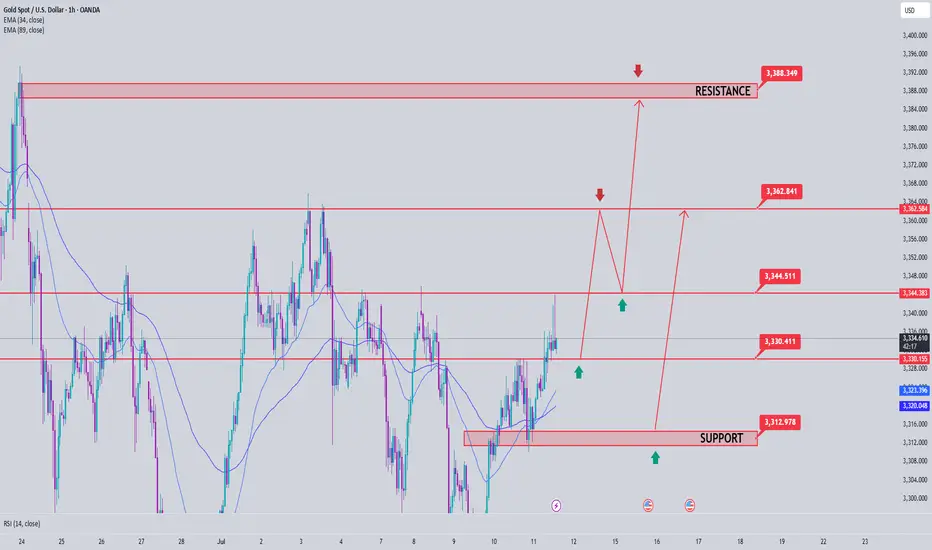
Gold breaks trendline towards 3390, Uptrend resumes✏️ OANDA:XAUUSD The price increase will continue today and will be even stronger. After breaking the trendline, gold has strong support. SELL strategies are only considered to find short-term reaction points waiting for the next trends.
Gold has confirmed the uptrend is back, heading to 3390 today.
📉 Key Levels
Support 3330-3314
Resistance 3345-3362-3388
Sell trigger: rejection from 3345 with bearish confirmation
Sell zone: 3362–3387 (Strong resistance)
BUY trigger: 3330-3314 support with bounce confirmation
Leave your comments on the idea. I am happy to read your views.

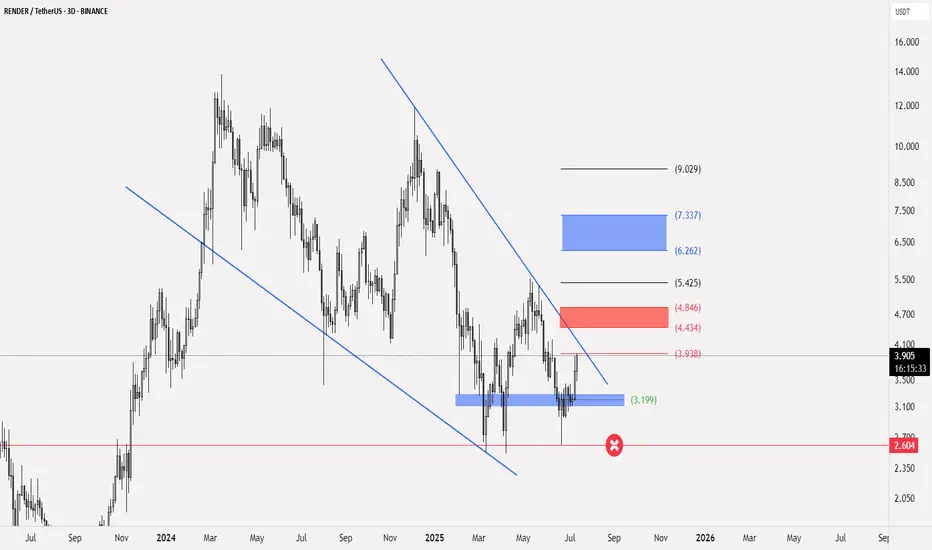
RENDER trading planCRYPTOCAP:RENDER
⭕️ Entry is possible from the current price of 3.9 and strengthened at 3.19
🚨 The stop loss for this model is at 2.604
📄 The actual upward signal is breaking above 3.938 on a three-day frame
💵 Targets: range 4.434 - 4.846 and range 6.262 - 7.337
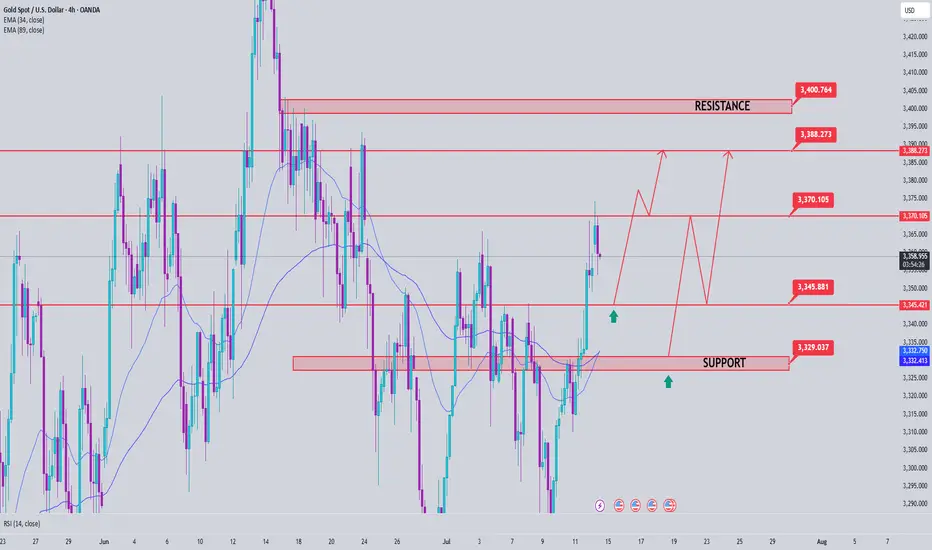
Gold Price Analysis July 14Gold confirmed a break above the key 3330 level on Friday, opening a clear uptrend. The reaction at the 3368 GAP zone further strengthens the current bullish momentum. With the current market structure, the bias is leaning towards buying on corrections around support zones.
🔍 Technical levels to watch:
Support: 3345 – 3331 (potential buying zone)
Resistance: 3387 – 3400 (bullish target)
📌 Trading strategy:
BUY Trigger 1: Price tests and rejects the 3345 support zone
BUY Trigger 2: Buy around 3331 – strong support zone
🎯 Target: 3400
The current trend favors a buying strategy on reasonable price correction conditions. It is necessary to monitor price action around support zones to confirm effective entry points.
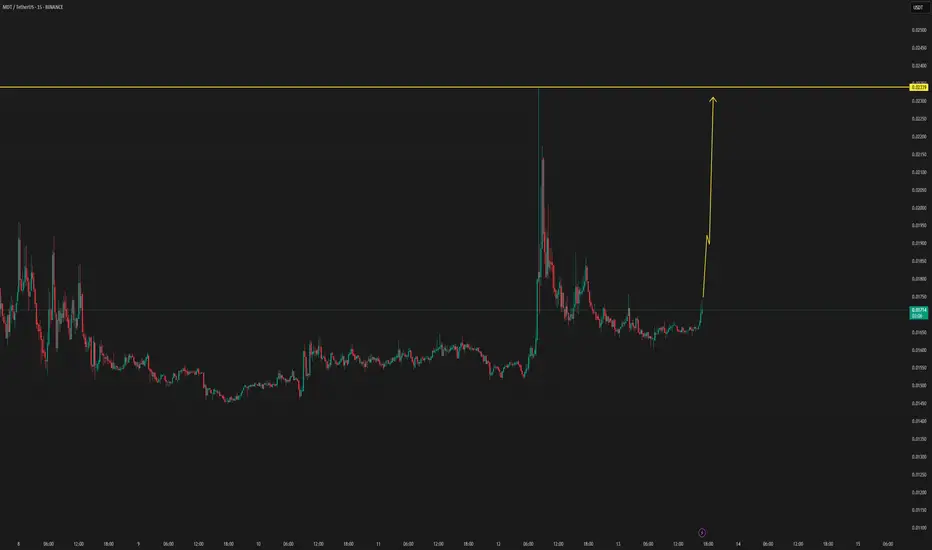
MDT NEW INCREASE VOLUMEMDT/USDT has new volume upcoming, which can be confirmed in the coming time frames. by new confirmations, the update will be followed below.
NEO's Situation, A Comprehensive Analysis !!!The price on the 3-D timeframe is within an ascending triangle, which can be promising. If the price breaks this pattern with bullish candles, it could easily rise by the distance of AB=CD .
Best regards CobraVanguard.💚

BTC's increasing fomo force will push the price up furtherCRYPTO:BTCUSD just broke the important resistance zone and trendline around 110000. This price increase to create a new ATH will create a large amount of FOMO in the market pushing BTCUSD to increase more than half. 116,000 FIbonacci extension points are considered the immediate Target for the uptrend.
Waiting for retests to the support zone for the trend-following BUY strategy.
Support: 110000-107500
Resistance: 116000
Buy zone: 110000 ( support + trendline)
Buy Trigger: break above 112000
Leave your comments on the idea. I am happy to read your views.

BF UTILITIES LTD 'S KEY LEVEL || BREAKDOWN OR BREAKOUT ??These are two charts of BF Utilities – one on the daily timeframe and the other on the weekly timeframe.
In the first chart : BF Utilities is sustaining near its Law of Polarity (LOP), which is acting as a resistance zone around the 880–890 range.
In the second chart : BF Utilities is forming a Rising Wedge pattern, with the resistance also lying in the 870–880 zone.
If this level is sustain ,then we may see lower price in BF Utilities.If this level is broken, the stock may move towards the upper boundary of the channel.
Thank you !!

DOGE's Situation, A Comprehensive Analysis (1h) !!!The price on the 1-hour timeframe is within an ascending triangle, which can be promising. If the price breaks this pattern with bullish candles, it could easily rise by the distance of AB=CD .
Best regards CobraVanguard.💚

Update on: "XAU USD a little & nice BUY set up" 11-07-2025Quick update : I did "collect" a bit earlier (Unlucky I haven't got possibility to monitor trade all the way down today ), TP @ 3365.405.... Like I said earlier, a little & nice trade!
Also, did hit TP around - 3367.188 as promised ! AAA+ trade !
All analysis is based on technical analysis only...
Short & clear without any "BS"...
I do not believe in fundamental analysis (& if you are desperate for it, then... gold is never going to get cheaper in a very long term & it is a good investment for the next 50-100+ years, if you are happy with "preserving" your wealth, but if you are looking get paid this or next week, then...trading is a way. )
All of you have a lovely weekend ( with a nice profit in the pocket ! )

EURUSD. The plan for the next few days.The nearest resistance zones are where it's interesting to look for purchases. We are waiting for a reaction and looking for an entry point.
The post will be adjusted if there are any changes.
Don't forget to click on the Rocket! =)

Gold. The plan for the next few days.The nearest resistance zones are where it's interesting to look for purchases. We are waiting for a reaction and looking for an entry point.
The post will be adjusted if there are any changes.
Don't forget to click on the Rocket! =)

GBPUSD. The plan for the next few days.The nearest resistance zones are where it's interesting to look for purchases. We are waiting for a reaction and looking for an entry point.
The post will be adjusted if there are any changes.
Don't forget to click on the Rocket! =)

SILVER - at cut n reverse area? what's next??#SILVER... market just reached at his resistance of the week and month.
that is around 38.20-25
keep close it and if market hold it then drop expected.
otherwise not
NOTE: we will go for cut n reverse above 38.20-25 on confirmation.
GOOD LUCK
TRADE WISELY

GOLD .. Alternative scenarios, long now??#GOLD.. market perfectly brokenhis today resistance that was at 3296-97
So now if market rholds above and sustains then bounce expected towards 3340 again..
Good luck
Trade wisely
GBPUSD - at ultimate region? Pound long??#GBPUSD... market reached at his ultimate region that is around 1.3450 to 1.3480
Keep close and don't hold shorts until holds.
Good luck
Trade wisely

GOLD - at cut n reverse Region? what's next??#GOLD .. perfect ride as per our last idea regarding gold and now market just above his ultimate area/region.
that is around 3320-23
keep close and if market hold it then further bounce expected otherwise not..
NOTE: we will cut n reverse our position below 3320 on confirmation.
good luck
trade wisely
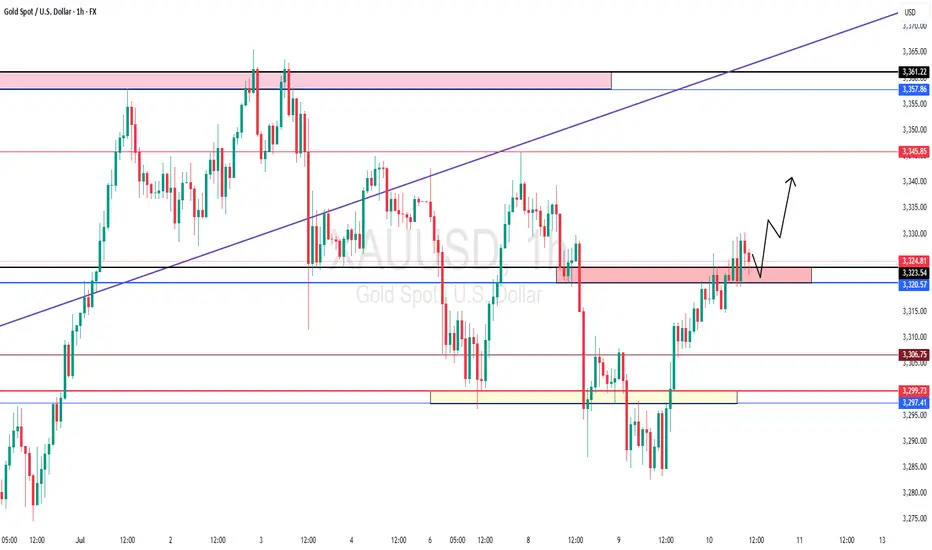
Gold Price Analysis July 11Gold price today continues to maintain a strong upward momentum after breaking the previous support trendline (gold wire). Currently, SELL orders should only be considered as short-term response transactions, with priority given to monitoring to join the main trend.
✅ Trend: Up has been confirmed, the nearest target is towards the 3390 area today.
🔑 Key Levels:
Support: 3330 – 3314
Resistance: 3345 – 3362 – 3388
🎯 Trading strategy:
SELL activation: Watch the 3345 area, only SELL when there is a price rejection signal with a confirmation of a decrease.
Potential SELL area: 3362 – 3387 (strong resistance).
BUY Activation: Look for buying opportunities at support 3330 – 3314 if there is a clear bullish reversal signal.
BTCUSD Heading Yesterday's Resistance Zone, Price Will React After a recovery to 107.500 BTCUSD is recovering to the upside again towards the resistance of 1.09500. This is the convergence zone between the trendline and yesterday's high. BTCUSD price may correct lower from this zone. Then find some new bullish momentum at strong support zones towards an all-time high.
Support 107.500 - 105.300
SELL Trigger: Break bellow 107.500
Resistance: 109.500- 110.500
Wish you successful trading, leave your comments about BTC.

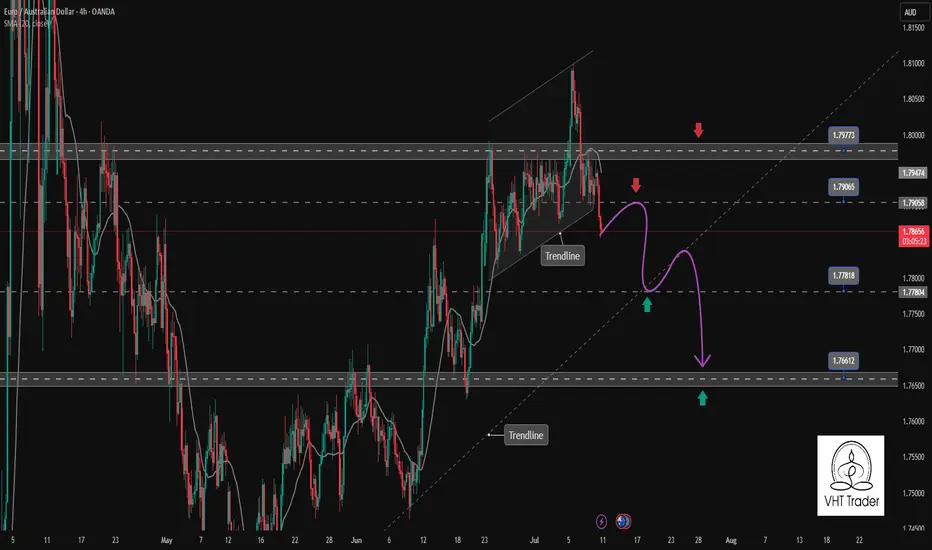
EURAUD confirms the continuation of the bearish correction trendEURAUD has just broken the rising channel to start a downtrend. The confirmation is there with the h4 candle closing completely below the support zone of the Price Channel. This corrective downtrend can now extend to the support of 1.766. The support zone is a Break point at the moment 1.778 is a positive DCA point with a SELL Entry above.
Support: 1.778-1.766
Resistance: 1.790-1.797
Sell now: Resistance zone 1.79000
Target: 1.778 Support zone, followed by 1.766 lower zone
Sell Trigger: Break below 1.778
BUY Trigger: rejection 1.778 Support zone
Leave your comments on the idea. I am happy to read your views.
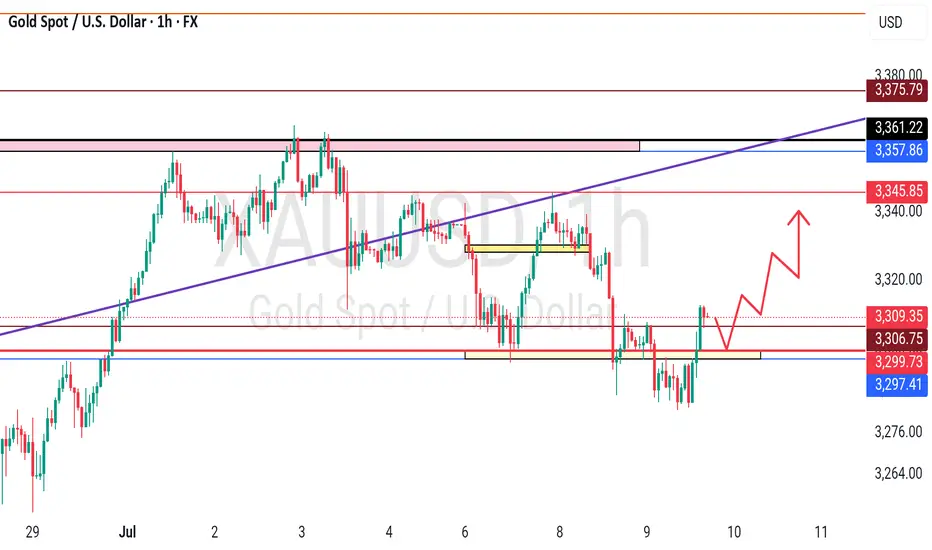
Gold Price Analysis July 10🔹 XAUUSD Analysis – D1
Yesterday's D1 candle showed a strong recovery, closing above 3313, thereby significantly weakening the previous downtrend structure. Currently, the price is reacting very strongly at the trendline around 3284. Buying pressure is clearly appearing, pushing gold back to trading in a wide range.
In the short term, the 3328 area will play an important resistance role. If the price cannot break this area, the possibility of a correction down to the Gap price area this morning is quite high. The peak-bottom trading method is still giving suitable signals in the current market context.
🔹 Important zones:
Support: 3312 – 3295 – 3279
Resistance: 3328 – 3339 – 3349 – 3363
💡 Strategy:
Confirm the trading signal when the price clearly rejects the resistance zones to ensure the highest winning rate.

Do you think I'm joking ???The price is currently forming the second corrective wave, and a slight price drop to reach higher levels is normal.
Best regards CobraVanguard.💚
