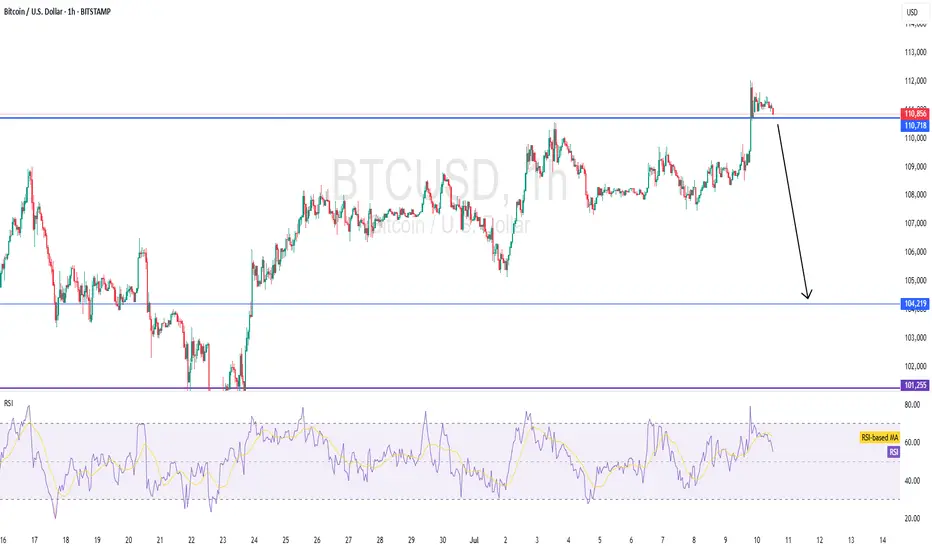
BTCUSDT - single supporting area, short below .#BTCUSDT.... now we have single and immediate supporting area, that is around 110700-800
keep close and only it can stay above for further buying scenarios otherwise not.
so stay sharp and only short below that.
good luck
trade wisely
Tradingsignals
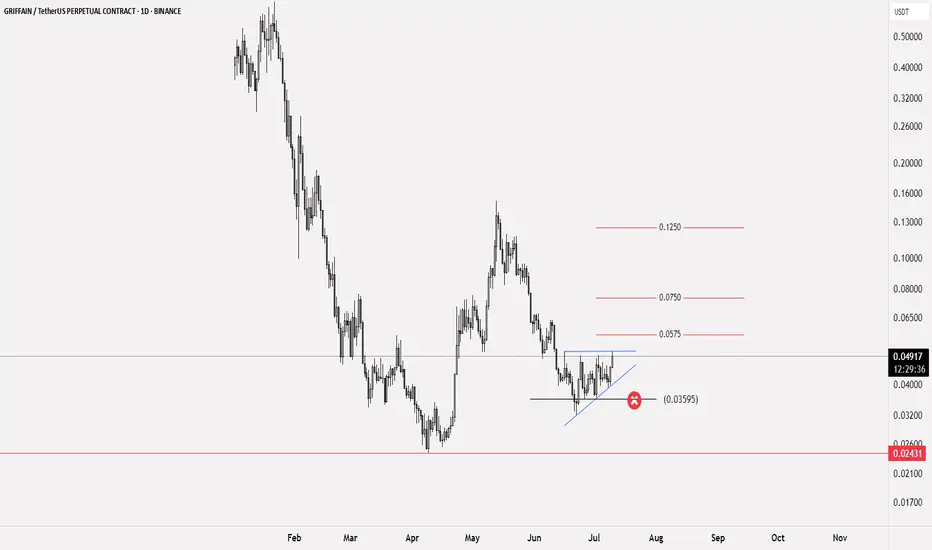
GRIFFAIN trading plan🟢 Available trading deal
📝 Currency $GRIFFAIN
✅ Entry points for the currency: at the current price of 0.04955 and the reinforcement will be at 0.04335
🔴 Stop loss is below 0.03595
💹 Potential targets: First target 0.0575 and if the currency enters a bullish wave, the target will be towards 0.0750 reaching up to 0.1250
📊 The profit-to-loss ratio is 5:1
📝 This idea is based on Elliott Waves analysis, especially after the rebound from 0.02431, the currency's low, and gaining support at 0.03595, which is a signal that Wave 2 has been formed, especially if the price action remains above the mentioned level
❤️ Good luck to everyone - do not enter any currency before studying the risk ratio you will undertake
Gold continues downtrend today✏️#GOLD view
Yesterday's D1 candle confirmed the decline in gold prices when the selling pressure returned below the liquidity candle wick. The extension of the downtrend will continue today.
Yesterday's strong support zone 3297 has become today's resistance zone, this is the SELL point today when there is confirmation from the selling side in this zone.
3310 The confluence resistance zone between the trendline and the US Session Resistance is noted in today's SELL strategy. The previous SELL Target 3352 orders pay attention to the reaction at 3377.
📈Key Level
SUPPORT 3277-3250
RESISTANCE 3297-3310-3328
SELL Trigger: Price cannot break 3297
SELL DCA Trigger: Break 3276
Target: 3250
BUY Trigger:PriceTrading above 3276
Leave your comments on the idea. I am happy to read your views.
GOLD - at resistance ? Holds or not??#GOLD.. .market perfect dropped below our area that was around 3320
Now market bounced back and just near to his resistance area 3295 96
That will be market final area and only holdings of that region means another drop expected.
Note: we will plan for cut n reverse above that region.
Good luck
Trade wisely
NQ Analysis ICT Liquidity Search Break-Out TradePrice is expected to open not just 1, but inside 2 previous days.
We have 2 options:
1) ICT silver bullet up my bum trader strategy traders are waiting
for liquidity search breaking highs or lows then reversing.
2) Break-out trades waiting for price to break and close above or below
24hour range and trade in direction of break-out.

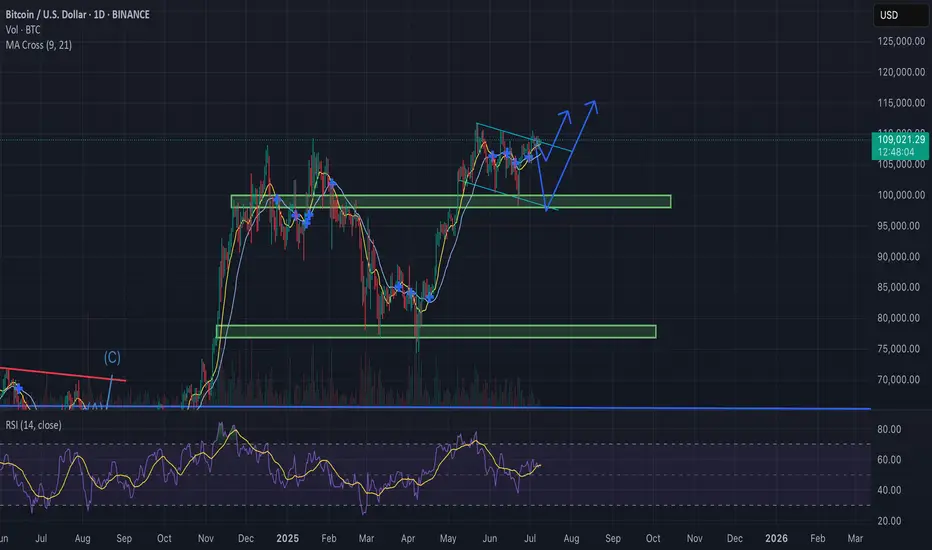
Bitcoin Update – Bullish Falling Wedge in Play?BTC/USD is currently trading near $108.8K, compressing within a falling wedge formation — historically a bullish continuation pattern, especially after a strong uptrend.
Why the Bias Remains Bullish:
Bullish MA Cross: Short-term MAs (9/21) are aligned for upside momentum.
Falling Wedge: Price compressing with lower highs and lows, coiling for a breakout.
RSI Strength: RSI (purple) remains elevated, supporting continued upside pressure.
Fundamental Catalysts:
Trump delays trade war announcements, reducing global uncertainty.
FOMC meeting in late July: Trump pushes for rate cuts, potentially bullish for risk assets like BTC.
If BTC breaks out above the wedge resistance with convincing volume:
Retest likely at ~$110K
Targets : $115K → $120K+
Gold To The Basement? Week Ahead with Bearish Bias by PhoenixFX🌟 Welcome to Phoenix FX’s Intraday Pulse! 🌟
Hello, Phoenix FX family! 👋 I’m thrilled you’ve joined us for today’s TradingView chart breakdown. Our focus? Intraday opportunities—spotting those high-probability setups you can enter, manage, and leave to run whilst you concentrate on the things you love doing.
Here’s what you’ll find in this analysis:
Key Levels & Zones: Support, resistance, and Fair Value Gaps that matter on the smaller timeframes.
Price-Action Clues: Exact candlestick patterns and momentum signals to watch for your next entry.
Trade Triggers & Targets: Clear criteria for when to get in, where to take profits, and how to manage your risk.
Whether you’re hunting quick scalps or tactical swing moves, our goal is simple: help you trade with confidence, clarity, and community support. Got a different view or a fresh idea? Drop it in the comments—after all, “each one, teach one.” 😉
Let’s dive into the charts and make today’s market moves count! 🚀📈
Donald Trump’s presidency continues to exert outsized influence on gold through three main channels: trade policy uncertainty, fiscal stimulus (and resulting deficits), and shifts in safe-haven demand. Here’s how each factor has played out—and what it could mean for gold going forward:
1. Trade-War Uncertainty
What’s Happening: The Trump administration’s aggressive use of tariffs—including recent 25% duties on goods from Japan and South Korea—has periodically roiled markets and driven investors into gold as a safe haven. On July 7, gold pared losses after tariff news, as traders sought refuge despite a firm dollar.
Looking Ahead: If further tariff escalations or retaliations emerge, expect renewed spikes in gold. Conversely, any de-escalation or trade-deal breakthroughs could sap that safe-haven bid.
2. Fiscal Stimulus & Deficits
What’s Happening: Senate Republicans recently passed a Trump-backed tax‐and‐spending package projected to add $3.3 trillion to the U.S. deficit. Larger deficits—especially when financed by the Fed—tend to stoke inflation expectations, which bolsters gold’s appeal as an inflation hedge.
Looking Ahead: Continued large-scale stimulus or fresh tax cuts without offsetting revenue measures could keep real yields low (or negative), a classic tailwind for gold.
3. Safe-Haven Flows & Investor Positioning
What’s Happening: Despite peaking at record highs earlier this year, gold remains up roughly 30% since November, driven largely by investor fears around Trump’s policy unpredictability and geopolitical tensions.
Looking Ahead: Should Trump-era uncertainty persist—whether around trade, foreign policy, or domestic turmoil—gold is likely to retain its status as a portfolio diversifier and crisis hedge. A sustained drop in U.S. real rates or fresh bouts of market volatility would reinforce that trend.
🎯 Outlook Summary
Bullish Drivers: Ongoing trade-war rhetoric, larger deficits, and any new geopolitical flashpoints.
Bearish Risks: Clear resolution of major trade disputes, a pivot by the Fed toward earlier rate cuts (reducing real‐rate support for gold), or diminished investor fear.
------------------------------------------------------------------------------------------
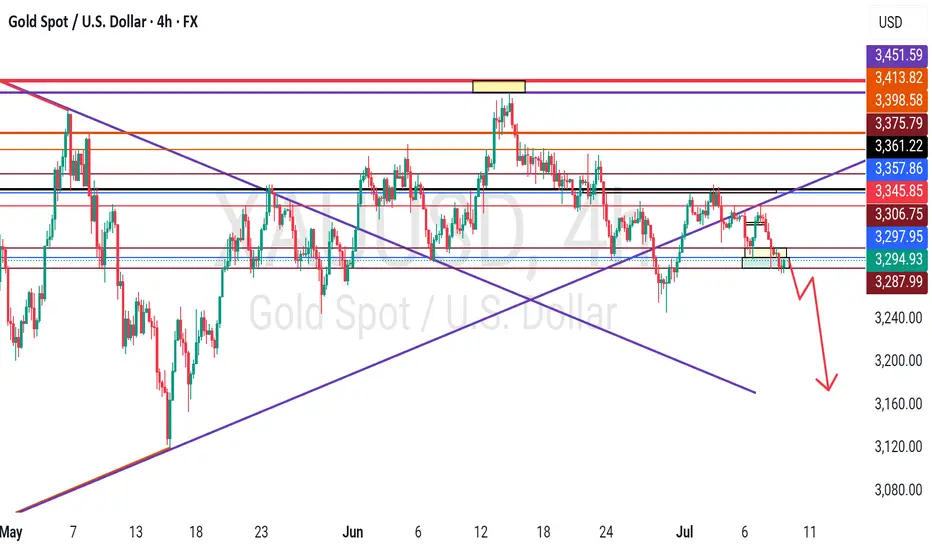
PhoenixFX price action analysis based on the Daily time frame
🔴 Primary Resistance (Daily)
Zone: $3,348 – $3,400
Why It Matters:
Multiple daily closes have stalled here, leaving a clear Fair-Value Gap (dashed purple). Sellers are likely to defend this range until we see a decisive daily close above $3,400.
📉 Bearish Bias – Short Setups
Short at Resistance
Entry: Bearish daily reversal candle (engulfing, pin-bar) in $3,348–$3,400
Targets:
TP1: $3,290 (50% of Primary Buy Zone)
TP2: $3,250 (Primary Buy Zone low)
TP3: $3,172 (Secondary Buy Zone high)
Stop-Loss: Above $3,420
Breakdown Short
Trigger: Daily close below $3,250 (Primary Buy Zone low)
Entry: On the open of the next daily candle after close below $3,250
Targets:
TP1: $3,172 (Secondary Buy Zone)
TP2: $3,026 (Final Buy Zone 50% level)
Stop-Loss: Above $3,290
🔵 Potential Long Opportunities
Defensive Long (Aggressive)
Entry: Bullish daily rejection candle in $3,250–$3,290
Targets:
TP1: $3,348 (short-term resistance)
TP2: $3,400 (key resistance)
Stop-Loss: Below $3,230
Trend-Reversal Long (Ultra-Conservative)
Trigger: Daily close above $3,400
Entry: Open of the next daily candle after the close above $3,400
Targets:
TP1: $3,450
TP2: $3,500+
Stop-Loss: Below $3,360
📊 Week-Ahead Scenarios
Bearish Scenario (High Probability):
Price remains capped under $3,400.
Look for a bearish signal in $3,348–$3,400 to initiate shorts.
A break below $3,250 extends the move into deeper demand zones ($3,172 → $3,026).
Bullish Counter-Trend (Lower Probability):
Strong daily rejection candle in $3,250–$3,290 could spark a relief rally.
Short-term longs can target $3,348 and $3,400—ideal for quick swing trades.
Only a sustained daily close above $3,400 shifts the bias back to the upside.
Just a Heads-Up:
This is my take on the charts—not gospel, not financial advice, and definitely not a crystal ball 🔮.
Trading is part skill, part patience, and part “what just happened?” 😅
We all see things a little differently, and that’s the beauty of it. So if you’ve got a hot take, wild theory, or just want to drop some chart wisdom—hit the comments!
Let’s grow, learn, and laugh through the madness together. 🚀📈
Each one, teach one.
— Phoenix FX Team 🔥🦅

Gold Price Analysis July 9GOLD XAU/USD ANALYSIS – CONFIRMING THE CONTINUATION OF THE BEARISH WAVE
Yesterday's D1 candle confirmed the downward momentum of gold when the selling pressure returned strongly below the liquidity candle wick. This shows that the selling pressure is still dominant and the downward momentum is likely to continue in today's session.
🔹 IMPORTANT RESISTANCE ZONE: 3297
The 3297 zone – which was a strong support in yesterday's session – has now turned into a resistance zone. This is a potential SELL zone for the day, especially if there is a confirmation signal from the sellers at this price zone.
🔹 CONFUSION RESISTANCE ZONE: 3310
The 3310 area is the confluence between the downtrend line and the resistance zone of the US session – which needs special attention in the SELL strategy. If the price approaches this zone, expect a reaction from the selling side to return.
🎯 SUGGESTED STRATEGY:
SELL when price does not break through 3297 (confirm selling pressure at resistance)
SELL DCA if price breaks down to 3276
Target: 3250
BUY only considered if price holds 3276 and has a bullish reaction
📌 Key Levels:
Support: 3277 – 3250
Resistance: 3297 – 3310 – 3328
Important reaction zone: 3377 (if price rebounds)

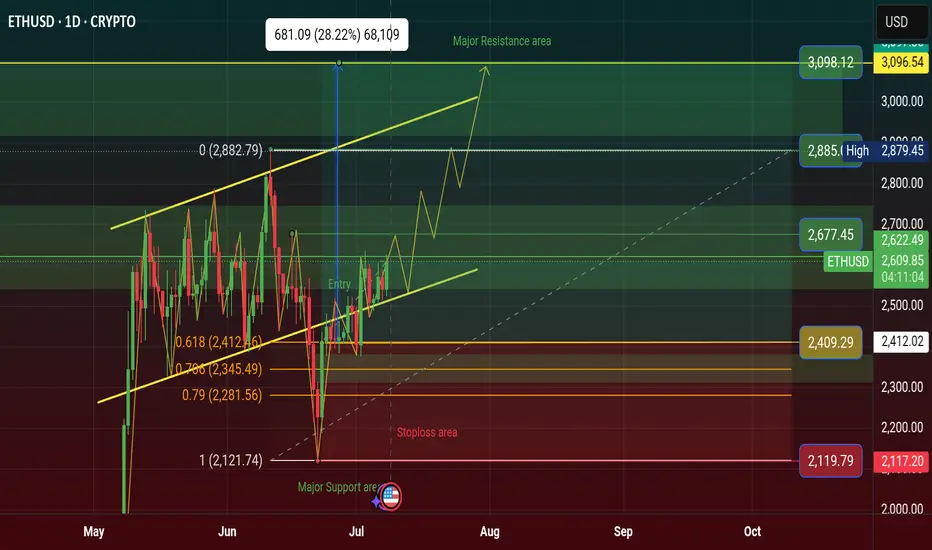
$ETH Price Will Rising $3098 in Q3, Bullish Flag Inverse AngleCRYPTOCAP:ETH price will Rising $3098 in Q3 in 2025, Price Showing a Bullish Flag Inverse Angle. it's a Reversal Pattern and Manipulation Price. See more on Chart.
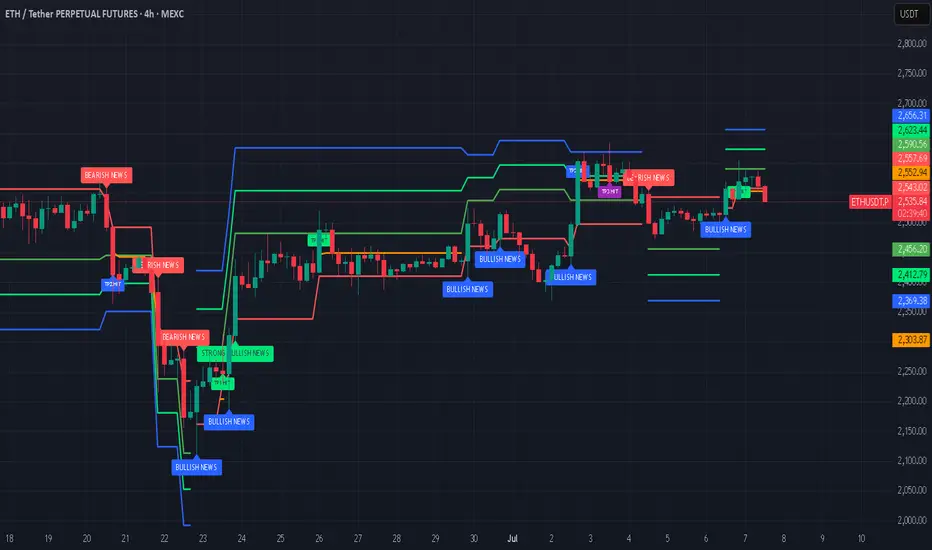
Crypto News: An Ethereum address holding 900 ETH started moving coins Monday after spending nearly 10 years dormant.
The holder received these genesis coins in 2015 when ETH traded below 50 cents.
These pre-mined tokens were distributed to early Ethereum contributors before mining began.
Their current value reaches 2.2 million with ETH trading around 2,529 per coin.
This represents potential gains exceeding 5,000% from the original sub-dollar entry price.
The move follows similar whale activity, including a 27.6 million Ethereum sale in April.
Last week saw a Bitcoin whale move 8 billion after 14 years of hodling.
ETH remains 48% below its 2021 all-time high of 4,878 despite recent stability.
The holder technically isn't a whale, which requires a minimum of 10,000 ETH at current prices.
#Write2Earn #BinanceSquareFamily #ETH #SUBROOFFICIAL
Disclaimer: This article is for informational purposes only and does not constitute financial advice. Always conduct your own research before making any investment decisions. Digital asset prices are subject to high market risk and price volatility. The value of your investment may go down or up, and you may not get back the amount invested.
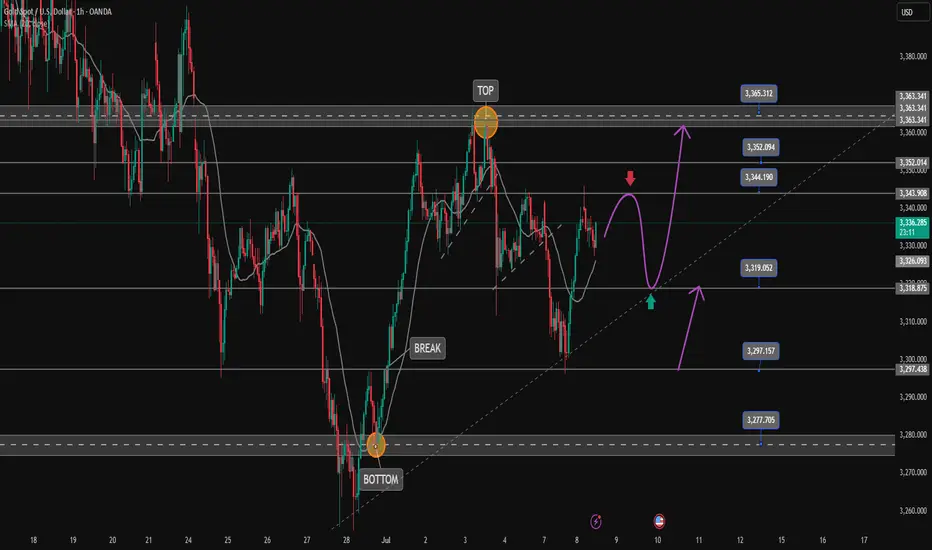
Gold is bullish and needs more momentum at 3320The buying pressure in the US session pushed the price up and formed a bullish hammer candle on D1. Today's bearish recovery is seen as a buying opportunity to head towards the uptrend again.
3344 is the immediate resistance zone in the European session that Gold faces. Breaking this resistance zone will head towards 3365. According to the wave structure, it would be great to have a retest of 3320 to find some buying momentum and then break 3344.
SUPPORT: 3320-3297
RESISTANCE: 3345-3352-3365
SELL Trigger: Break 3320 ( Trendline & break zone)
Do you have any comments on the trading plan? I would love to hear your views.
GOLD BUY ZONES Gold Buy Zone We Have
Bullish Engulfing Area ( 3317 - 3311 )
Order Block Area ( 3304 - 3295 )
Target We Are Expect Previous High Lets Gooo

MYX / USDTBITGET:MYXUSDT
### ⚠️ MYXUSDT Technical Overview – 3H Chart
---
### 📍 **Price at Analysis:** \~0.1004 USDT
🔻 -3.35% on the current 3-hour candle
---
### 🔼 **Resistance Zones:**
1. **0.128 – 0.145 USDT (Red Zone):**
* Price was sharply rejected here twice.
* Aligns with **downtrend resistance line**.
* Strong sell pressure.
2. **Trendline Resistance (Red Diagonal):**
* Bearish structure still intact.
* Lower highs forming consistently.
* Price must break this trendline + red zone for a reversal confirmation.
---
### 🔽 **Support Zones:**
1. **0.0875 USDT**
* Labeled “Not clear Support” — suggests minor or uncertain buying interest.
* Still acting as a reaction level.
2. **0.0700 – 0.0660 USDT (Yellow Zone):**
* Valid historical support, reacted strongly before.
* Possible bounce area if price breaks below 0.0875.
3. **0.0460 USDT (Blue Line):**
* Strong, deeper support.
* Acts as a **last-stand** zone before major drop continuation.
---
### 🔍 **Chart Summary (Human Tone):**
MYXUSDT is clearly in a **downtrend**, facing strong selling near the red zone. The recent bounce lost momentum right at the trendline. Unless bulls break above 0.13 with volume, risk remains high. Support near 0.0875 is weak, so if price fails there, **downside toward 0.0660 or lower** is possible.
---
> **Disclaimer:** *This is not financial advice. Chart analysis is for educational and informational purposes only. DYOR (Do Your Own Research).*

HBAR / USDTBYBIT:HBARUSDT
### 📉 **HBAR/USDT 4H Chart Analysis**
*(As of 0.15684 USDT)*
---
### 🔼 **Resistance Zones:**
1. **0.158–0.160 (Local Resistance):**
* Multiple rejections in this zone.
* Price currently struggling to break through.
2. **0.17548 (Major Resistance):**
* Strong historical level.
* Acted as a turning point previously.
---
### 🔽 **Support Zones:**
1. **\~0.150 (Local Support):**
* Recent reaction area.
* Price found temporary stability here.
2. **0.14241 (Major Support):**
* Strong reversal zone in previous sessions.
* Significant demand was seen historically.
---
### ⚙️ **Price Behavior:**
* Market is in a **sideways consolidation** phase.
* No breakout or breakdown confirmed.
* Structure is developing between support and resistance boundaries.
---
### 📌 **Key Observations:**
* Lower highs forming near resistance may suggest hesitation.
* Consolidation can often lead to stronger moves once direction is confirmed.
* Watching volume and reaction near key levels is critical.
---
> **Disclaimer:**
> This analysis is for educational and informational purposes only. It is **not financial advice**. Always do your own research (DYOR) and consult a professional before making any trading decisions.

Gold price analysis July 8In the previous US session, strong buying pressure pushed gold prices up and formed a bullish hammer candlestick pattern on the D1 chart - a potential sign for an uptrend recovery.
🔄 Today's scenario: The correction in the early session is considered a good opportunity to buy, expecting the price to continue the uptrend.
📍 Nearest resistance zone:
The price is currently facing the resistance zone of 3344 in the European session. If gold breaks 3344, the next target will be 3365 - the gap zone that has not been filled.
However, according to the wave structure, it would be more optimal if the price has a retest to the 3320 zone, accumulates more buying momentum and then breaks out strongly through 3344.
📉 Bearish scenario:
If 3320 is broken, especially with a trendline and support zone breakout signal, a sell strategy can be activated with a lower target.
🔸 Support: 3320 – 3297
🔸 Resistance: 3345 – 3352 – 3365
🔸 Sell is triggered if: Price breaks 3320, confirms breaking trendline & support zone.
💬 Do you have any comments on this trading plan? Leave a comment!

Gold bullish setup "Gold Buy Setup: Price is bouncing off key support at ,3333/3335 with a potential bullish reversal in play. Buying opportunity on the horizon
Gold buy level 3333/35
First target 🎯. 3338
Second target🎯 3342
Third target 🎯 3347
Guys leave comment what you think about this setup

Trend Continuation After NonfarmToday's D1 candle started to continue the trend of NF with a decrease to 3306 in the Asian session this morning.
The bearish structure of Gold Price will continue in today's trading session towards important support zones.
The downtrend of Gold was only broken with a candle closing back above 3324. And the downtrend may reach support 3275 today.
Support 3297-3275
Resistance 3324-3343-3364
SELL Trigger: Break support 3296

ETH - Should I go long?Ethereum (ETH) is currently positioned at a critical juncture, with multiple technical and fundamental indicators suggesting the potential for a significant move ahead.
Current Price and Momentum: As of the latest real-time data, ETH is trading at $2,549.97, having recently started a fresh increase above the $2,520 zone. The price is above both the $2,550 level and the 100-hourly Simple Moving Average, indicating short-term bullish momentum.
Key Resistance Levels: The immediate resistance is near $2,600, followed by $2,620 and a major barrier at $2,650. A decisive break above $2,650 could open the path toward $2,720 and potentially $2,800 in the near term.
Support Levels: On the downside, $2,520 is a key support zone. A sustained drop below this could trigger declines toward $2,500 or even $2,420, but as long as ETH holds above $2,520, the bullish structure remains intact.
On-Chain and Institutional Signals: Long-term holders have been accumulating ETH, and institutional inflows have surged, with over $750 million invested recently. This accumulation, alongside strong ETF inflows and rising staking activity, points to growing confidence and could act as a catalyst for a major price move.
Technical Patterns: ETH is consolidating above critical moving averages and within bullish chart formations (such as ascending triangles and coiling structures). These patterns often precede significant breakouts, especially when accompanied by increasing trading volumes and improving momentum indicators.
Market Sentiment: While short-term indicators show some cooling, the broader trend remains bullish. Analysts note that if ETH can break above the current resistance cluster, it could ignite a new wave of bullish momentum and set the stage for a broader breakout.
In summary: Ethereum is at a pivotal resistance zone. If it can break and hold above $2,600–$2,650, analysts expect a strong move higher, with targets at $2,800. Institutional inflows, strong on-chain accumulation, and bullish technical setups all support the case for a significant upside move in the coming weeks or months, provided key support levels are maintained.
Note that a possible correction of Bitcoin (which essentially will result in a drop of the entire crypto market) is possible in the next weeks.
#crypto #eth #btc #bitcoin #ethereum #analysis #trading #portfolio #long #algorithm #buysellsignals #tradingsignals #bullrun
BTC's Situation, A Comprehensive Analysis !!!Bitcoin is now at a point where it cannot be ignored! In my view, the bullish wave has started after the corrective wave ended. This wave could continue until it breaks the ascending triangle, then with a slight correction, push the price upward again. The current period and the coming days could be crucial in determining the market's trend.
Best regards CobraVanguard.💚

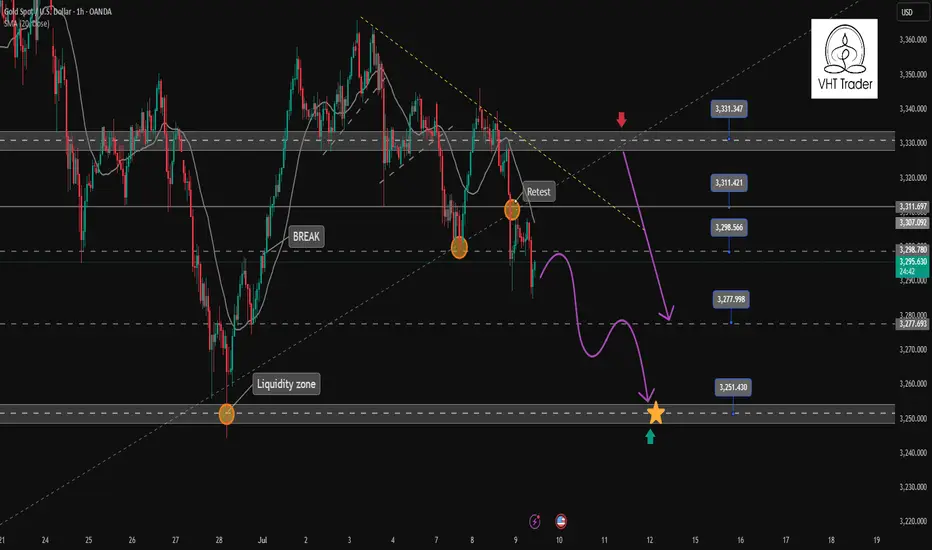
Gold Trading Strategy July 3✏️D1 candle continues to increase towards the price gap zone. At the beginning of the European session, sellers accept to enter the market at this resistance price zone around 3365. The accumulation pattern of gold price is forming a triangle pattern.
The lower boundary is broken, it will lead to the breakout point of the lower boundary and vice versa, if the upper boundary of the triangle is broken, the price will move towards the next resistance.
📉 Key Levels
Resistance: 3388-3363
Support: 3330-3311-3297-3277
Buy trigger: breakout above 3363
Sell trigger: breakout below 3330
If this idea resonates with you or you have other ideas, please comment. I look forward to reading your thoughts!
Best regards, VHT Traders!

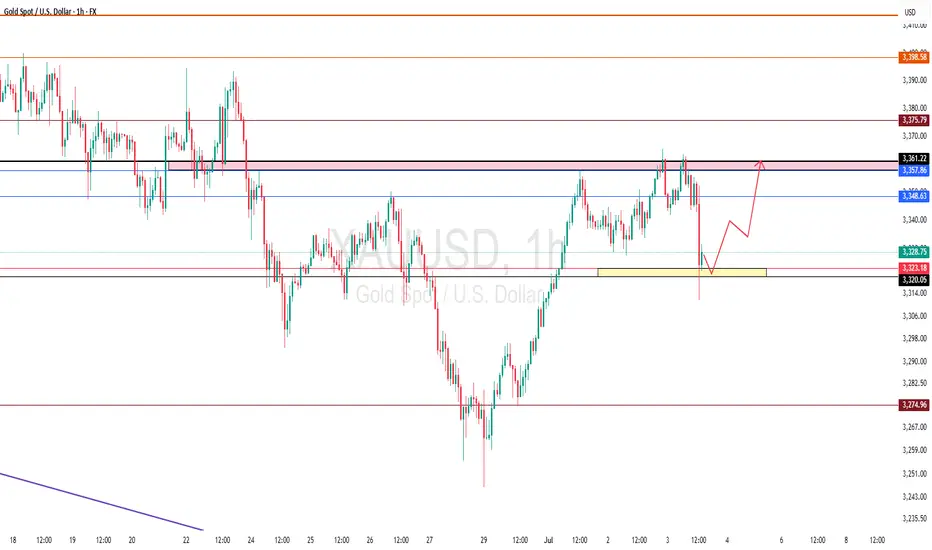
GOLD - at CUT n REVERSE Area? holds or not??#GOLD.. market palced around 3317 18 as day low so far but hour closed above 3323 that was our area.
so keep close our region that is around 3320 to 3323
that is our ultimate region for now and if market hold it in that case we can expect bounce again
NOTE: below 3320 we will go for cut n reverse on confirmation.
good luck
trade wisely
BTC: Long Position1W buy signal at $109K. Entered Long Position & currently 10 per cent in profit. BTC is going for a new ATH in the next days.
#crypto #bitcoin #trading #buysellsignals #algorithm #bot

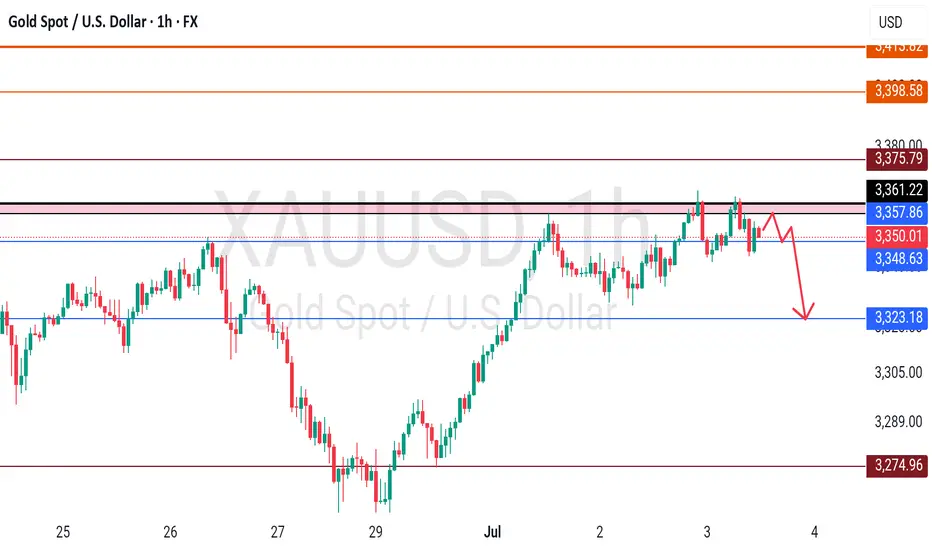
GOLD - High placed? Short now?#GOLD... market placed 3362-64 after our last idea regarding gold buying.
And market behaved indicate us that that is a final high for now and below that a dip can be possible.
So keep close and don't buy until market holds..
Good luck
Trade wisely
Exact Entry Levels & Profit Potential (July 3, 2025)🎯 Market Structure Breakdown – Exact Entry Levels & Profit Potential (July 3, 2025)
📊 In today’s session, I revisit the market for the second time – and you’ll see why I’m ruling out some setups altogether. There’s value in looking twice. What did I miss earlier? It's all in the structure.
I break down price action step by step, highlight precise entry zones, and show where the real potential for movement lies. Clean levels, no guessing.
⚠️ Note: I don’t trade the first 10 seconds – all orders are placed after 9:30:10 and I'm looking for entries only until 11:30:00.
👉 Check out the full breakdown and stay ahead of the game.
NASDAQ:AMZN
NYSE:ANET
NASDAQ:AVGO
NYSE:BA
NASDAQ:COIN
NASDAQ:CZR
NYSE:DELL
NASDAQ:GOOG
NASDAQ:MSFT
NASDAQ:AMD
NASDAQ:RKLB
NASDAQ:SBUX
NASDAQ:SMCI
NYSE:VRT
NASDAQ:NVDA
