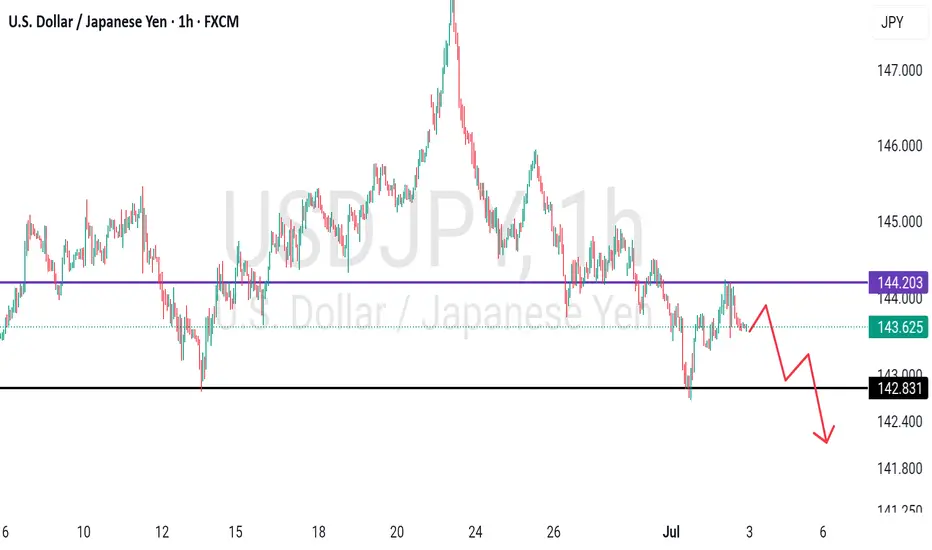
USDJPY - placed reasonable high? What's next??#USDJPY.. market placed 144.20-25 day high in yesterday and that is a very reasonable high.
If market hold it in that case we can expect drop from here.
Don't be lazy here.
Good luck
Trade wisely
Tradingsignals
Gold price analysis July 2As expected, after the D1 candle showed the return of buying power, yesterday's trading session saw the price continue its upward trend and reach 3357.
Currently, the market is in an accumulation phase with a fairly wide range, fluctuating from 3328 to 3344. This is an important price zone, acting as a "sideway box" waiting for a breakout.
The priority strategy at this time is still trend trading - activated when the price breaks out of the above accumulation zone.
BUY orders will have a high probability of success if the price adjusts and retests the Support or Resistance zones that have just been broken, then forms a confirmation signal.
Meanwhile, SELL orders around resistance should only be considered a recovery strategy in an uptrend - requiring strict risk management and short-term profit expectations.
Breakout Range: 3328 – 3344
Support: 3310 – 3298
Resistance: 3368 – 3386

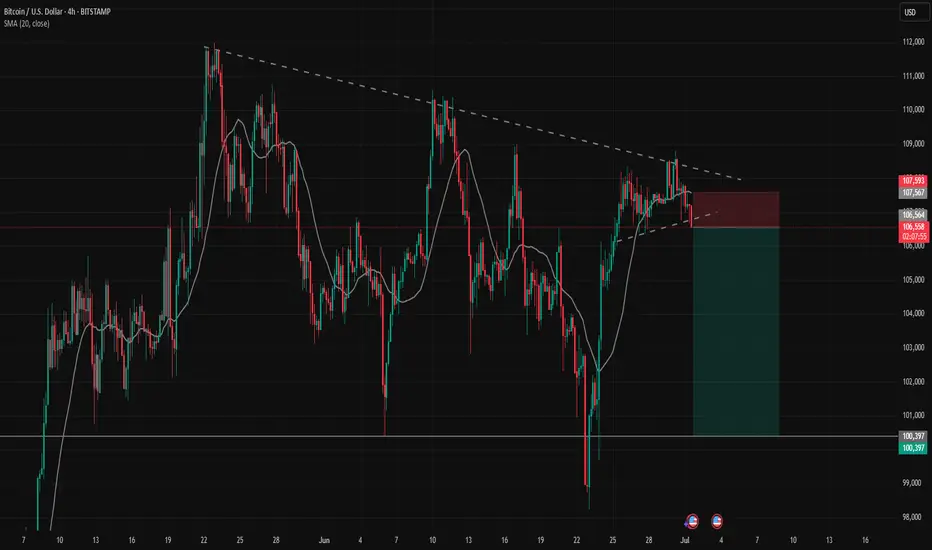
SELL BTCUSD trading signalBTCUSD confirmed the weakness at the trendline resistance zone on the h4 time frame.
The h1 time frame price confirmed that the sellers won when the candle closed below the nearest trendline support zone.
In terms of wave structure, there is no strong support zone that is strong enough to keep the BTC price uptrend in the short term. Therefore, the target of the SELL signal can reach 100,400. That is the wick area of the past liquidity candle where the buyers won over the sellers and pushed the price up sharply.
Gold Trading Strategy July 1✏️ D1 candle has a bullish recovery when closing above 50% of last Friday's decline.The bullish wave of Gold is forming, heading back to the GAP 3363 zone.Today's main strategy is to wait for BUY if there is a retest of 3300. Reaction sell strategy is focused on resistance zones with not too long expectations.
📈 Key Levels
Support 3300- 3379- 3360
Resistance 3334-3348-3363
📊 Recommended Trade Setups
BUY GOLD 3300-3298 Stoploss 3295
SELL GOLD 3348-3350 Stoploss 3353

Gold price analysis July 1On the D1 chart, the price has recovered positively when the candle closed above 50% of the decrease range of last Friday's session. This shows that buying power is returning and a new uptrend is forming, with the target heading towards the GAP zone around 3363.
Today's trading strategy:
Prioritize buying (BUY) if the price has a correction to the support zone of 3300.
Sell strategy should only be implemented at important resistance zones, with short-term profit expectations because the main trend is leaning towards the uptrend.
Important technical levels:
Support: 3300 - 3337 - 3360
Resistance: 3334 - 3348 - 3363

FARTCOIN Bullish Reversal in Progress
CRYPTO:FARTCOINUSD 3-swing correction from the May peak appears complete, even though price didn’t quite tag the $0.75 entry zone.
Now, the spotlight’s on the bulls — can they deliver an impulsive rally off the lows to invalidate a potential double correction next month?

KAITO gears up for liftoff!CRYPTO:KAITOUSD
The correction from the May peak has wrapped up within wave (2), and price is now pivoting from the June low at $1.22. Holding above that level keeps the bullish roadmap intact—with eyes firmly on the $2.96 target to unlock fresh all-time highs.

This is a deception or maybe a technique !!!I think this head and shoulders pattern is trying to deceive us and is fake. I expect the price to drop to the support line and then rise to $109k. WAIT FOR IT....
Give me some energy !!
The Crypto Market Game: How to Win Against Fear and Manipulation
Did you really think profiting from the current bull run (a comprehensive upward market) would be easy? Don't be naive. Do you think they’ll let you buy low, hold, and sell high without any struggle? If it were that simple, everyone would be rich. But the truth is: 90% of you will lose. Why? Because the crypto market is not designed for everyone to win.
They will shake you. They will make you doubt everything. They will create panic, causing you to sell at the worst possible moment. Do you know what happens next? The best players in this game buy when there’s fear, not sell—because your panic gives them cheap assets.
This is how the game works: strong hands feed off weak hands. They exaggerate every dip, every correction, every sell-off. They make it look like the end of the world so you abandon everything. And when the market rises again, you’re left sitting there asking, “What just happened?”
This is not an accident. It’s a system. The market rewards patience and punishes weak emotions. The big players already know your thoughts. They know exactly when and how to stir fear, forcing you to give up. When you panic, they profit. They don’t just play the market—they play you. That’s why most people never succeed: they fall into the same traps over and over again.
People don’t realize that dips, FUD (fear, uncertainty, doubt), and panic are all part of the plan. But the winners? They block out the noise. They know that fear is temporary, but smart decisions last forever.
We’ve seen this play out hundreds of times. They pump the market after you sell. They take your assets, hold them, and sell them back to you at the top—leaving you with nothing, wondering how it happened.
Don’t play their game. Play your own.

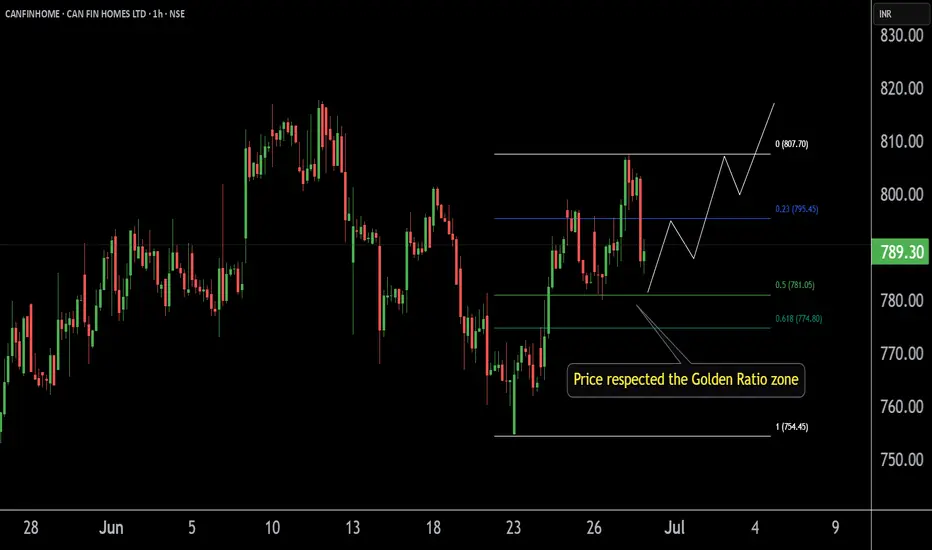
CANFINHOME'S Key ZoneThis is the 1 hour chart of CANFINHOME.
Canfinhome is taking support at the Fibonacci Golden Ratio zone.
If this zone is sustain then we may higher price in CANFINHOME .
Thank You !!
LTO Analysis - What Shall we Expect !!!If the price can break through this Wedge's resistance, I expect it to reach $0.05 in a short time.
Stay Awesome , CobraVanguard

It's disappointing !!!Do you think this will happen, or do you see ADA below $0.50 in the future?
Best regards CobraVanguard.💚

Gold Price Analysis June 27Daily Trend Analysis:
The price has reacted strongly at the 3348 level, forming a clear and sustainable bearish structure. The 3296 zone is now a critical level — a confirmed breakout below this area could lead to a deeper decline, especially with limited potential for recovery on Friday.
Today, the bearish trend is likely to face less resistance compared to the bullish side. As such, a move toward the support zones at 3278 and 3255 is highly probable.
Any bullish retracement during the European session should be viewed as a good opportunity to look for SELL setups, targeting 3278 and 3255.
As previously analyzed, SELL zones are clustered around key resistance levels. Traders should closely watch price reactions in these areas for potential entry signals.
🔹 Breakout key level: 3296
🔹 Support zones: 3278 – 3255
🔹 Resistance zones: 3300 – 3312 – 3325 – 3336 – 3348 – 3363

Gold Price Analysis June 25The Daily Candle shows a strong selling force breaking out of the 3-day accumulation zone. Gold hits the support zone of 3296 and bounces towards the resistance zone of 3342. Today, there is unlikely to be a rebound, there is a possibility of an increase in the Asian session and the European session, and the US session will return to the Selling force.
The recovery from 3296 towards 3342, some selling force may appear around 3342, forming a strong bearish structure. The Bearish Wave Structure will weaken if it breaks 3342. The 3363 area is still noteworthy for SELL signals.
The market closed above 3363, confirming the break of the downtrend and heading towards the resistance zone of 3388. The bottom support of 3302 will help prevent a temporary decline before heading towards the target of 3278.

Gold Trading Strategy June 24Quite surprised with the price gap down at the beginning of the day. A sweep to 3333 and recovery to increase again in the Tokyo trading session.
This recovery completely breaks the market's bullish wave structure.
3363 and 3335 are paying attention in today's Asian and European trading sessions. This area can be traded short-term in the sideways range. The SELL area pays attention to the opening gap at 3368.
The upper range has some adjustments compared to yesterday in the direction of decreasing prices, so the SELL range 3386 and 3410 is paid attention to for trading.
Resistance: 3363-3368-3386-3410
Support: 3335-3322-3296
Good trading signal
BUY GOLD 3323-3321 Stoploss 3318
SELL GOLD 3363-3365 Stoploss 3370

EURUSD Sell/ShortFundamental Analysis
EURUSD rates is being influenced by the current Eurozone's economic performance, driven by key economies like Germany and France, continues to be shaped by industrial output, consumer confidence, and inflation trends. The European Central Bank (ECB) has likely maintained a cautious monetary policy, with interest rates possibly held steady or adjusted slightly to combat inflation while supporting growth. On the U.S. side, the Federal Reserve's stance on interest rates, potentially in a tightening phase to address persistent inflation plays a critical role. Recent U.S. economic data, including GDP growth, employment figures, and consumer spending, may indicate a robust dollar, putting downward pressure on EURUSD. Additionally, geopolitical tensions, energy prices (affecting Eurozone energy imports), and trade balances between the U.S. and EU are likely contributing to volatility. Given the current date, recent ECB and Fed statements or data releases for June 2025 inflation reports.
Technical Analysis:
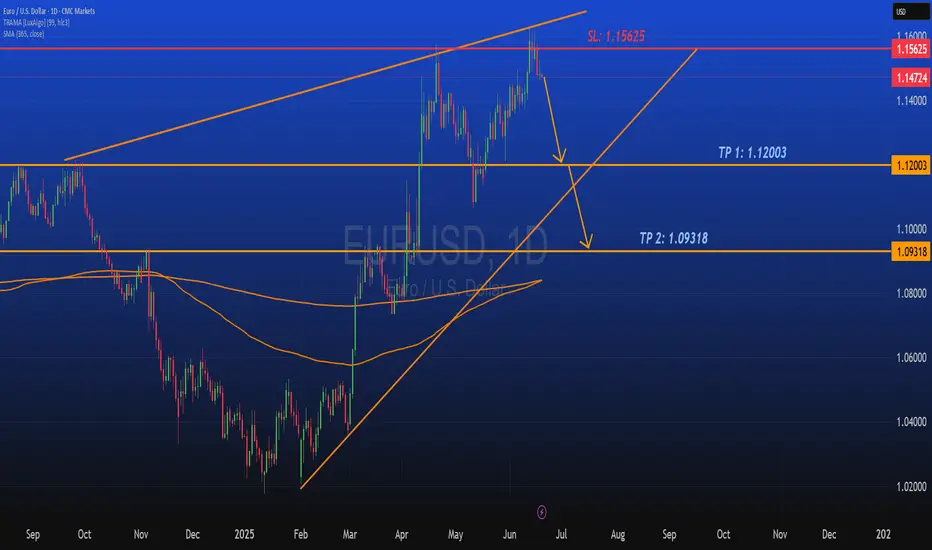
Based on the provided EURUSD 1D chart (covering mid-2024 to mid-2025), the following technical observations can be made:
Trend and Moving Averages:
For EURUSD it shows a descending trend from a peak around 1.48 in mid-2024, with a potential reversal or consolidation forming in mid-2025. The 50-day and 200-day moving averages (depicted as orange lines) are sloping downward, with the price recently testing these levels around 1.12-1.13. A break above the shorter-term moving average could signal bullish momentum, while a failure to hold might confirm a continuation of the downtrend. Looking for key support levels here are identified at 1.09318 (TP 2) and 1.08000, with the current price hovering near 1.12003 (TP 1). Resistance is notable at 1.15625 (SL) and the previous high near 1.4800. The price action suggests a potential bounce from the recent low, with the next target being the resistance zone around 1.15625 if bullish momentum persists. Candlesticks and volume patterns are showing a recent green candlesticks indicate buying pressure, potentially forming a reversal pattern near the 1.12 level. Volume analysis would confirm the strength of this move, with higher volume on upticks supporting a breakout.
Overall Bias:
The technical setup suggests a short-term bullish correction within a broader bearish trend, contingent on breaking and holding above 1.15625. A drop below 1.09318 would invalidate the bullish case and resume the downtrend toward 1.08000 or lower.
Sentiment Analysis
Market sentiment as of June 2025 likely reflects heightened interest in EUR/USD due to recent economic data and central bank policies. Traders and analysts are closely watching for signs of ECB rate cuts or Fed rate hikes, which could sway the pair. On social platforms and financial forums, there may be a mix of caution and optimism looking out for caution due to the Eurozone's economic challenges (energy costs, political uncertainty), and optimism if U.S. data softens, weakening the dollar. The chart's visibility on trading platforms suggests retail and institutional traders are actively monitoring this pair, with a focus on the 1.12-1.16 range as a critical decision point. Sentiment could shift rapidly based on upcoming economic releases or geopolitical developments.
Conclusion
The EUR/USD pair is at a pivotal juncture, with fundamentals pointing to a stronger USD due to Fed policy, while from a technical standpoint suggest a short-term bounce toward 1.15625 if support at 1.12003 holds. Sentiment indicates active trader interest, with eyes on central bank moves. A break above resistance could target 1.4800 (long-term), while a failure might see a decline to 1.08000. Monitor upcoming data for confirmation.
AUDUSD - 4h |||Check this out for comprehensive analysis...
#AUSUSD #MJTRADING #FOREX #FXsignals #chart

AUDCHF: Bearish Move From Resistance Confirmed?! 🇦🇺🇨🇭
AUDCHF may drop from the underlined blue supply zone,
following a bearish breakout of a support line of an expanding
wedge pattern on an hourly time frame.
Goal - 0.5253
❤️Please, support my work with like, thank you!❤️

Eicher Motors breaks?Eicher Motors breaks out of resistance with volume eyes set on the upper trendline near 6011.
After weeks of consolidation between 5250 and 5575, Eicher Motors has finally broken out of its sideways zone with strong follow-through and bullish intent.
Price not only cleared horizontal resistance but also pushed above the red supply zone around 5645, confirming buyer dominance.
This breakout aligns with the broader ascending channel that has been intact since March. The structure now hints at a potential continuation toward the upper channel line, projected near 6011 level highlighted risk-reward 1:3,
From a fundamental lens, Eicher has seen improved export numbers and rising traction in the premium segment, especially with Royal Enfield's increasing demand in overseas markets. If macro sentiment remains supportive, this technical breakout could be backed by earnings momentum in the upcoming quarters.
On the flip side, a failure to sustain above ₹5575 may drag the price back to test the breakout zone around ₹5430–₹5250.
Like, comment your thoughts, and share this post
Explore more stock ideas on the right hand side your feedback means a lot to me!
Disclaimer: This post is for educational purposes only and should not be considered a buy/sell recommendation.

Instructions on how to potentially use the SIG[TP/SL (1H-4H-1D)]It's a HF algorithm for the 1H,4H,1D Time-Frames. Which means whenever the instrument reaches the open price, the algo might give a lot of signals and sometimes it might give plenty of reverse signals. In order to use the specific algo in the best possible way, here's a helpful guide on how to potentially use it:
1)Wait for the instrument to reach the open price.
2) ALWAYS, Follow the signals, e.g: We are at the open price. If it indicates buy signal, then open a long position. If for example 5 seconds later (again at the open price) it indicates a sell signal, then reverse the long position into a short position, and keep doing it until it gives a signal, that will be followed by a good sized candle.
3) The safest way is to close the trade when the price reaches the potential TP1.
4) Happy Trading!
*The text above is not an investment advice, and it does not guarantee any profit.

Gold Price Analysis June 24Quite a surprise with a price gap down at the beginning of the day. A sweep to 3333 and a recovery to increase again in the Tokyo trading session.
This recovery to increase completely breaks the market's bullish wave structure.
3363 and 3335 are being watched in the Asian and European trading sessions today. This zone can be traded short-term in the sideways range. The SELL zone pays attention to the opening gap at 3368.
The upper range has some adjustments compared to yesterday in the direction of decreasing prices, so the SELL range 3386 and 3410 is being watched for trading. Support is still held as yesterday at the 3322 and 3296 zones.

EURUSD Trading Strategy for the WeekEURUSD is reacting at the support zone of 1.14500. This is an important support zone that helps EURUSD continue to maintain its upward momentum. The uptrend in the h4 time frame is still strong and heading towards the peak of 1.161.
Below the support of 1.145 will be the 1.138 zone. When this 1.138 zone is broken, it confirms that a Downtrend is established. The possibility of breaking this zone is not high, so it is still possible to set BUY signals around these support zones. On the other hand, 1.153 is an important resistance zone in the near future where the pair will have a price reaction before finding the peak of last week.
Support: 1.13800
Resistance: 1.16000
Break out: 1.14600-1.15300
Recommended good trading strategy:
Trade when price confirms in Break out zone.
BUY 1.13800-1.13600 Stoploss 1.13300
SELL 1.16000-1.16200 Stoploss 1.16500

Gold price analysis June 23The last two D1 candles have continuously withdrawn their wicks. The Sellers may no longer be interested in dominating the market.
Currently, Gold is moving sideways in a wide range. 3345 and 3375 are the two Breakout zones of the gold price in today's trading day. When breaking out of the breakout zone, the price will continue its strong trend. Limit trading against the trend when the price breaks out.
Trading signals may also appear if there is confirmation from the candle that does not break out of this breakout zone.
The resistance and support zones remain the same as last week. The upper limit is at 3400 and 3415. The lower limit is still at 3322 and 3296

Bullish Momentum Expected Next Week, With Geopolitical tensions 🌍 Fundamental Catalyst – Middle East Tensions Driving Gold Higher
Gold is gaining strong safe-haven demand due to escalating geopolitical tensions between Iran and Israel, further amplified by a recent U.S. military strike on Iran. These developments have sparked fears of a broader regional conflict, pushing investors to seek the stability that gold traditionally offers during periods of uncertainty. We may again see an All-Time New High of gold because things are getting closer to a new WWIII, which we never want, so these tensions will boost the gold prices.
Key Fundamentals Supporting Bullish Gold:
🛡️ Safe-Haven Demand: Gold historically rallies during military conflict and political instability.
💥 Risk-Off Sentiment: Equities may weaken while commodities like gold attract capital inflow.
🔐 Market Uncertainty: Any further escalation will likely trigger another wave of buying pressure in gold.
With this level of geopolitical uncertainty, we may soon witness a new all-time high (ATH) in gold prices. If further military actions occur, we could potentially see an explosive move of 600 to 1000 pips as early as tomorrow.
At the same time, while we analyze the market and act accordingly, our hope remains that peace will soon prevail. These conflicts are deeply painful and harmful to humanity. Let’s all hope for de-escalation and the return of stability — not just for the markets, but for the well-being of people across the world.
Technical Overview:
> The chart shows a descending channel pattern, which is still valid, but the thing is now gold will follow fundamental, not technical levels.
> Don't need to wait for the breakout of this channel, you can enter to buy a trade from here once the market opens.
> Regarding the targets we mentioned below.
>> TP1: 3400 <<
>> Final Target Zone: 3445–3450 <<
: NOTE
Given the geopolitical backdrop and historical behavior of gold in such environments, a bullish trend is expected in the coming sessions. Traders and investors should monitor developments closely, as any further escalation may act as a strong catalyst for gold to surge.
Thank you traders, for reading our idea. If any of you want to suggest something, must comment here as we can explore more. If you agreed with my idea, so must support us for more updates.
