CRVUSDT - Can break out this time?BYBIT:CRVUSDT
4H trend chart
-
CRV is building a big descending wedge since 10/28
It tried to take out this wedge but failed yesterday.
Now it approaches the upper downtrend line again.
If price can break out this downtrend line, trading strategy as below.
-
Profit Targets:
a) 4.887~5.027----Fib(1.272~1.382)
b) 5.328----Fib(1.618)
c) 5.815----Fib(2)
Stop losses:
a) 4.031-----Red horizontal ray
-
If you like this analysis, smash the "like button" and leave a comment below to share your thoughts
or let me know what crypto you want to see!
Trading is a reflection of yourself. Learn more daily and be ready for every opportunity.
Have a nice trading!
Tradingstrategies

TLMUSDT - Broke out the line and already retested itBYBIT:TLMUSDT
1H trend chart
-
TLM broke out the downtrend line but left a doji before.
Further, it retested the trend line and took it out right now.
If price can keep here w/o wicks top, trading strategy as below.
-
Profit Targets:
a) 0.4145----Optional TP(blue horizontal ray)
b) 0.5363~0.5647----Fib(1.272~1.382)
c) 0.6255----Fib(1.618)
Stop losses:
a)0.3360-----Red horizontal ray
-
If you like this analysis, smash the "like button" and leave a comment below to share your thoughts
or let me know what crypto you want to see!
Trading is a reflection of yourself. Learn more daily and be ready for every opportunity.
Have a nice trading!

✅AVAXUSDT - Spike as predicted again.-
Congrats for you who are following this trading plan as below.
-
AVAX is insane and going through every TP we set.
As usual, do not forget to take profit at every TP gradually.
Just take it anytime you satisfy.
-
Moreover, I set two new SL which are $114.55 to protect your unrealized profit.
Have a good day!.
-
If you like this analysis, smash the like button and leave a comment below to share your thoughts
or let me know what crypto you want to see!
Trading is a reflection of yourself. Learn more daily and be ready for every opportunity.
Have a nice trading!

ONEUSDT - is gonna break out this resistance?BYBIT:ONEUSDT
4H trend chart
-
ONE had broken out this descending wedge but failed before.
It left a long upper shadow line which high is 0.29829(green horizontal ray)
Now, it broke through this wedge, and is going to take 0.29829 out.
If price can stand firm at 0.29829 w/o wicks top, trading strategy as below.
-
Profit Targets:
a) 0.32501----blue horizontal ray
b) 0.38----Fib(1)
c) 0.44525~0.47163----Fib(1.272~1.382)
Stop losses:
a)0.27423-----Red horizontal ray
b)0.22731-----Red horizontal ray
Depend on the risk you can take.
-
If you like this analysis, smash the "like button" and leave a comment below to share your thoughts
or let me know what crypto you want to see!
Trading is a reflection of yourself. Learn more daily and be ready for every opportunity.
Have a nice trading!

AVAXUSDT - Good buying timing.BYBIT:AVAXUSDT
1H trend chart
-
AVAX just broke out the downtrend line, and even took out the neckline of double bottom (blue line) in 1H chart right now.
So if price can stand firm at 104.9 w/o wicks top, trading strategy as below.
-
Profit Targets:
a) 108.410~109.830----Fib(1.272~1.382)
b) 112.870----Fib(1.5)
c) 117.8----Fib(2)
Stop losses:
a)95.875-----Red horizontal ray
-
If you like this analysis, smash the "like button" and leave a comment below to share your thoughts
or let me know what crypto you want to see!
Trading is a reflection of yourself. Learn more daily and be ready for every opportunity.
Have a nice trading!

BTCUSD - Another angle to see this correctionBYBIT:BTCUSD
4H chart
-
We talked about the predicted end of correction on last post(as below)
-
Vegas tunnel/Chart pattern/Support judgement were used on last analysis.
In this post, I'm gonna propose another point that BTC might reach in near future.
-
From the right side right, you can notice a M pattern formed and price directly went down after breaking through neckline $62222.
We use Fib to presume the target of M pattern, and see 55261.5 is the best place to hit from the momentum of M pattern.
However, BTC is approaching to the Vegas tunnel 576/676 and Support zone we mentioned on Nov 17th.
So it might get effective support and not hit 55261.5, what we need to do is keep observing if a new pattern formed around here.
Obviously, we are still in a bull run.
-
Trading Strategy
Profit targets:
a) 59393~61999----Fib(1.272~1.382)--->Already Hit!
b) 67590----Fib(1.618)--->Already Hit!
c) 76640----Fib(2)
Anyway, never forget to control your risk
-
Let's see where BTC can bring us to!
-
If you like this analysis, smash the "like button" and leave a comment below to share your thousghts
or let me know what crypto you want to see!
Trading is a reflection of yourself. Learn more daily and be ready for every opportunity.
Have a nice trading!

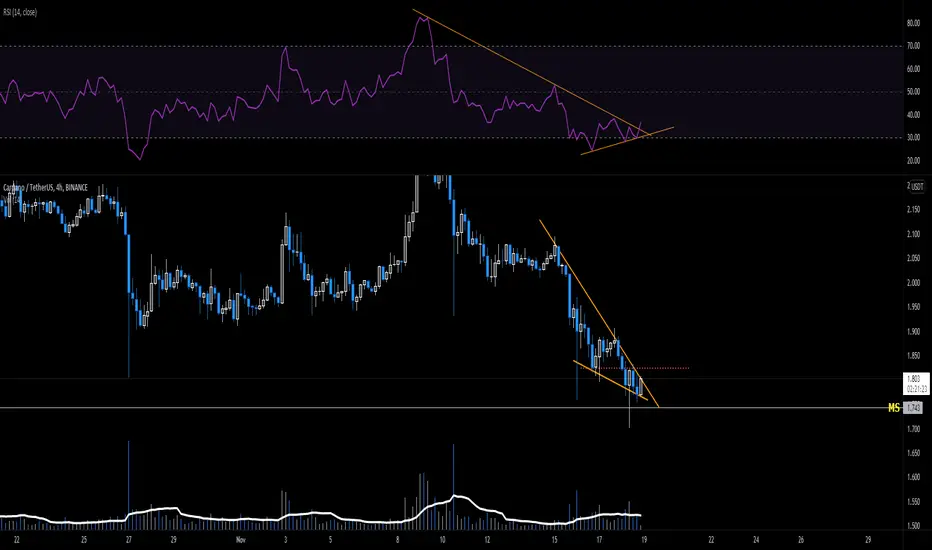
ADA-USDT trade setup #ADA
It shows signs of strength in 4h TF: RSI broke the bearish trendline and also shows bullish divergence. If the price can break the descending wedge to the upside and close above the red dot line, then things would get better at least for short time.
DYDX-USDT trade setup #DYDX
RSI broke the bearish trendline. Price is going to break the descending channel. If it can give us a close above the red dot-line, then hope will come back to our team

BTCUSDT updateA descending wedge in 1h TF with diverged RSI would be a sign of reversal here. A close above $60k would save BTC from going more down.
However, I personally don't think it can reverse from here

BTCUSD - End of correction and Nice entry timingBYBIT:BTCUSD
4H trend chart
-
Remember that opportunity comes from waiting !
After BTC reached TP1/2, it starts correcting intensely and forming a descending tunnel in 4H chart.
During this pullback, here are some effective support level we can notice.
1. Vegas tunnel 576/676 ema
Since surging from 44000 to 69000, BTC hasn't hit these two ema for a long time.
Now it is approaching to both, so it'll be a good position for entry if hit 575/676 ema and go back to 12ema rapidly.
2. Long-term support area
This green zone is build from neckline which is made of a big double bottom(from April to October)
3. Descending tunnel
Descending tunnel is a good pattern for whale to accumulate BTC volume, we usually take entry after the upper trend line gets broken.
With 3 points above, we can try to expect BTC is keeping consolidating in this tunnel and getting support around the intersection (yellow circle).
Therefore, if you are a long-term bullish traders, can enter BTC there.
Also, we can take entry after the upper downtrend line is taken out which is a safer way.
-
Trading Strategy
Profit targets:
a) 59393~61999----Fib(1.272~1.382)--->Already Hit!
b) 67590----Fib(1.618)--->Already Hit!
c) 76640----Fib(2)
Anyway, never forget to control your risk
-
Let's see where BTC can bring us to!
-
If you like this analysis, smash the "like button" and leave a comment below to share your thousghts
or let me know what crypto you want to see!
Trading is a reflection of yourself. Learn more daily and be ready for every opportunity.
Have a nice trading!

BTCUSDT updateThis super trend support is my last hope. A close below this support is a strong bearish signal for me.
If this happens, I will close my positions around the breakeven point if we see a relief bounce.

BTCUSDT updateI shared this pattern on Nov. 3. It is the last pick pattern and it seems we are going to see the same pattern here.
I expect to see another leg up to make a double-top before going more down.

ETH Elliott wave countI shared this a few days ago and warn you this would be the top for now and we are going to see a correction.
The first support area is on the chart.
I believe we can see another leg up to form a double-top before going more down.
My first zone of interest is around $4 k.

BTCUSDT updateI shared my detailed EW counting before, and I want to share it again now. Based on my counting, the 5th wave is completed and we are in the big ABC correction. Completing the 5th wave here completes the B wave (red b) and we are going to see the C wave to the downside. Still, I'm not sure about the accuracy of this counting, but it makes sense to me. It's still too soon to talk about trend reversal, but it's good to have different scenarios for your future moves.
We see divergence both in RSI and OBV. Also, RSI broke the bullish trendline to the downside which is another sign of weakness.

BTCUSDT update#BTC update:
BTC price is at a very critical point. RSI broke the trendline to the downside, and price is at both static (green box) and dynamic (bullish trendline-orange line) support. If the price cannot hold these supports, I expect to see it around $55k.

DASHUSDT - is going higher now?BINANCE:DASHUSDT
1H trend chart
-
DASH left a long upper shadow line today.
Now, it already broke the downtrend line, but there is definitely some resistance around the shadow line.
We can try to take entry here or wait for price to stand above 232.6 w/o wicks top, and trading strategy as below.
-
Profit Targets:
a) 247.8----Fib(1)
b) 264.8~271.7----Fib(1.272~1.382)
c) 286.5----Fib(1.618)
Stop losses:
a) 218-----Red horizontal ray
-
If you like this analysis, smash the "like button" and leave a comment below to share your thoughts
or let me know what crypto you want to see!
Trading is a reflection of yourself. Learn more daily and be ready for every opportunity.
Have a nice trading!
