39845.44 The importance of branchesHello traders!
If you "Follow" us, you can always get new information quickly.
Please also click “Boost”.
Have a good day.
-------------------------------------
(BTCUSDT 1D chart)
The trend shifted from USDT to an upward gap faster than expected.
Accordingly, I think the coin market has gained the strength to rise again.
However, it is necessary to check whether the HA-Low indicator can be newly created and rise while moving sideways in the current section.
In order for the HA-Low indicator to be created, the price must be maintained below 39845.44 to cause the HA RSI indicator to enter the oversold zone.
If that is not the case and it rises, I think there is a high possibility that it will meet resistance by touching the MS-Signal indicator.
Currently, the MS-Signal indicator is located around 42141.24.
The key is whether the HA-Low indicator can be generated and rise before the next volatility period around January 30th.
If BTC rises above the 42141.24-43823.59 range, altcoins are expected to rise in unison.
This is because I believe that the 42141.24-43823.59 range corresponds to the psychological resistance range.
However, for altcoins to continue their upward trend, BTC dominance must fall below 50.
If this is not the case and BTC dominance rises, altcoins are likely to gradually sideways or decline.
The BW indicator is recording a strong downward trend.
Additionally, the StochRSI indicator is also located in the oversold zone.
Therefore, if you wait, you will see that the StochRSI indicator is trying to break out of the oversold zone.
At that time, you can proceed with the installment purchase.
However, as mentioned above, there is a possibility that resistance will be encountered when touching the MS-Signal indicator, so that is the first selling period.
It is time to buy when the BW indicator shows an upward trend and rises above the MS-Signal indicator.
Have a good time.
thank you
--------------------------------------------------
- The big picture
The full-fledged upward trend is expected to begin when the price rises above 29K.
This is the section expected to be touched in the next bull market, 81K-95K.
#BTCUSD 12M
1st: 44234.54
2nd: 61383.23
3rd: 89126.41
101875.70-106275.10 (when overshooting)
4th: 13401.28
151166.97-157451.83 (when overshooting)
5th: 178910.15
These are points that are likely to encounter resistance in the future.
We need to see if we can break through these points upward.
Since it is thought that a new trend can be created in the overshooting area, you should check the movement when this area is touched.
If the general upward trend continues until 2025, it is expected to rise to around 57014.33 and then create a pull back pattern.
1st: 43833.05
2nd: 32992.55
-------------------------------------------------- -------------------------------------------
** All explanations are for reference only and do not guarantee profit or loss in investment.
** Trading volume is displayed as a candle body based on 10EMA.
How to display (in order from darkest to darkest)
More than 3 times the trading volume of 10EMA > 2.5 times > 2.0 times > 1.25 times > Trading volume below 10EMA
** Even if you know other people’s know-how, it takes a considerable amount of time to make it your own.
** This chart was created using my know-how.
---------------------------------
Tradingstrategy

Comprehensive analysis : short-term decline in fundsHello traders!
If you "Follow" us, you can always get new information quickly.
Please also click “Boost”.
Have a good day.
-------------------------------------
(USDT chart)
(1D chart)
The most recent decline was on August 8, 2023.
Before that, a precursor to a downward trend occurred starting on June 18th.
Currently, the gap has begun to decline since January 19th and has fallen below the HA-High indicator.
If the gap decreases due to this movement and falls below the MS-Signal indicator, it is expected to record a downward trend for a while.
(1M charts)
However, this decline is likely to be a short-term adjustment of about a month, such as in August 2023.
In order to record the downward trend that started in May 2022, large gap declines must occur in succession, so we still need to monitor the situation.
Therefore, I don't think there is any need to have much fear just yet.
---------------------------------------
(USDC chart)
While USDT has begun to gap down, USDC continues to gap up.
If the gap continues to rise above 26.525B, it is expected that USDC will likely continue its upward trend.
I believe that this gap increase is evidence that funds are flowing into the coin market.
Therefore, it is expected that a new market will begin to change hands.
This is because USDC is viewed as a leading funding channel for American investment institutions and investors.
-------------------------------------
(BTCUSDT chart)
(1W chart)
The main question from this week will be whether there is support or resistance near the HA-High indicator on the 1W chart.
The HA-High indicator on the 1W chart was created at 42141.24.
Therefore, if the price is maintained above the 42141.24-43823.59 range, you can be considered to be at the starting line of the major upward trend.
Therefore, it corresponds to a major bull market, that is, a buying period for a full-fledged uptrend.
It is the movement of altcoins that allows us to piecemeal know whether these movements are correct.
All you have to do is check whether the altcoins show signs of rising in unison when they rise above the 42141.24-43823.59 range.
(BTC.D chart)
As mentioned in the USDT explanation above, this decline is expected to last about a month in the short term, so we need to check whether the BTC dominance rises by more than 61% or falls below 50%.
In order for a major bull market to begin, it is expected that BTC dominance must rise by more than 61% and then begin to decline.
This is because it is expected that an altcoin bull market will begin when BTC dominance falls below 50%.
Therefore, if the BTC price maintains the price above the 42141.24-43823.59 range and the BTC dominance rises by more than 61% and then begins to fall, the coin market is expected to begin a major bull market.
A major bull market refers to a bull market in which most coins (tokens) are likely to renew their all-time highs (ATH).
An altcoin bull market refers to a bull market in which you can make a profit no matter which altcoin you buy.
--------------------------------------
It is said that price and volume are important when trading in the stock market, and in fact they are important.
However, trading volume in the coin market has less meaning than in the stock market.
This is because trading volume is spread across multiple exchanges.
Therefore, I believe that transaction volume in the coin market should be judged by the flow of funds.
Therefore, I believe that the gap between USDT and USDC has important implications.
Changes in USDT or USDC due to transactions are expressed as candles.
Therefore, the inflow and outflow of funds is expressed as the occurrence of a gap.
Have a good time.
thank you
--------------------------------------------------
- The big picture
The full-fledged upward trend is expected to begin when the price rises above 29K.
This is the section expected to be touched in the next bull market, 81K-95K.
#BTCUSD 12M
1st: 44234.54
2nd: 61383.23
3rd: 89126.41
101875.70-106275.10 (when overshooting)
4th: 13401.28
151166.97-157451.83 (when overshooting)
5th: 178910.15
These are points that are likely to encounter resistance in the future.
We need to see if we can break through these points upward.
Since it is thought that a new trend can be created in the overshooting zone, you should check the movement when this zone is touched.
If the general upward trend continues until 2025, it is expected to rise to around 57014.33 and then create a pull back pattern.
1st: 43833.05
2nd: 32992.55
-------------------------------------------------- -------------------------------------------
** All explanations are for reference only and do not guarantee profit or loss in investment.
** Trading volume is displayed as a candle body based on 10EMA.
How to display (in order from darkest to darkest)
More than 3 times the trading volume of 10EMA > 2.5 times > 2.0 times > 1.25 times > Trading volume below 10EMA
** Even if you know other people’s know-how, it takes a considerable amount of time to make it your own.
** This chart was created using my know-how.
---------------------------------

Traders Don’t Fail – They QuitIt’s been a very tough year for swing traders.
Go long the market drops. Go short the market rallies.
Don’t do anything and you save from the burn.
But in the bigger scheme of things, it looks like we are in an accumulation phase.
The accumulation phase is a period in which smart money (informed and experienced traders or institutional investors) is believed to be accumulating a particular asset while it is still relatively undervalued.
This phase occurs before a notable uptrend or bullish move in the market.
Key characteristics of the accumulation phase include:
Sideways Movement:
Prices move within a trading range, often forming a base or a consolidation pattern.
The range represents a period of equilibrium between buying and selling forces.
You can see the JSE ALSI has been in a tight range this entire year.
Decreasing Volume:
Volume tends to decline during the accumulation phase, indicating a decrease in overall market activity.
Lower volume signals that the asset is not attracting significant attention from the broader market.
There have not been huge orders on the JSE ALSI like other years. It could be because there are LESS investors buying shares and more going into derivatives and margin trading.
Or because they are worried about the state of the economy with load shedding, foreign direct investments pulling out, the country being rated down or people fleeing the country.
Smart Money Accumulation:
Informed traders or institutional investors quietly accumulate the asset during this phase.
Their accumulation is not typically evident in the overall market activity due to the relatively low volume.
Now with December, we could see investors piling into trades from their bonuses, offsetting taxes, preparing for the next year or with optimism with the festive season.
Transition to Markup Phase:
After a sufficient accumulation, there is an expectation that the asset’s price will break out of the trading range.
This breakout marks the end of the accumulation phase and the beginning of the markup phase, characterized by a sustained uptrend.
So, my hopes and bets are UP.
I think once we break out above the range, we could see the JSE ALSI rally a good 10 -20%.
But geez, we need strong catalysts to kick in.
Even if it’s international markets helping us run up with Dual LIsted companies or America’s leading influence.
What are your thoughts? You think we’ll get our long waited for rally?
Traders and investors who stay in the game will reap the rewards.
Patience is a trader's virtue.
Impatience is the reason why traders quit. They don’t FAIL – THEY QUIT.

Next volatility period: around January 30thHello traders!
If you "Follow" us, you can always get new information quickly.
Please also click “Boost”.
Have a good day.
-------------------------------------
(BTCUSDT chart)
(1W chart)
The HA-High indicator is expected to be created at the 42141.24 point.
Accordingly, the key is whether it can receive support around 42141.24 and rise above 43823.59.
(1D chart)
The key is whether it can receive support around 41350.0 and rise above 42141.24.
If not, and it falls below 39845.44,
1st: 37253.81-38531.90
2nd: 32917.17-34110.32
You need to check if you receive support near the first and second levels above.
The M-Signal indicator and important trend line on the 1W chart are passing near the first section, so it is important to receive support in this section.
It fell below the psychological resistance range of 43160.0-43823.59, falling below the MS-Signal indicator.
And, the MS-Signal indicator has switched to a downward sign.
Accordingly, it has transitioned into a short-term downward trend, but if it receives support around 41350.0 and rises, it is expected that there will be a rebound to convert to an upward trend.
In order for the rebound to turn into an upward trend, the price must be maintained by rising above the MS-Signal indicator.
If it is not supported by the HA-High indicator and falls, there is a high possibility that it will basically touch the HA-Low indicator.
Currently, the RSI indicator has fallen below 50, so if the price falls further, there is a high possibility that a new HA-Low indicator will be created.
It appears that the HA-High indicator on the 1W chart is about to be created at the 42141.24 point, which is a higher point than near the first section where it was expected to be created.
Accordingly, the HA-Low indicator on the 1D chart is also expected to be generated at a higher price than expected.
If the HA-Low indicator appears to be about to be newly created, an important issue is whether support can be obtained in the vicinity.
The next period of volatility is around January 30th.
(4h chart)
However, it is necessary to check which section receives support or resistance after the time indicated on the chart.
The point that forms an important point from a mid- to long-term perspective is the 42283.58 point.
Therefore, the 42283.58 point corresponds to an important volume profile section.
Have a good time.
thank you
--------------------------------------------------
- The big picture
The full-fledged upward trend is expected to begin when the price rises above 29K.
This is the section expected to be touched in the next bull market, 81K-95K.
#BTCUSD 12M
1st: 44234.54
2nd: 61383.23
3rd: 89126.41
101875.70-106275.10 (when overshooting)
4th: 13401.28
151166.97-157451.83 (when overshooting)
5th: 178910.15
These are points that are likely to encounter resistance in the future.
We need to see if we can break through these points upward.
Since it is thought that a new trend can be created in the overshooting area, you should check the movement when this area is touched.
If the general upward trend continues until 2025, it is expected to rise to around 57014.33 and then create a pull back pattern.
1st: 43833.05
2nd: 32992.55
-------------------------------------------------- -------------------------------------------
** All explanations are for reference only and do not guarantee profit or loss in investment.
** Trading volume is displayed as a candle body based on 10EMA.
How to display (in order from darkest to darkest)
More than 3 times the trading volume of 10EMA > 2.5 times > 2.0 times > 1.25 times > Trading volume below 10EMA
** Even if you know other people’s know-how, it takes a considerable amount of time to make it your own.
** This chart was created using my know-how.
---------------------------------

Forex Fundamentals: Building Winning StrategiesForex trading success hinges on a well-defined strategy, as it sets a clear direction and methodology, whether it be scalping, day trading, or another approach. Key to this is understanding the market conditions under which your strategy thrives, as different strategies perform variably across market environments. Employing technical indicators is crucial in providing insights and aiding in decision-making, but they must align with your overall strategy for coherence and effectiveness.
The core of any trading strategy lies in its entry and exit criteria. These criteria ensure disciplined and non-impulsive trading decisions, allowing for entry and exit from the market at the most opportune times. Equally vital is stringent risk management, which protects your capital by defining the risk per trade and setting maximum drawdown limits. In tandem with this, appropriate position sizing mitigates the risk of substantial losses and maintains the health of your trading account.
Backtesting the strategy against historical data is indispensable for understanding its potential effectiveness and challenges. This, followed by forward testing in real-time conditions, often in a demo environment, allows for fine-tuning and adaptation to current market dynamics. Constant adjustments and optimization of your strategy are necessary as financial markets are ever-evolving, and a static strategy is often a recipe for failure.
However, the strategy itself is only part of the equation. The psychological aspect of trading – maintaining discipline and managing emotional responses – is equally critical. Regular performance evaluations and reviews provide insights into the strategy's effectiveness and areas that require improvement, fostering a cycle of continuous learning and adaptation.
In the realm of Forex trading, patience and consistency are not just virtues but necessities. The development, implementation, and refinement of a trading strategy is a meticulous and ongoing process. Success in trading emerges from a disciplined approach, a willingness to learn continuously, and an adaptability to evolving market conditions. It's a journey where each step, from understanding market conditions to psychological resilience, plays a pivotal role in shaping a trader's path to achievement.

Introduction to one of the basic trading methodsHello traders!
If you "Follow" us, you can always get new information quickly.
Please also click “Boost”.
Have a good day.
-------------------------------------
Basic trading method
(How to purchase)
1. Aggressive buying when falling by more than -10%
2-1. Buy when there is an upward trend on the 1D chart (when the price is maintained above the MS-Signal indicator) and when the candle is a downward candle.
2-2. Buy when there is a downward trend on the 1D chart (when the price is maintained below the MS-Signal indicator) and when the candle breaks upward through important support and resistance points.
Therefore, buy when there is a rising candle.
(Selling method)
1. Split sale when it rises by more than +10%
2. Split selling when the high point cannot be renewed
-------------------------------------------------
The basic trading methods introduced above are methods that can be traded even if you are not familiar with chart analysis.
Among these, I will take the time to explain the trading method corresponding to 2-2 of the purchasing method.
You can know the trend based on the MS-Signal indicator on the 1D chart.
Currently, it has fallen below the MS-Signal indicator, and the MS-Signal indicator has been converted to a downward indication.
Therefore, it should be interpreted that there is a high possibility that the current downward trend will continue.
Therefore, in the basic trading method, you should buy when the candle is below the MS-Signal indicator on the 1D chart, that is, when it is in a downtrend.
Therefore, you should buy after confirming that the price breaks above the support and resistance points.
Basically, you can trade using HA-High, HA-Low indicators and box sections.
If you purchased when it fell more than -10% on January 12, you can proceed with a second purchase if it rises above the HA-High indicator.
You can proceed with aggressive buying when the HA-High indicator breaks above the 43450.03 point.
In that case, you will have to sell it in installments when it appears to be rising and then falling.
If you don't like it, you should check for support at 43450.03.
In order to confirm support, it is necessary to check for at least 1-3 days after rising above 43450.03.
Have a good time.
thank you
--------------------------------------------------
- The big picture
The full-fledged upward trend is expected to begin when the price rises above 29K.
This is the section expected to be touched in the next bull market, 81K-95K.
#BTCUSD 12M
1st: 44234.54
2nd: 61383.23
3rd: 89126.41
101875.70-106275.10 (when overshooting)
4th: 13401.28
151166.97-157451.83 (when overshooting)
5th: 178910.15
These are points that are likely to encounter resistance in the future.
We need to see if we can break through these points upward.
Since it is thought that a new trend can be created in the overshooting zone, you should check the movement when this zone is touched.
If the general upward trend continues until 2025, it is expected to rise to around 57014.33 and then create a pull back pattern.
1st: 43833.05
2nd: 32992.55
-------------------------------------------------- -------------------------------------------
** All explanations are for reference only and do not guarantee profit or loss in investment.
** Trading volume is displayed as a candle body based on 10EMA.
How to display (in order from darkest to darkest)
More than 3 times the trading volume of 10EMA > 2.5 times > 2.0 times > 1.25 times > Trading volume below 10EMA
** Even if you know other people’s know-how, it takes a considerable amount of time to make it your own.
** This chart was created using my know-how.
---------------------------------

Charts believed to influence the coin marketHello traders!
If you "Follow" us, you can always get new information quickly.
Please also click “Boost”.
Have a good day.
-------------------------------------
(IXIC chart)
Among the charts that are considered to have an impact on the coin market, the most referenced chart is the NASDAQ index chart.
(NAS100USD chart)
However, since the coin market operates 24 hours a day, you usually see the NAS100USD chart, or futures chart, rather than the IXIC chart.
Since NAS100USD has just renewed its new high (ATH), it is not easy to predict its future movements.
(1M charts)
Accordingly, future movements should be predicted through the Fibonacci retracement ratio.
If you think it has an impact on the coin market, the NASDAQ index chart must maintain an upward trend in order to maintain the upward trend of the coin market anyway.
--------------------------------------------
(DXY chart)
Among the charts that are believed to have an impact on the coin market, there is also the DXY chart.
If DXY maintains an upward trend, it can be interpreted that the investment market is slowly slowing down and is likely to enter a recession.
Accordingly, if it rises above 105.873, it is highly likely that the investment market will enter a recession.
I think it should be maintained below 102.089 for the investment market to become active.
Therefore, if DXY rises, it can be interpreted that the coin market is likely to decline.
Conversely, if DXY falls, it can be interpreted that the coin market is likely to show an upward trend.
----------------------------------------------
(XAUUSD chart)
I think there are many people who see the XAUUSD chart as having an impact on the coin market.
If XAUUSD maintains an upward trend, it can be interpreted that there is a high possibility that the coin market will also maintain an upward trend.
Conversely, if XAUUSD shows a downward trend, it can be interpreted that there is a high possibility that the coin market will also show a downward trend.
(1M charts)
Since XAUUSD is also updating the new high (ATH), it is necessary to make predictions using the Fibonacci ratio.
------------------------------------------------
I don't think it's a good idea to predict the trend of BTC through the charts above, but it's better to check them only as a reference because they are likely to have an impact if many people refer to them.
In order to know BTC price changes, that is, trends in the coin market, you must ultimately understand the flow of funds.
This is because it is highly likely that the trend will ultimately be determined by whether funds are flowing into or out of the coin market.
Therefore, the charts that should be considered more important than the charts above (IXIC, NAS100USD, DXY, XAUUSD) are the USDT and USDC charts.
Stablecoins such as USDT and USDC will play the main role in moving funds.
Among them, USDT can be seen as having a great influence on the coin market because it has the largest number of trading pairs supported by exchanges around the world.
Therefore, it can be interpreted that if USDT continues to maintain its upward gap, the coin market is likely to show an upward trend.
When you trade in the coin market, a candle is created on the USDT or USDC chart.
I believe that when funds flow into or out of the coin market, a gap occurs.
It's a good idea to understand these points and look at the charts.
No matter what you refer to, the trend will ultimately be determined by whether you receive support or resistance at the support and resistance points on the chart of the item, coin, or token you are trading.
Therefore, before looking at the charts above, you must have marked support and resistance points on the 1M, 1W, and 1D charts of the chart you wish to trade.
Since we are traders, not analysts, we only need to create a trading strategy and trade using the support and resistance obtained through chart analysis.
Anything more than that will only end up influencing your subjective thoughts and creating trading strategies in the wrong direction.
Have a good time.
thank you
--------------------------------------------------
- The big picture
The full-fledged upward trend is expected to begin when the price rises above 29K.
This is the section expected to be touched in the next bull market, 81K-95K.
#BTCUSD 12M
1st: 44234.54
2nd: 61383.23
3rd: 89126.41
101875.70-106275.10 (when overshooting)
4th: 13401.28
151166.97-157451.83 (when overshooting)
5th: 178910.15
These are points that are likely to encounter resistance in the future.
We need to see if we can break through these points upward.
Since it is thought that a new trend can be created in the overshooting zone, you should check the movement when this zone is touched.
If the general upward trend continues until 2025, it is expected to rise to around 57014.33 and then create a pull back pattern.
1st: 43833.05
2nd: 32992.55
-------------------------------------------------- -------------------------------------------
** All explanations are for reference only and do not guarantee profit or loss in investment.
** Trading volume is displayed as a candle body based on 10EMA.
How to display (in order from darkest to darkest)
More than 3 times the trading volume of 10EMA > 2.5 times > 2.0 times > 1.25 times > Trading volume below 10EMA
** Even if you know other people’s know-how, it takes a considerable amount of time to make it your own.
** This chart was created using my know-how.
---------------------------------

5 Non Trading Activities to Success…While charts, trends, risk and reward are our daily companions.
Let’s not forget that life’s full of exciting opportunities beyond the trading desk.
We are human at the end of the day.
And you also need to consider extra elements that will help you propel towards success.
Let’s get into the 5 Non trading activities you need to act on.
Healthy Lifestyle: Trading, Eat, Rest, Gym, Repeat!
Who said trading is all about staring at screens and analyzing numbers?
It’s time to inject some energy into your life!
A healthy lifestyle isn’t just about balance sheets; it’s about balance in everything.
You need to take your vitamins, eat healthy, feel great, hit the gym, go for a run, or channel your inner yogi.
The adrenaline rush from trading pairs perfectly with the endorphin high from a good workout.
The healthier you are, the more sharp your mind will be.
And this will get you to think straight and control your emotions better.
Besides, you are what you eat and what you do.
Mindful Meditation: Zen and the Art of Trading
Mindful meditation isn’t just sitting and going OOOHHM….
It’s for all successful entrepreneurs that deal with daily stresses and risks.
Sometimes you just need to take a breather, clear your mind, and get your mind and thoughts in order.
Whether you meditate, do self-hypnosis or just do deep breathing exercises – this will help you to be a more calmer and clearer thinker as a trader.
When you find your inner peace in your mind, it will reflect on your trading and results.
Continuous Learning
Trading is an ever-evolving game, and the most successful players never stop learning.
I’ve read maybe 200 books on trading in my life and I don’t even think that’s nearly enough to learn everything about the markets.
It’s always crucial for you to dive into new strategies, explore market trends, and devour financial news like it’s the hottest gossip in town.
You need to find yourself in the trading journey. This is a self introspection adventure that is forever going.
Stay curious, stay hungry for knowledge, and watch your trading game reach new heights.
Strong Networking: Bulls, Bears, and Bros
Trading might be a solitary endeavor,.
But success is a team sport.
It’s important to build a network that’s as strong as your risk management skills.
Sign up to trading events, courses, books and programmes.
Connect with fellow traders, and remember, it’s not just about what you know; it’s about who you know.
Your next big opportunity might come from a conversation over coffee rather than a chart analysis session.
Time Management: Trade Like a Pro, Live Like a Boss
In the world of trading, time is money.
But beyond the trading hours, master the art of time management in your personal life.
Schedule downtime, enjoy hobbies, and spend quality time with loved ones.
A well-balanced life isn’t just about maximizing profits; it’s about maximizing joy.
Efficient time management is the key to becoming a trading rockstar without burning out.
So, trade smart, live well, and let success be your favorite trend!
FINAL WORDS:
I trust this has given some food for thought.
That trading isn’t just about technical work. It’s also about inner work.
Work on yourself and become the true trader you aspire to.
Let’s sum up the 5 Non Trading Activities to achieve better success.
Healthy Lifestyle: Trading, Eat, Rest, Gym, Repeat!
Mindful Meditation: Zen and the Art of Trading
Continuous Learning
Strong Networking: Bulls, Bears, and Bros
Time Management: Trade Like a Pro, Live Like a Boss

Why Markets Will Always Change – 9 ReasonsThe only thing constant about financial markets is that they change.
And since 2007 or so, with the higher availability of trading different instruments and markets world-wide.
And not to mention, the ability to go long (buy) and go short (sell).
Yes, these everyday possibilities were difficult to find and trade back then.
Now I’m speaking my age in the markets. But it’s important to know, the algorithms are changing the game every single year.
As long as you’re a trader you need to be able to learn, grow, adapt and evolve with every changing markets.
Let’s go into details about WHY the markets are changing…
New and Old Traders (Volume and liquidity)
Traders are the lifeblood of financial markets.
They come in all shades of experience, net worth, strategies and diversity.
Each new trader and investor, brings fresh perspectives, risk appetites, and systems.
And when they execute, it causes a ripple into the market ecosystem.
Similar to the ‘Butter-fly effect’ where one tiny flutter of the wing can cause weather disturbances which could result in a hurricane.
This blend of old and new creates a constant state of flux, volume, liquidity and adds their unique touch to the market canvas.
New Market Information (Local or international)
Information is the bedrock of trading decisions.
In today’s hyperconnected world, news, data releases, and geopolitical events can instantaneously ripple through markets.
Whether it’s an unexpected earnings report, a geopolitical crisis, FOMC or Central Banks decisions, or a technological breakthrough (like AI).
This new information triggers a financial market reaction.
New Micro, Macro, and Fundamentals (Unrelated to charts and price)
Microeconomic factors include things like: individual company performance.
Also think of corporate actions such as mergers and acquisitions. These will also reshape industry landscapes and impact stock prices.
Fundamentals include any internal news related or announcement event that is NOT related to price and volume action on a chart.
While macroeconomic indicators include: GDP growth with money tightening and injection controls.
While Central banks’ decisions on interest rates, inflation rates and monetary policies influence borrowing costs, investment decisions, and market valuations.
These also play a pivotal role in market dynamics.
As these factors evolve over time, they influence market sentiment (how investors feel on what to buy and sell)
And this obviously drives price movements.
World Economic Info (Major changes happening)
Globalization has interconnected economies in ways unimaginable just a few decades ago.
On the one hand we have 6 more countries joining BRICs. Which is showing the political war and dynamic change between the East and the West.
Economic trends in one part of the world can have far-reaching effects elsewhere.
Trade agreements, currency fluctuations and Forex wars, and shifts in supply chains impact various sectors and industries.
And this can also lead to a change in market price, volume and conditions.
Also, when one event kicks in there is a domino effect.
And this can trigger a cascade of events that reverberate across financial markets worldwide.
Sentiment (How the overall feeling is)
Psychological factors like fear, greed, and uncertainty can drive sudden market movements.
Market sentiment is often reflected in buying and selling volumes.
When investors and traders are feeling optimistic and positive – they buy and hold.
When they are feeling down and negative (about positions) – they sell and short.
High volume with buying or selling can indicate strong conviction – for other investors.
While low volume might signify uncertainty.
This ebb and flow of market participation led to constant changes in market trends and patterns.
Then there are other reasons that financial markets are constantly changing including:
Technological Advancements (At an accelerating rate)
As the world evolves and technology compounds at unprecedented levels, we will see innovations in:
Trading platforms
Algorithms
new instruments & markets
high-frequency trading
New AI related trading bots
Better chart pattern recognition plugins
Improved automatic trading developments.
And emerging technologies can change existing business models in a way they can make them obsolete to totally transform them.
These will all influence market behaviour of demand and supply with investors and traders.
Which will cause a shift and change in price and volume.
Regulatory Changes (Boring but inevitable)
Also, rules.
Rules, regs and legs are always updating and changing.
This will also alter trading practices, liquidity, price movement and market structure.
Political Uncertainty (Fun times ahead for the world)
The rate the world is separating and joining forces in all different ways, there is change coming to the financial markets.
With the EU having control over 27 countries economies.
With BRICs adding another 6 countries to theirs.
With other countries breaking away from the US dollar.
While other companies and countries are switching and adopting more to crypto and AI.
The very foundation of politics and control is changing under our very eyes.
And this will definitely have a major shift in economic directions as well as on the markets.
Natural Disasters and health disasters (Brace yourself and keep your masks)
From Global Warming, to less resources available to mind.
From catastrophic events, floods and droughts.
These can all disrupt supply chains, impact production, and affect the prices of commodities and goods.
And then financial markets and prices, will all be affected.
And what about pandemics?
If we have another COVID-19 type event, this will once again create rapid shifts in consumer behaviour.
And this will have a major impact and ripple throughout companies, industries, countries and essentially the world markets.
FINAL WORDS:
You can clearly see, why financial markets will always change.
And as markets continue to shift and adapt, the only constant is change itself.
So it’s our job to adapt or die.
Embrace it, learn from it, love it and enjoy the process along the way.
It means, this journey and income generating source will NEVER get boring.
It can ONLY get better (well we can be optimistic to think that).
Let’s sum up why the financial markets landscape will always change…
New and Old Traders (Volume and liquidity)
New Market Information (Local or international)
New Micro, Macro, and Fundamentals (Unrelated to charts and price)
World Economic Info (Major changes happening)
Sentiment (How the overall feeling is)
Technological Advancements (At an accelerating rate)
Regulatory Changes (Boring but inevitable)
Political Uncertainty (Fun times ahead for the world)
Natural Disasters and health disasters (Brace yourself and keep your masks)

The key is whether the four-year cycle pattern can be continuedHello traders!
If you "Follow" us, you can always get new information quickly.
Please also click “Boost”.
Have a good day.
-------------------------------------
A new 1-year candle will now be created.
Accordingly, we will take the time to talk about next year's movements with the 12M chart.
--------------------------------------
We continually say that you cannot create a trading strategy based solely on the information gained from chart analysis.
Therefore, you must use the information obtained from chart analysis to suit your trading strategy.
Currently suitable coins for long-term investment are BTC and ETH.
The next coins that are seen as expanding the coin ecosystem are BNB,
Among these, the coins that must be traded by increasing the number of coins held for profit are BNB, XRP, ADA, TRX, KLAY, OP, and WEMIX coins.
The coins mentioned above are representative coins that form the coin ecosystem.
By checking the coins (tokens) included in this coin ecosystem, you can select additional coins in addition to BTC and ETH to continue investing in the mid- to long-term.
It does not matter if the number of items (coins, tokens) that increase the number of coins (tokens) held for profit is large, so you need to think about this.
Increasing the number of coins (tokens) held corresponding to profit means selling the coins (tokens) corresponding to the purchase amount and leaving the number of coins (tokens) corresponding to the profit, so if you sell the amount equal to the purchase amount, the average purchase price is 0.
Trading in this way is possible because the coin market allows trading in decimals.
Therefore, if you trade in the coin market the same way you traded in the stock market, you may feel confused and need to rewrite your trading strategy for the coin market.
-----------------------------------------
#BTCUSD 12M
The key question is whether the four-year cycle pattern that started in 2014 can continue this time.
It displays the Fibonacci ratio formed in the upward trend that started in 2015.
The Fibonacci ratio formed in the upward trend that started in 2019 is displayed.
If the 3.618 point of the Fibonacci ratio in the uptrend that started in 2015 is applied to the Fibonacci ratio in the uptrend that started in 2019, the 3.618 point is the 178910.15 point.
Therefore, the key question is whether it can rise above 1.618 percentage points, or 89126.41 points, next year.
Since there is no guarantee that movement will continue according to the past pattern cycle, we must respond according to the situation.
Since it has currently touched the 44234.5 point, which is the 0.618 percentage point, if there is a price adjustment before it rises, it is necessary to check if it is supported around 38937.30, which is the 0.5 percentage point.
Next, we need to see if it can rise above the 2.618 percentage point, which is 134018.28.
End 2023 well, and have a happy new year in 2024.
--------------------------------------------------
- The big picture
The full-fledged upward trend is expected to begin when the price rises above 29K.
This is the section expected to be touched in the next bull market, 81K-95K.
-------------------------------------------------- -------------------------------------------
** All explanations are for reference only and do not guarantee profit or loss in investment.
** Trading volume is displayed as a candle body based on 10EMA.
How to display (in order from darkest to darkest)
More than 3 times the trading volume of 10EMA > 2.5 times > 2.0 times > 1.25 times > Trading volume below 10EMA
** Even if you know other people’s know-how, it takes a considerable amount of time to make it your own.
** This chart was created using my know-how.
---------------------------------

Learn Profitable Doji Candle Trading Strategy
In the today's post, I will share my Doji Candle trading strategy.
This strategy combines the elements of multiple time frame analysis, price action and key levels.
Step 1
Analyze key levels on a daily time frame.
Identify vertical and horizontal supports and resistances.
Here are the key structures that I spotted on on AUDUSD.
Step 2
Look for a formation Doji Candle on a key structure.
This rule is crucially important: we will trade only the Doji candles that are formed on key levels.
From key supports, we will look for buying, and we will look for shorting from key resistances.
Look at this Doji Candle that was formed on a key daily support on AUDUSD.
Step 3
Look for a horizontal range on a 4h/1h time frames.
Doji Candle signifies indecision. Quite often, you will notice the horizontal ranges on lower time frames when this candlestick is formed.
Here is a horizontal range that was formed on a 4H time frame on AUDUSD after a formation of Doj i.
Step 4
Look for a breakout of the range.
To sell from a key resistance, we will need a bearish breakout of the support of the range. That will be our bearish confirmation.
To buy from a key support, we will need a bullish breakout of the resistance of the range. It will be our bullish signal.
Here is a confirmed breakout of the resistance of the range with a 4H candle close above. That is our bullish confirmation on AUDUSD.
Step 5
Buy aggressively or on a retest.
After you spotted a confirmed breakout of the range, open a trading position aggressively or on a retest.
Personally, I prefer trading on a retest.
If you sell, a stop loss should be above the high of the range and your target should be the closest key daily support.
If you buy, your stop loss should be below the low of the range and a take profit will be on the closest daily resistance.
On AUDUSD, a long position was opened on a retest. Stop loss is lying below the lows. Take profit is the closest resistance.
Here is how the great strategy works!
Always patiently wait for a confirmation! That is your key to successful trading Doji Candle.
❤️Please, support my work with like, thank you!❤️

WHAT ARE Fakeouts, Shakeouts and Whipsaws?YOUR QUESTION ANSWERED!
What on earth are Fake outs, Shake outs and Whipsaws?
After this you will know…
Fake-out:
(When the price makes a false breakout of a chart pattern)
A fake-out occurs when the price of a market appears to break out of a certain chart pattern.
This could be a trendline, support, or resistance level.
But then quickly reverses and retreats back within the pattern.
Shake-out:
(Where the market is highly volatile and the price moves to levels that hits their stop losses and gets traders out of their trades)
A shake-out is a scenario where the market becomes highly volatile and the price moves rapidly to levels that trigger the stop-loss orders of many traders.
Stop-loss orders are pre-set risk levels at which traders automatically exit their positions to limit their losses.
A shake-out is designed to “shake out” weak or inexperienced traders from the market.
When stop-loss orders are triggered, it can create a temporary spike in the opposite direction of the prevailing trend.
Once these traders are “shaken out,” the market might resume its original trend.
You’ll see this most commonly with low liquid, high volatile markets like Penny Stocks or Penny Cryptos.
Whipsaw:
(This is where the market will change its most prominent direction within the day).
Whipsaw refers to a situation where the market quickly changes its direction within a relatively short period, often during a single trading day.
This can cause confusion and losses for traders who are caught off-guard.
Whipsaws can occur due to various factors, such as sudden news releases, economic data surprises, or changes in sentiment.
They are characterized by sharp price movements that can make it difficult to make accurate trading decisions.
Whipsaws are especially common during periods of high market uncertainty or when there’s a lack of a clear trend.
Let’s create a quick summary of the three:
Fake-out:
(When the price makes a false breakout of a chart pattern)
Shake-out:
(where the market is highly volatile and the price moves to levels that hits their stop losses and gets traders out of their trades)
Whipsaw:
(This is where the market will change its most prominent direction within the day).
If you have any trading question let me know in the comments

The key is whether it can rise to the second resistance zoneHello traders!
If you "Follow" us, you can always get new information quickly.
Please also click “Boost”.
Have a good day.
-------------------------------------
#BTCUSDT 1W
It has risen by more than 64% and is showing resistance around the 43823.59 point for the fourth week.
Accordingly, if this week's candle fails to close higher than 43823.59, there is a possibility of a downward trend.
Looking at the 1W chart, the transition to a downtrend is expected to occur when the price falls below 37253.81-38531.90.
Until then, it is expected that price adjustments will create a pull back pattern.
Therefore, the key is whether it can rise to the 45135.66-46431.5 range.
(1D)
It rose to the psychological resistance range of 43160.0-43823.59.
Accordingly, the key is whether it can receive support and rise in the 43160.0-43823.59 range.
If it fails to rise and falls below 41350.0, it is highly likely that it will turn into a short-term downtrend, so a countermeasure is needed.
However, as I mentioned in the explanation of the 1W chart, there is a high possibility of creating a pull back pattern above the 37253.81-38531.90 range, so we need to consider this and create a response strategy.
If it rises beyond the second resistance range of 44200.0-47600.0, the next resistance range is 53256.64-45150.01.
Accordingly, it is necessary to check whether it can rise above the secondary resistance zone between around January 1st and around January 5th, which is the period of small volatility, and around January 16th, which is the main volatility period.
If it is to fall, a sharp drop must necessarily occur.
If a sharp drop occurs, it is likely to touch around 32917.17-34110.32.
If that happens, it is expected to quickly rise to around 37253.81-38531.90, so it is expected to be a time for aggressive buying.
Have a good time.
thank you
--------------------------------------------------
- The big picture
The full-fledged upward trend is expected to begin when the price rises above 29K.
This is the section expected to be touched in the next bull market, 81K-95K.
#BTCUSD 12M
1st: 44234.54
2nd: 61383.23
3rd: 89126.41
101875.70-106275.10 (when overshooting)
4th: 13401.28
151166.97-157451.83 (when overshooting)
5th: 178910.15
These are points that are likely to encounter resistance in the future.
We need to see if we can break through these points upward.
Since it is thought that a new trend can be created in the overshooting area, you should check the movement when this area is touched.
If the general upward trend continues until 2025, it is expected to rise to around 57014.33 and then create a pull back pattern.
1st: 43833.05
2nd: 32992.55
-------------------------------------------------- -------------------------------------------
** All explanations are for reference only and do not guarantee profit or loss in investment.
** Trading volume is displayed as a candle body based on 10EMA.
How to display (in order from darkest to darkest)
More than 3 times the trading volume of 10EMA > 2.5 times > 2.0 times > 1.25 times > Trading volume below 10EMA
** Even if you know other people’s know-how, it takes a considerable amount of time to make it your own.
** This chart was created using my know-how.
---------------------------------

Meaning of buying when falling and selling when risingHello traders!
If you "Follow" us, you can always get new information quickly.
Please also click “Boost”.
Have a good day.
-------------------------------------
#BTC.D 1D
#USDT.D 1D
#BTCUSDT 1D
I think the Renko chart is a chart that can somewhat complement fakes and whipsaws.
This chart allows you to see at a glance which section the trend or current price position is contained in.
Looking at this chart, I think it can be broadly divided into two sections.
The current price is in the 36000-43500 range.
In that range, support and resistance areas are formed between 39000 and 40500.
Therefore, if it fails to rise above 43500, I think there is a possibility of touching the 39000-40500 range.
For signs of decline to appear, it must fall below 42000.
Additionally, the upper line of the Price Channel indicator will be created.
BTC dominance is falling to around 50.
Accordingly, the possibility of fakes or whipsaws occurring in BTC volatility is increasing.
Therefore, I think you should not react sensitively to BTC movements until there is a clear movement.
A decline in BTC dominance means that funds are moving away from BTC and towards altcoins.
Therefore, if you react sensitively to BTC movements, you may proceed with trading in the wrong direction, so caution is required.
#USDT 1D
In order for the coin market to turn into a downward trend, it must be accompanied by an outflow of funds.
Otherwise, I don't think there could ever be a downward trend.
The representative stablecoin for fund inflow and outflow in the coin market is USDT.
Therefore, if the USDT chart begins to show a gap decline, then I think there will be a higher possibility that the coin market will turn into a downward trend.
However, since we need to check the correlation between the movement of USDT dominance and BTC dominance, if there are signs of a downward trend, then we will tell you again.
As it fails to renew the high point on the general candle chart and touches the 42K range, it seems that talk of a gradual decline is starting to emerge.
If the price starts to fall, it is expected that more funds will flow into the coin market, leading to more purchases.
If you look at the current USDT chart, you can see that funds are continuously flowing into the coin market due to the rising gap.
Therefore, now is the time to buy.
It is possible to sell some of your coins (tokens) in installments to prevent losses, but if the price falls, you must repurchase them again.
Because the gap between the short-term moving average line and the mid- to long-term moving average line is large, fatigue from the upward move is high.
So, the market is naturally trying to correct prices.
However, if you reduce the number of coins (tokens) you hold by selling in a situation where funds are continuously flowing into the coin market, you may regret it a lot in the future, so you need to be careful in responding.
If you currently have some cash reserves, you will have a good opportunity to buy more when a price correction occurs.
If you think your cash holdings are low, you should secure cash by selling the coins (tokens) you currently hold that have either converted to a loss or are likely to record a loss.
When a price adjustment occurs with the cash secured in this way, the average purchase price must be lowered and the number of coins (tokens) held must be increased by repurchasing.
BTC's 43160-43823.59 range is a psychological split selling range.
Therefore, in order to reduce the upward fatigue that has risen to the 43160-43823.59 range, it is recommended to secure profits by selling in installments.
In that sense, split selling when it falls below 42053.66 can be considered a stop loss.
There is a big difference between split selling when the price rises to the 43160-43823.59 range and can no longer reach the high point, and split selling at the point where the downtrend is likely to begin.
First of all, there is a big psychological difference.
When the price rises and you can no longer reach the high point, you sell it in installments, and you feel psychologically relieved that you have succeeded.
This relief gives you the power to buy back again when the price falls, creating a pull back pattern.
However, if you split and sell with a stop loss, even if the price falls and shows a pull-back pattern, you will hesitate to repurchase due to psychological anxiety about further decline.
In addition, since the stop loss point and the area that creates the pull back pattern are likely to be close, you will be more hesitant to repurchase.
That location is the current location, 42053.66-42278.03 section.
If it falls from this range, it will hit the support and resistance range of 39845.44-42053.66.
However, the important support and resistance point for this decline is the 41350.0 point.
Therefore, there is a high possibility that the price will shake up and down around the 41350.0 point.
Since this fluctuation is likely to lead to an upward trend during the volatility period around January 1-5, choosing to sell the split at the current price can be considered risky.
You should buy when prices fall and sell when prices rise.
This is one of the most basic trading strategies in trading.
However, these basic trading strategies are not followed.
Buying when the price is falling means buying when the price is falling and moving sideways within a certain range or showing support at a certain point.
Therefore, through chart analysis, you must select the corresponding support and resistance points or sections and check the price movement.
Selling when the price rises means selling when the price rises and can no longer reach the high point or shows sideways movements within a certain range.
You may think that chart analysis is a very important part of trading, but this is not true.
Chart analysis is just one part of trading, the most important thing is trading strategy.
This is because the success or failure of a trade depends on how you create your trading strategy.
trading strategy
1. Investment period
2. Investment size
3. Trading method and profit realization method
You can think about it by dividing it into parts 1-3 above.
Step 3 involves creating a trading strategy by checking the information learned from chart analysis, that is, price movements at support and resistance points or sections.
This means that steps 1 and 2 are very important in creating an actual trading strategy.
The first thing you need to do is decide which coin (token) to invest in, for what period of time, and at what size of investment.
To do this, you need to step away from the chart for a moment and check the ecosystem of the coin (token) you want to trade or check aspects such as community scalability.
Next, analyze the chart to see how support and resistance points or zones are formed at the current price position.
You must create a trading strategy based on the confirmed information and proceed with trading.
However, as you invest all your time in chart analysis and create all kinds of scenarios in your head with that information, you add your own subjective thoughts and psychological factors, which causes trading to proceed in the wrong direction.
Therefore, chart analysis should be done with as objective information as possible.
In order to exclude your subjective thoughts and psychological factors from this objective information, appropriate indicators must be set in the chart.
Otherwise, your subjective thoughts and psychological factors will eventually be included in the chart analysis without your knowledge.
I believe trading should be done by trend following.
However, trends may vary depending on your perspective.
Therefore, there is no need to criticize or call out anyone else's thoughts for being different from mine.
This is because the investment period is different depending on your perspective.
One thing I would like to say here is that when looking at trends, if possible, you should first check the trend in a time frame longer than a 1D chart.
If you always trade with the trend of the time frame chart below the 1D chart, there is a high possibility of making a mistake due to fake or whipsaw.
Therefore, before starting a new trade, you should check the trends on the 1M, 1W, 1D charts and mark the support and resistance points on these time frame charts on the charts.
Then, by looking at the time frame chart that you mainly view and trade, check the movement at the corresponding support and resistance points and proceed with the transaction, you will be able to reduce the number of times you are caught by fakes or whipsaws.
--------------------------------------------------
- The big picture
The full-fledged upward trend is expected to begin when the price rises above 29K.
This is the section expected to be touched in the next bull market, 81K-95K.
-------------------------------------------------- -------------------------------------------
** All explanations are for reference only and do not guarantee profit or loss in investment.
** Trading volume is displayed as a candle body based on 10EMA.
How to display (in order from darkest to darkest)
More than 3 times the trading volume of 10EMA > 2.5 times > 2.0 times > 1.25 times > Trading volume below 10EMA
** Even if you know other people’s know-how, it takes a considerable amount of time to make it your own.
** This chart was created using my know-how.
---------------------------------

Bitcoin Futures: A Quantitative Approach to Analyzing BTCIntroduction to Bitcoin Futures
Bitcoin, the pioneering digital asset, has carved a niche in the financial markets with its futures contracts. Bitcoin Futures provide traders and investors a regulated avenue to speculate on the price of Bitcoin without holding the actual cryptocurrency. This article delves into a quantitative analysis to analyze the next week's potential value of Bitcoin Futures, employing a sophisticated Neural Network model.
Current Market Landscape
The Bitcoin market is known for its rapid price movements. Recently, regulatory news, technological advancements, and shifts in investor sentiment have contributed to market fluctuations. Understanding these trends is crucial for traders looking to navigate this dynamic landscape.
Quantitative Analysis of BTC Futures' Potential Price Movements
Neural Networks & Machine Learning: At the heart of our quantitative approach is a Neural Network model. This model has been trained on historical weekly data of Bitcoin Futures, including key price points and other relevant market indicators.
Data Preprocessing: To ensure accuracy, the data underwent rigorous preprocessing, including normalization to make it suitable for the Neural Network. This step is essential in highlighting the true patterns and trends in the data without noise or scale issues distorting the model's view.
Model Training: Our model was trained over 500 iterations, adjusting its internal parameters to minimize prediction error. This training process involved feeding the model historical data and letting it learn from the actual price movements.
Evaluation and Prediction: After training, the model's performance was evaluated. The actual prices were compared against the model's predictions to assess robustness. This evaluation is crucial in understanding the model's reliability.
Impact of External Factors
Bitcoin Futures are affected by a range of external factors, including regulatory changes, market sentiment, and technological developments. These factors can cause sudden and unpredictable market movements, making the analysis of future potential prices challenging. Our model takes into account the historical impact of these factors, but it's important to remember that unforeseen future events can lead to deviations from predicted values.
Forward-Looking Market Views
Based on our Neural Network's learning and the recent market data, the model predicts that the value of Bitcoin Futures for the next week will be around "$44,026.60". This prediction is visualized in our graph comparing actual prices against predicted values over time, providing a clear view of the model's accuracy.
Given the fact that the current value of BTC is slightly under 43,000, a trader could plan a long trade targeting 44,026.60 as their exit price. Entries could be taken in many ways such as utilizing key technical supports or waiting for breakouts above key resistance price levels. In all cases, a professional approach to taking risk in the marketplace always require managing such risk using stop-loss orders and making sure the trade size has been pre-calculated. There are many more options on how to have a contingency plan in place in case BTC moved in the opposite direction our AI expected it to. More on this in future articles.
The model's learning curve, depicted in the accuracy graph, shows how the prediction accuracy improved over training iterations, reflecting the model's increasing proficiency at understanding the market.
Conclusion
Our quantitative analysis, utilizing a sophisticated Neural Network model, provides a prediction for the next week's value of Bitcoin Futures. While this prediction is grounded in historical data and advanced algorithms, it's important for traders to consider the inherent volatility and unpredictability of the Bitcoin market. The predictive model is a powerful tool, but it should be used as part of a broader strategy that considers market news, economic reports, and other indicators.
When charting futures, the data provided could be delayed. Traders working with the ticker symbols discussed in this idea may prefer to use CME Group real-time data plan on TradingView: www.tradingview.com This consideration is particularly important for shorter-term traders, whereas it may be less critical for those focused on longer-term trading strategies.
General Disclaimer:
The trade ideas presented herein are solely for illustrative purposes, forming a part of a case study intended to demonstrate key principles in risk management within the context of the specific market scenarios discussed. These ideas are not to be interpreted as investment recommendations or financial advice. They do not endorse or promote any specific trading strategies, financial products, or services. The information provided is based on data believed to be reliable; however, its accuracy or completeness cannot be guaranteed. Trading in financial markets involves risks, including the potential loss of principal. Each individual should conduct their own research and consult with professional financial advisors before making any investment decisions. The author or publisher of this content bears no responsibility for any actions taken based on the information provided or for any resultant financial or other losses.

Volatility Period: Around December 18-25Hello traders!
If you "Follow" us, you can always get new information quickly.
Please also click “Boost”.
Have a good day.
-------------------------------------
(BTCUSDT chart)
(1W chart)
This period of volatility is expected to be between December 18th and 25th.
At this time, the key is whether it can rise above 45135.66.
If not, you should check whether a new HA-High indicator is created as it falls around 37253.81-38531.90.
(1D chart)
What you need to look at during this volatility period is whether it falls below the 39845.44-42053.66 range or rises above the 43823.59-45135.66 range.
Even if there is no major change in BTC's movement, what is important for now is whether BTC dominance can stop sideways and form a trend.
(BTC.D chart)
Currently, BTC dominance is located around 53.
Accordingly, I think the key is whether it falls below 50 or rises above 54.
This is because I believe that in order to create an altcoin bull market, BTC dominance must fall below 50 and USDT dominance must remain below 5.89.
(USDT chart)
I believe that funds are continuously flowing in through USDT.
(USDC chart)
In addition, USDC is also showing sideways movements, forming a box section.
I believe that this funding situation is sufficient grounds for volatility in the coin market.
In order to form a trend in the coin market, it usually begins with significant volatility.
Therefore, if significant volatility occurs during this period of volatility, a trend is expected to occur in either direction.
However, in order for the price to turn into a downward trend, it must fall below 39845.44 and show resistance.
If it shows support in the 37253.81-38531.90 range, it is expected that it will not be easy to turn into a downward trend as there is a possibility of creating a pull back pattern.
--------------------------------------------------
- The big picture
The full-fledged upward trend is expected to begin when the price rises above 29K.
This is the section expected to be touched in the next bull market, 81K-95K.
-------------------------------------------------- -------------------------------------------
** All explanations are for reference only and do not guarantee profit or loss in investment.
** Trading volume is displayed as a candle body based on 10EMA.
How to display (in order from darkest to darkest)
More than 3 times the trading volume of 10EMA > 2.5 times > 2.0 times > 1.25 times > Trading volume below 10EMA
** Even if you know other people’s know-how, it takes a considerable amount of time to make it your own.
** This chart was created using my know-how.
---------------------------------

5 TRADING PROTECTION LEVELS - NB*REMEMBER
Every trader needs 5 protection levels.
Stop loss to stop yourself from furthering losses
Time stop loss to get you out of non-performing trades
Adjusted stop loss to lock in profits when the market moves in your favour.
Risk % per trade to only lose a certain amount of your portfolio
% of Drawdown before you HALT trading - when the market is not in a favourable environment to your strategy.
These are the control factors to manage your portfolio with better direction and management.
What other protection levels do you apply?

The 12 Dangers of Trading DoubtDoubt is danger.
It’s a big enemy for trading.
And it’s something that is innate, which is hard to escape from.
It leads to you to miss opportunities, destroys confidence, clouds judgement and keeps you stuck in a rut.
When you are infected with doubt, this can infiltrate even the most experienced traders.
This article delves into the various dangers of trading doubt and how to overcome its destructive effects.
Missed Opportunities
When doubt creeps in, traders often find themselves hesitating or second-guessing their decisions.
Once you feel hesitation, you’ll miss great opportunities.
Winners will be left on the table.
All because you doubt it’ll go your way and that the markets are conducive.
If you want to stop the doubt you need to act swift and make decisions within three second.
1, 2, 3 – ACT!
Loss in Confidence
Without confidence, you’re going to doubt.
You’re going to question your skills, strategies, and abilities.
As confidence dwindles, you’re going to feel strong fear, panic and worry.
This will lead to irrational decisions driven by emotions rather than logic, rationality and sound analysis.
Change Your System
Even if you have a winning system.
Doubt could cause you to abandon it.
You might already be thinking of finding another.
Looking for better parameters.
Adding extra elements and variables.
This constant tinkering will prevent you from fully realizing the potential of their proven trading strategy and approach.
This is a time game. Not a week, not a month. Noth even three years.
Your trading success will come from being consistent, persistent and consistently applying a well-defined strategy over time.
Search for “Better”
You might even doubt trading all together.
You might have lost a bit of money and now you have this desire to make it back.
So you’ll look into gambling, sports betting, Amway or any other scheme instead.
But you’ll most likely be disappointed. Because everything worth doing well for reward, consists of elements of risk and time.
Don’t Take the Trade
Your finger could be between three stone walls.
Or your finger could be 1 mm from the button.
If you have doubt with your trades, this will paralyse you to enter a trade.
This hesitation will lead you to:
Miss trades
Miss profits
Interfere with the system
Lose confidence
Exacerbate panic and fear
This will only set a precedent for you to do it again.
It’s a bad habit that can destroy you as a trader.
Don’t Follow Criteria
Doubt can lead to a disregard your essential rules.
You might:
Get in at different levels
Move your stop loss further away
Close prematurely for tiny profits or
Take a trade that does NOT match the criteria.
If you question the trading validity of your criteria, this will turn you into an undisciplined and unsuccessful trader.
Overtrading
Once doubt sets in – so will mania.
And to break away from doubt, you take on a dangerous path.
In an attempt to overcome doubt, you might start overtrading or revenge trading.
This is where you’ll enter too many trades in quick succession, without following any criteria.
Emotional Roller Coaster
Doubt is not just feeling lazy.
It actually comes with feelings of frustration, anxiety, and self-doubt dominating their thought process.
This emotional turmoil can cloud judgment and lead to reactive rather than rational decision-making.
Analysis Paralysis
When doubt takes hold, this is where you might go all out with indicators, parameters and price action elements.
This will lead you to excessive analysis.
You’ll continuously seek more information before making a decision.
This analysis paralysis can cause a couple of issues.
It can overcomplicate trading
It makes back and forward testing almost impossible
The variables can cause conflict with each other.
Your charts will look like Christmas trees
This can lead you to miss trading opportunities and an inability to take action.
Inconsistent Results
Consistency is key in trading success.
Doubt-driven decisions can lead you to inconsistent results.
You’ll have your journal with how the trades were SUPPOSED to go.
Versus how you made them go.
And this will make it challenging to gauge the effectiveness of a trading strategy over the long term.
Psychological Toll
Doubt is a constant battle.
If you have this, it will infect your mind it will take a toll on your mental well-being.
It can lead to stress, burnout, and even health issues if you don’t fix them.
Loss Aversion
Doubt can cause a psychological bias known as loss aversion.
This is where traders become will focus to avoid losses rather than maximise their gains.
This mindset can hinder traders from taking necessary risks to achieve substantial profits.
Focus on cutting small losses and banking small profits and you’ll have a recipe for disaster.
It’s time to build your confidence
This will come from working on a trading journal, risking less and building a track record.
Over time, the doubt will creep away and the certainty will override.
Let’s some up the elements of doubt for a trader…
Missed Opportunities
Loss in Confidence
Change Your System
Search for “Better”
Don’t Take the Trade
Don’t Follow Criteria
Overtrading
Emotional Roller Coaster
Analysis Paralysis
Inconsistent Results
Psychological Toll
Loss Aversion

SAND/USDT Trading IdeaBelow is a trading idea for the SAND/USDT pair.
Since the beginning of October, this asset has shown a consistent upward trend. Starting at $0.2739 and reaching a current high of $0.5970 , it has grown by more than 114% . The trend line, acting as support, confirms continued interest from buyers in this coin, having held up through three significant approaches. Currently, the asset is undergoing a correction after hitting a local price peak.
The idea is to consider buying the asset if the price drops below the Value Area High and approaches the level close to the support trend line.
The trend's stability is confirmed by the continuation of the upward movement after the correction from the local peak, accompanied by noticeable increases in trading volumes. After entering a position, the first target is considered to be $0.5992, with the second target at $0.7178.

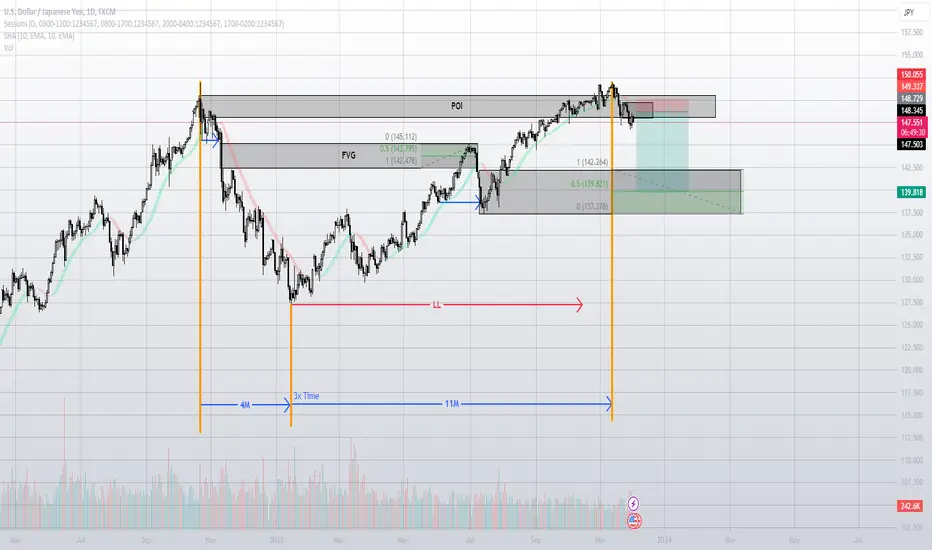
Short USDJPYLong term short position, explanation shown! The price is in a strong Short POI, I used external ExpertAdvisors, available only for mt5, and indicators, including LVL2 data. Not investment advice!!!!
Short position is placed on the chart for illustrative purposes only! Always Analyze and look for your own entry, don't blindly follow anyone!
Significance around 43823.59Hello traders!
If you "Follow" us, you can always get new information quickly.
Please also click “Boost”.
Have a good day.
-------------------------------------
(USDT chart)
It has risen above the high point on November 8th.
I think this is evidence that a lot of money is flowing into the coin market.
(USDC chart)
It looks like it's about to turn, but it doesn't look like it's about to rise yet.
(BTC.D chart)
Among the conditions for an altcoin bull market to begin is whether BTC dominance can be maintained by falling below 50.
Therefore, I think it is difficult to say that the current altcoin bull market has begun.
An altcoin bull market refers to a bull market in which you can make a profit no matter what altcoin you buy.
(USDT.D chart)
As USDT dominance falls below 5.89-6.39, I believe the coin market has entered a bull market.
If the BTC Dominus mentioned earlier does not fall below 50, it is highly likely that a bull market will continue in which only BTC will rise.
Although some altcoins, including ETH, will rise along with BTC, it is expected that they will ultimately not be able to keep up with BTC's rise.
If only BTC rises, BTC's dominance is likely to continue until BTC dominance rises above 61 and then begins to decline, so caution is required when trading altcoins.
--------------------------------------------------
(BTCUSDT chart)
(BTCUSD 1M chart)
The HA-Low indicator has not yet been created on the 1M chart.
This shows that BTC is maintaining a strong upward trend.
Therefore, it is expected that a new trend will be formed by touching the HA-High indicator this time.
If the price falls after receiving resistance from the HA-High indicator, I think there is a possibility that it will eventually lead to a decline to meet the HA-Low indicator.
Currently, it is unknown how much it will have to drop to generate the HA-Low indicator.
However, if the downward trend continues, we believe we will eventually reach the HA-Low indicator.
If it rises above the HA-High indicator, it is likely to rise to around 47995.77-48229.91.
The 47995.77-48229.91 section corresponds to the section located between 0.618 and 2.618 of the Fibonacci ratio.
(1W chart)
The HA-High indicator on the 1M chart has been touched, but the HA-High indicator on the 1W chart has not been touched yet.
Accordingly, I think there is a possibility of a shakeup around 43823.59.
Looking at the situation of the indicator, it can be thought that BTC is still in the reverse arrangement because the HA-High indicator on the 1M chart was touched first.
I think there is a possibility that a shaker will be developed to convert this reversed arrangement state to a normal arrangement state.
Well, there is a possibility that it will rise like this and rise to the 59370.07 point, which is the HA-High indicator point on the 1W chart.
In any case, it is true that it is located in an important section in terms of the current long-term trend.
There is a possibility that it will touch the 46431.5 point and a shake will occur, or there is a possibility that it will continue to decline and a shake will occur.
At this time, we need to find out the funding status of the coin market.
As explained in the USDT chart mentioned earlier, you can see that funds are steadily flowing into the coin market.
Accordingly, even if there is a shake-up, I don't think it is very likely to lead to a major decline.
However, I think the situation is a bit different for altcoins.
Altcoins are likely to see a big drop since BTC dominance is trending upward.
It is unknown whether the current inflow of funds is to buy BTC, ETH, or altcoins.
However, given that BTC dominance is on the rise, I think there is a possibility that it is an inflow of funds to buy BTC or ETH.
(1D chart)
BTC is resetting the indicator as it shows sideways movements around 43K.
Currently, the StochRSI indicator is showing a decline below the 50 point.
Therefore, when the StochRSI indicator enters the oversold zone in the near future, you should pay attention to where support and resistance are located.
When the decline in the StochRSI indicator accelerates, it is necessary to check whether BTC is maintained within the 42053.66-44200.0 range.
If possible, the key is whether the price can be maintained around 43160.0-43823.59.
I think it is highly likely that this means that there is a great desire for an increase and that buying is overwhelming selling.
As funds are flowing into the coin market, I do not think it is right from a trend-following perspective to think that the rise will stop around the current level.
This is because it is highly likely that the inflow of funds will ultimately result in an increase in the purchasing power of coins.
why? I shared my thoughts on whether the prices in the current section are showing the same behavior as they are now.
It is unknown whether this will lead to an altcoin bull market or whether BTC's dominance will continue as is.
However, if BTC dominance falls below 50, you need to think about the possibility of an altcoin bull market starting and think about how to respond.
However, since there may be a pumping of altcoins before BTC determines its direction and leads to a large rise, a trading strategy must be created accordingly.
Once an altcoin bull market begins, I think chart analysis is meaningless.
Therefore, it is recommended to sell in installments when prices rise sharply and come to a halt.
Additionally, it is time to buy if the candle on the 1D chart is a downward candle and is supported at the support and resistance points.
In an altcoin bull market, it is not a good idea to buy when the price is rising.
You may make a big profit once or twice, but in the end, it will be an opportunity to buy at the highest point.
Therefore, in the coin market
1. In a rising market, when the candle on the 1D chart is a falling candle, check the support at the support and resistance points and buy.
2. In a falling market, the time to buy is when it breaks through the support and resistance points on the 1D chart.
I think points 1 and 2 above apply to the basic trading method.
When an altcoin bull market or bear market is in progress, movements occur regardless of the status of the indicator, so trading is possible using the above trading method even if the indicator is overheated.
However, you should enjoy your investment as prices continue to rise.
A 100% sell in a bull market means that this altcoin will not be traded in the future.
Therefore, the trading method of selling 100% is not appropriate.
Under no circumstances should you stop trading.
This does not mean that you must continue to trade unconditionally.
This means that you must constantly check the chart of the coin you want to trade and constantly observe when to start trading and when to sell.
(4h chart)
The gap between the 5EMA of the 1D chart and the M-Signal indicators of the 1M, 1W, and 1D charts shown on the chart has widened considerably.
Accordingly, it is necessary to determine how this gap can be reduced in the future.
The best way, in my opinion, is to touch the M-Signal indicator on the 1D chart, maintain an upward trend, and move sideways near the current price until the M-Signal indicator on the 1W and 1M charts rises.
I believe that these sideways will make it difficult for individual investors and will naturally encourage selling, providing an opportunity to secure a stable supply.
At the same time, we expect that all high leverage will be liquidated.
--------------------------------------------------
- The big picture
The full-fledged upward trend is expected to begin when the price rises above 29K.
This is the section expected to be touched in the next bull market, 81K-95K.
-------------------------------------------------- -------------------------------------------
** All explanations are for reference only and do not guarantee profit or loss in investment.
** Trading volume is displayed as a candle body based on 10EMA.
How to display (in order from darkest to darkest)
More than 3 times the trading volume of 10EMA > 2.5 times > 2.0 times > 1.25 times > Trading volume below 10EMA
** Even if you know other people’s know-how, it takes a considerable amount of time to make it your own.
** This chart was created using my know-how.
---------------------------------

$BTCUSD Retraction Point Approaching The BITSTAMP:BTCUSD pair is nearing a crucial resistance level at $46,177, signaling potential price retraction.
Our indicator ( w.aritas.io ) suggest a gradual exhaustion of bullish momentum, with increased short positions. Additionally, the Relative Strength Index (RSI) is approaching the overbought (OB) zone, indicating a potential reversal.
Caution is advised, and a retracement to around $39,375 is anticipated. Traders should closely monitor these levels for potential trend changes.

The only constant with trading the markets is...The only thing constant about financial markets is that they change.
And since 2007 or so, with the higher availability of trading different instruments and markets world-wide.
And not to mention, the ability to go long (buy) and go short (sell).
Yes, these everyday possibilities were difficult to find and trade back then.
Now I’m speaking my age in the markets. But it’s important to know, the algorithms are changing the game every single year.
As long as you’re a trader you need to be able to learn, grow, adapt and evolve with every changing markets.
Let’s go into details about WHY the markets are changing…
Since around 2007, the landscape has undergone significant transformations, driven by several key factors that shape the dynamic nature of these markets.
1. Globalisation and Technological Advancements
Traders now are able to gain access to enhanced connectivity, facilitating participation in markets worldwide.
They also have amazing trading and charting platforms like TradingView.
This increased speed of information dissemination and transactions has a profound impact on market dynamics. And this helps contribute to the perpetual state of change.
2. Diversification of Instruments and Markets
The availability of diverse financial instruments, ranging from stocks and bonds to commodities and cryptocurrencies, has expanded trading possibilities.
Each year we seem to have more assets, markets, instruments, structured products and choices.
It's building into a trading universe in a way.
And each market possesses unique characteristics influenced by distinct factors.
This diversity introduces complexity to trading strategies. And this requires traders to navigate a broad spectrum of instruments with different behaviors.
As long as there are new and improved assets, the markets will always change.
3. Long and Short Positions
Unlike in the past, where shorting certain markets proved challenging, the ability to go long (buy) and short (sell) has become more prevalent.
This flexibility allows traders to capitalize on both upward and downward market movements.
With the ability to go long and short a variety of markets, this is changing the financial landscape of the markets.
Price action no longer moves in a Zig Zag 45 degree motion.
There are more dips and rallies without strong trends, like in the past.
All because of the intrciacies of long and short positions also adds intricacy to risk management strategies. talking about algorithms.
4. Rise of Algorithmic Trading
Algorithmic trading has emerged as a game-changer in financial markets.
This involves using computer programs to execute trades based on predefined criteria.
The influence of algorithmic trading is profound, contributing to increased liquidity, faster execution, and the development of innovative trading strategies.
As algorithms evolve each year, they continually reshape the dynamics of the trading landscape.
5. Market Participants and Strategies
The composition of market participants has evolved, with institutional investors, hedge funds, high-frequency traders, and retail traders all playing pivotal roles.
All of a sudden we've seen a spike in the new trend of trading with Smart Money Concepts and Inner Circle Trading, in the last two years.
These changes in the behavior and strategies of these participants can swiftly impact market trends and volatility.
The influx of retail traders, facilitated by online platforms, further adds new dynamics to the markets.
So once again, the only constant for traders is the change that is taking place in the financial landscape and market universe.
Traders who evolve, adapt, acknowledge and respond effectively to the perpetual state of change are better positioned for success in this dynamic and challenging environment.
