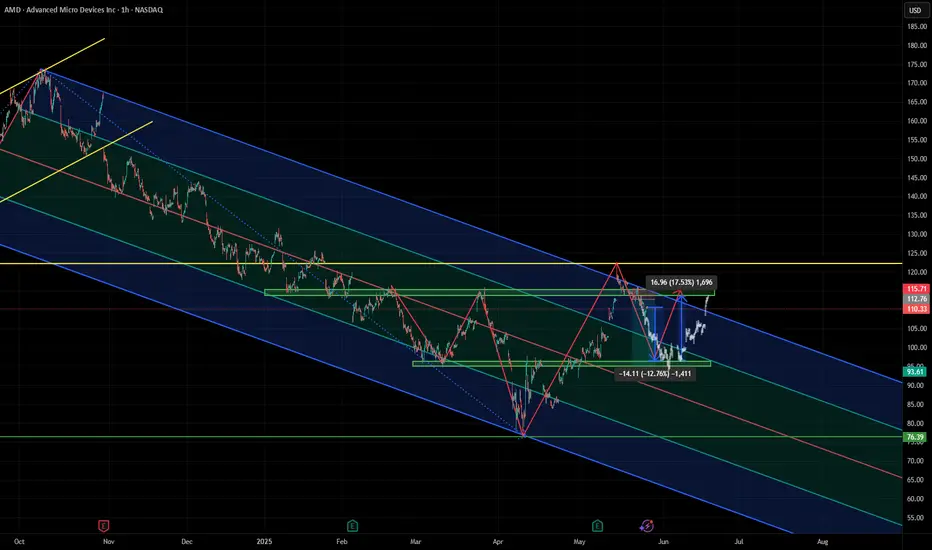
AMD: Short and Long Position IdeasThe current market structure indicates a potential bullish reversal within a broader descending channel. Following a previous decline of approximately 12.76% (−14.11 points), the price has staged a notable recovery, rallying 17.53% (+16.96 points) from a key horizontal support zone near 93.61. This area has historically acted as a demand zone, validating its significance with multiple touchpoints and a recent strong reaction.
Currently, the price action is approaching a critical resistance zone near 115.81, which also aligns closely with the upper boundary of the downward sloping blue channel. A sustained breakout above this resistance would constitute a technical breakout from the bearish structure and could signal a shift toward a medium-term bullish trend. In such a scenario, the next target would be the horizontal resistance zone around 120–122, supported by previous highs and structural confluence.
From a trade setup perspective, a long position could be considered on confirmation of a breakout and close above 115.81, with a target range of 120–122. A more conservative entry may be planned on a retest of the breakout level (115.81) as new support. Stop-loss levels could be strategically placed below the most recent higher low or the green support band near 105 to maintain a favourable risk-reward ratio. Conversely, failure to break above the resistance could trigger a reversion back to the mid-channel zone or retest of the 93.61 support level, favoring a range-bound or mean-reversion strategy in the short term.
Overall, the chart suggests a tactical bullish bias, contingent on breakout confirmation and broader market momentum.