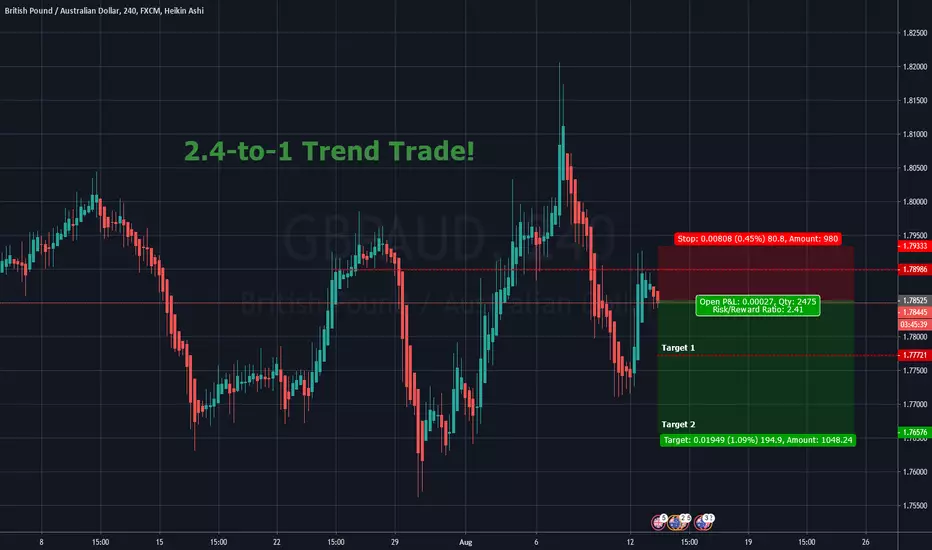
Trend Trade on GBPAUD for 2.4-to-1 Reward!Our @FollowMyForex trend trading system just gave a new signal, this time to short the GBPAUD.
This trade carries a nice 2.4-to-1 reward to risk ratio and we'll be taking 50% off at the first target. After that we'll let the trade do it's thing and ride out the rest of the position to target 2.
All the GBP pairs have been in an incredible bearish trend over the past few weeks and as trend traders we have been able to capitalize on this entire move. Nobody knows how far these GBP pairs might still fall but that's the beauty of trend trading, you are almost always wrong if you try to guess the top or bottom. Rather just trade a great system with a proven edge.
Trade safely, updates to follow.
Tradingsystem
+129 Pips Profit On USDCAD Trend Trade!After yesterday's @FollowMyForex trend following strategy to buy USDCAD on the H4 chart price never looked back and just blew through our first and then second targets.
This is why our trend-following system will always be my personal favourite. When it gives a signal I always have so much confidence in the trade. You just know that you are getting on board with something that has major momentum left in the engine and the odds are always in our favor with this trade.
On average our trend trades last about 2 days if we take it from the H4 chart, but this one lasted no more than 14 hours and we had all our profits booked!
A commenter on the initial trade signal mentioned that he only sees downside from here which obviously wasn't the case. The lesson here is that if you have a proven professional strategy that you trade with that has a defined edge, you take each and every trade with full confidence, regardless of the scary uncertainty of what's going to happen next. You know that even if this trade results in a loss, if you keep trading this system you'll come out very profitable. And that's what it's all about after all, isn't it? Being profitable month after month, year after year.
Good luck out there and well done to everybody who took yet another profitable trade with us!

First Loss In 2 Months - Important LessonWe just took our first trading loss in two months on the GBPJPY short that we initiated a couple of days ago. I always welcome losses when they are controlled and within the confines or our trading system , which this GBPJPY short was.
Why is that?
Because I know that every loss is one trade closer to the next big win. And having a 81% success rate since the last loss at the end of May 2019 tends to make any loss much more bearable ;)
How do we remain unwaiveringly confident even in the face of losses? Easy. Trade with a system that has a proven edge. Not over one month. Not two month. Not even just one year, but a system that has a consistent track record over at least two years of backtesting. It should be rooted in sound technical analysis so that you know the odds are always in your favor when you place that next trade.
Because we have so much data for this system we know all the stats related to it. Therefore we will start experimenting with even bigger position sizing in a separate "High Risk" account. It will ask to stomach much bigger drawdowns but for much bigger returns as well.
More to follow, be safe and good luck!

$BTC Trading system for the Lazy Trader still beats #HODL The following rules would have generated $8,299,810.26 from $10000 instead of Holding $5,140,425 beginning from 17th September 2012 to now.
1st off I have to say this didnt take long to back test. It is pretty simple
Here are the rules
1. We only use Weekly chart for buy and sell signals
BUY:
Weekly candle must be above the 20MA
Stochastic RSI upward but not above 80
MACD at least 3 histogram bars in a reverse swing buyers momentum
if all rules are met buy on the week start
Sell:
Sell 50% if Stochastic RSI has been above 80 and drops below - sell the new week
buy back in if ALL BUY RULES ARE MET
if the candle closes below the 20MA sell the rest of the 50% or all
#NOTE this can be highly more profitable with a bit of tweaking

Nikkei 225 Sell Off LoadingUltimately the drawing pretty much sets out the trade idea here.
The trade Idea is only valid if the market breaks the level marked below the current indecision. I have taken the aggressive entry as this suits my trading strategy to take opportunities with huge Risk:Reward ratios on the acceptance that I am likely to lose more than I win, but the winners far out weigh the losers in monetary terms.

GBPJPY will fall, let start shortOur analysis on GBPJPY:
Price doesn't move strong even after divergence spotted .
Current situation:
1. GBPJPY tested the long trendline and cannot make higher high.
2. GBPJPY leave the long trendline after test it.
3. Stoch indicated divergence before but leave weak impact.
We believe the price have higher possibilities to move short and if the price break out from the support, it will be a strong confirmation.

Possible GBP/CAD Short Position!!SMP TRADING
SELF DEVELOPMENT/METHODOLOGY/PSYCHOLOGY
Chart time frame - H4
Timeframe - 1-2 days
Actions on -
A – Activating Event
Market will meet resistance in zone @1.776 - .... and fall to the @1.745. In order to enter, the pair MUST be in line with my Entry Procedure....
B – Beliefs
Market move towards the first Target 1 level @ 1.745
FX:GBPCAD
Trade Management
Entered @ .....
Stop Loss @ .....
Target 1 @ 1.745
Target 2 @ ....
Risk/Reward @ 3.1
Happy trading :)
Follow your Trading plan, remain disciplined and keep learning !!
Please Follow, Like,Comment & Follow
This information is not a recommendation to buy or sell. It is to be used for educational purposes only!

How to trade news eventsHi traders,
news events are market situations with strong price movements and can give as fast good profits.
But if when you use the wrong way to set your oders and maybe trade in the wron direction then you
can lose a lot of money if you have not a good exit strategy.
This picture show you how you have to trade the news with limit orders.
I wish you a good trading week.
Stefan Forex

Possible GBP/AUD Short Position!!SMP TRADING
SELF DEVELOPMENT/METHODOLOGY/PSYCHOLOGY
Chart time frame - H4
Timeframe - 1-2 days
Actions on -
A – Activating Event
Market will meet resistance in zone @1.87 - .... and fall to the @1.842 In order to enter, the pair MUST be in line with my Entry Procedure....
B – Beliefs
Market move towards the first Target 1 level @ 1.842
FX:GBPAUD
Trade Management
Entered @ .....
Stop Loss @ .....
Target 1 @ 1.842
Target 2 @ ....
Risk/Reward @ 3.1
Happy trading :)
Follow your Trading plan, remain disciplined and keep learning !!
Please Follow, Like,Comment & Follow
This information is not a recommendation to buy or sell. It is to be used for educational purposes only!


ADA/USD Buy signal yesterdayMy sytem has a BUY signal on Cardano (ADA/USD) yesterday at 0.43 level
Expected probability is about 55%
Expected AvgWin/AvgLoss ratio is 1.85
Take profit is 5xATR(10) at 0.55
Stop loss is 2xATR(10) at 0.36
Good luck and good trading

Possible CAD/JPY Short position!!SMP TRADING
SELF DEVELOPMENT/METHODOLOGY/PSYCHOLOGY
Chart time frame - H4
Timeframe - 1-3 days
Actions on -
A – Activating Event
Market will meet resistance @83.93 level and fall to the @82.4 level. In order to enter, the pair needs to be rejected by the Bollinger Band line....
B – Beliefs
Market move towards the first Target 1 level @ 82.4
FX:CADJPY
Trade Management
Entered @ Sign up for mentoring
Stop Loss @ Sign up for mentoring
Target 1 @ 82.4
Target 2 @ 0.
Risk/Reward @ 4.1
Happy trading :)
Follow your Trading plan, remain disciplined and keep learning !!
Join our Tier 1 Mentoring Program TODAY!! twitter.com
Please Follow, Like,Comment & Follow
This information is not a recommendation to buy or sell. It is to be used for educational purposes only!

Long CHF/JPY!!SELF DEVELOPMENT/METHODOLOGY/PSYCHOLOGY
Chart time frame - H4
Timeframe - 4-8 Hours
Actions on -
A – Activating Event
Currency Pair pushing through resistance line and heading to next resistance line.
B – Beliefs
Market move towards the first Target 1 level @ 110.00
FX:CHFJPY
Trade Management
Entered @ Sign up for details
Stop Loss @ Sign up for details
Target 1 @ 110.00
Target 2 @
Risk/Reward @ 1.1
Happy trading :)
Follow your Trading plan, remain disciplined and keep learning !!
Please Follow, Like,Comment & Follow
Thank you for your support :)
This information is not a recommendation to buy or sell. It is to be used for educational purposes only!

Possible USD/CHF Long position!!SELF DEVELOPMENT/METHODOLOGY/PSYCHOLOGY
Chart time frame - H4
Timeframe - 1-3 Days
Actions on -
A – Activating Event
Currency Pair breaking through resistance line and heading to next strong resistance line
B – Beliefs
Market move towards the first Target 1 level @ 1.01
OANDA:USDCHF
Trade Management
Entered @ Sign up for details
Stop Loss @ Sign up for details
Target 1 @ 1.01
Target 2 @
Risk/Reward @ 3.1
Happy trading :)
Follow your Trading plan, remain disciplined and keep learning !!
Please Follow, Like,Comment & Follow
Thank you for your support :)
This information is not a recommendation to buy or sell. It is to be used for educational purposes only!

Create your own trading system: entry point # 8We continue to explore different points of entry into the market.
Today I want to show you a complex entry point that arises from the analysis of stochastic cycles.
As you know, the Stochastic indicator shows overbought and oversold zones. But, personally to me, he helps to find important levels of support and resistance.
The essence of the theory of stochastic cycles
The movement of the Stochastic indicator between zones 80 and 20 displays the beginning and end of the wave (impulse, or mini-trend). But, my observation showed that it is necessary to take into account not all the intersections of zones 20 and 80 with the Stochastic indicator.
The secret of the practice of using stochastic cycles
And the secret is simple: you need to take into account only those highs or lows of the price at which the stochastic indicator began its journey from zone 80 to zone 20 (down), or from zone 20 to 80 (up).
That is, we do not know when the growing price movement will end until the stochastic, starting from 20, comes to 80, and decreases back to 20 (the bullish stochastic triangle). Also with a falling motion, it will end when the stochastic crossed the zone 80, dropped to 20, and returned back to 80 (bearish stochastic triangle).
Support and resistance levels
As you can see on the EURUSD chart there are a lot of highs and lows in prices. There are many different methods of applying support and resistance levels.
Personally, I like my method - drawing support and resistance levels according to the highs and lows of the stochastic cycle.
The reversal line is the level of the stochastic maximum or minimum, which, as a rule, occurs at the base of the previous pulse. The logic is simple: if the price was able to absorb the previous movement, then a turn in the opposite direction is likely.
How to trade
There are several regularities for entering a trade in stochastic cycles.
1. Bullish and bearish triangle
We waited for the stochastics from 20 to rise to 80, and to fall to 20, entry into the purchase.
We waited until the stochastic dropped from 80 to 20, and rose to 80, the entrance to sales.
2. Retest level
We buy if the price has returned to the previous top of the stochastic cycle.
We sell if the price has returned to the previous low of the stochastic cycle.
3. Entrance to the rebound from the pivot line
We buy when the price bounces from the reversal line.
We sell when the price bounces from the reversal line.
Indicators:
Stochastic, 15.3.3.
Timeframe: H1
Currency: EURUSD
Personally, I only trade the retest level - this is a more likely signal.
Rules for entry into position:
We buy if:
The Stochastic has formed a bullish triangle;
We are waiting for the price to fall to the previous top of the stochastic cycle, we enter the buy.
We Sell if:
Stochastic shaped bearish triangle;
We are waiting for the price to rise to the previous low of the stochastic cycle, we enter the sell.
Exit position:
You can use a fixed profit, or trailing stop.

Create your own trading system: entry point # 7We continue to study simple market entry points with you.
Today I bring to your attention the idea for scalping. When there is no clear trend on D1, this is the time for such scalping strategies. Immediately I warn you, on the trend, this strategy may not give very good results.
For our educational purpose, and the selection of different strategies in the trading system, this idea may be appropriate.
Indicators:
Vstop, length 15, source hlc3, multiplier 4.
RSI, 14, hlc3.
Timeframe: M15
Currency: EURUSD
The essence of the idea: the search for entry points in the direction of movement of the indicator Vstop.
The strength of this idea is that during a wide flat, the price moves from level to level, without a certain direction. The task of the trader is to catch the impulse in each such microtrend, and quickly close the position.
In a narrow flat, there may be many small negative trades. But, when taking the impulse, these losses are more than covered.
Rules for entry into position:
We buy if:
Vstop indicator blue;
We are waiting for when the RSI indicator crosses the value of 50 from the bottom up, we enter the purchases.
We sell if:
Vstop red indicator;
We look forward to when the RSI indicator crosses the value of 50 from the top down, we enter into sales.
Exit position:
The exit from the transaction can be at the opposite signal of the intersection of 50 RSI indicator. You can use a fixed profit, or trailing stop.

Create your own trading system: entry point # 6We continue to study simple market entry points with you.
It is very difficult to find the direction of price movement in the Forex market. That is why the indicators of the triangulation of the moving average look very good in practice. The difference between triangulation MA (TEMA) and simple MA is obvious.
Indicators:
TEMA, 100.
Williams% R, 5, hlc3.
Timeframe: D1
Currency: EURUSD
The essence of the idea: the search for points when the price returns to the indicator TEMA.
The TEMA indicator shows us the priority direction of opening deals. He very well shows the turning points, and the edges of the flat. And we will look for the entrances to the market using the Williams% R indicator.
Rules for entry into position:
We buy if:
The price approached the TEMA indicator from above;
We are waiting for the Williams% R indicator to cross the -80 values from bottom to top, and buy.
We sell if:
The price approached the TEMA indicator from below;
We are waiting for the Williams% R indicator to cross the top-down values of 20, and sell.
Exit position:
The exit from the transaction can be the opposite signal of the intersection of their zones indicator Williams% R. You can use a fixed profit, or trailing stop.

Identify Impulse and Corrective MovesMarket moves can generally be categorized as either an IMPULSE move or a CORRECTIVE move.
A fast and strong move is described as an IMPULSE move.
A slow and weak move is described as a CORRECTIVE move.
Practical Exercise
1) Pick any currency pair, any timeframe, and identify the IMPULSE and CORRECTIVE moves on the chart.
2) Draw a line on the IMPULSE move; draw a box on the CORRECTIVE move.
3) Post your chart on the comment section below.
4) Repeat this practice on 2 other currency pairs.

Long EUR/USD!!!SELF DEVELOPMENT/METHODOLOGY/PSYCHOLOGY
Chart time frame - H4
Timeframe - 4 Hours
Actions on -
A – Activating Event
Currency Pair creating a Double Top .
B – Beliefs
Market will find support at current levels and move towards the first Target 1 level @ 1.1335
FX:EURUSD
Trade Management
Entered @ Sign up for details
Stop Loss @ Sign up for details
Target 1 @ 1.1335
Target 2 @
Risk/Reward @ 1.1
Happy trading :)
Follow your Trading plan, remain disciplined and keep learning !!
Please Follow, Like,Comment & Follow
Thank you for your support :)
This information is not a recommendation to buy or sell. It is to be used for educational purposes only!

Possible GBP/USD Short PositionSELF DEVELOPMENT/METHODOLOGY/PSYCHOLOGY
Chart time frame - H4
Timeframe - 1-2 Days
Actions on -
A – Activating Event
Currency Pair creating a Double Top .
B – Beliefs
Market will be rejected at @1.299 level and move towards the first Target 1 level @ 1.2835
FX_IDC:GBPUSD
Trade Management
Entered @ Sign up for details
Stop Loss @ Sign up for details
Target 1 @ 1.2835
Risk/Reward @ 3.3
Happy trading :)
Follow your Trading plan, remain disciplined and keep learning !!
Please Follow, Like,Comment & Follow
Thank you for your support :)
This information is not a recommendation to buy or sell. It is to be used for educational purposes only!

Create your own trading system: entry point # 5We continue to study with you the simple market entry points.
Today I would like to show you a very easy pattern for making money on the movement of the exchange rate - entry after a price rollback.
Indicators:
MACD 4C with a period of 8, 100.
Timeframe: M15
Currency: EURUSD
The essence of the idea: the search for entry points after the impulse, at the end of the price rollback.
This idea is very simple to understand: you need to wait for a strong impulse up or down, then wait until the end of the price rollback, and enter in the direction of the previous impulse.
Rules for entry into position:
We buy if:
MACD 4C was green for more than 9 bars (impulse up);
MACD 4C draws red histograms of more than 6 bars (case 1);
After that we draw a resistance line at closing prices (see line chart).
We enter into purchases on the breakdown of the resistance line (Case 2).
We sell if:
MACD 4C was red for more than 9 bars (impulse down);
MACD 4C draws green histograms greater than 6 bars (case 1);
After this, we draw a support line at closing prices (see line chart);
We enter sales on the breakdown of the support line (Case 2).
Exit position:
The exit from the transaction can be at a fixed profit, or use a trailing stop.

Create your own trading system: entry point #4We continue to look for your entry points into the market.
I bring to your attention an effective pattern of work in the flat. Traders who work in both directions name a swing - traders.
Indicators:
CCI with a period of 100, hlc3, levels 100 and -100.
Timeframe: H4
Currency: EURUSD
The essence of the idea: the search for entry points in the flat, after the breakdown of the trend line.
Once again I remind you: you need to look for deals only after the breakdown of the trend line, otherwise there will be too many unnecessary signals to enter. If the trend line is broken, the trend line may expand, so a flat is likely.
Rules for entry into position:
We buy if:
The price is near the support level;
The CCI indicator shows two touches of the -100 zone (case 1);
We enter the purchase at the intersection of the indicator CCI zone -100 bottom-up.
We sell if:
The price is near the resistance level;
The CCI indicator shows two touches of zone 100 (case 1);
We enter sales at the intersection of the CCI indicator of the zone 100 from top to bottom.
Exit position:
The exit from the transaction can be based on a fixed profit, or on the reverse intersection of the zones with the CCI indicator.

Gold Long - I think it's a FAKE break, You?For the past 8 day candles, the price closed with higher lows.
But alas! the ninth candle which we are seeing right now breaks out from the streaks.
Now, I wanna avoid the complicated stuff and just dive into 2 simple decisions:
1) The price is breaking below the range, the dollar is still climbing and so is the US stocks market. Imma gonna wait for a clean break, wait for a retracement, and go in for a short.
2) The price is breaking below the range, but heck! This could be a fake breakout just for institutional to go in for the long cheaper. Imma go for a long once the downside is settled.
Oh, there's a third choice by the way: Heck this! I don't wanna get involved in this shet anymore. Imma OUT.
For me, I choose (2). I am ready to take the risk here. The RRR is so attractive in this case so it is worth the bet.
I strongly believe that the dollar and the US stock is way overbought, and the structure of the gold points clearly to the upside.
As traders, we make our own decision systematically(trade what you see) and sensibly(manage risk and only take trades that's valuable).
