Ethereum Eyes Breakout Toward $4,434 After ConsolidationEthereum (ETH/USD) is consolidating near $4,230 within an upward channel, hinting at a potential breakout toward the $4,434 target. Short-term price action suggests buyers may be preparing for a bullish push after holding above key trendline support.
2. Current Price Zone – Price is hovering around $4,230, holding near the midline of the channel, suggesting support is intact.
3. Bullish Setup – The projected path on the chart shows a short dip followed by a rally toward $4,434, indicating bullish sentiment.
4. Key Resistance – The $4,434 level is highlighted as the next major resistance, aligned with the channel’s upper boundary.
5. Support Zone – The trendline from August 9–10 acts as immediate support, keeping the bullish structure valid.
6. Volume/Volatility Signal – The lightning bolt icon may indicate an upcoming high-volatility event, potentially acting as a catalyst for the move.
Tradingview

BTCUSDT - high placed ? What's next ??#BTCUSDT... so far market placed a very reasonable day high that is 122600-700 around.
So if market holds that then drop expected.
Above current day high it will be invalidate.
Gold luck
Trade wisely

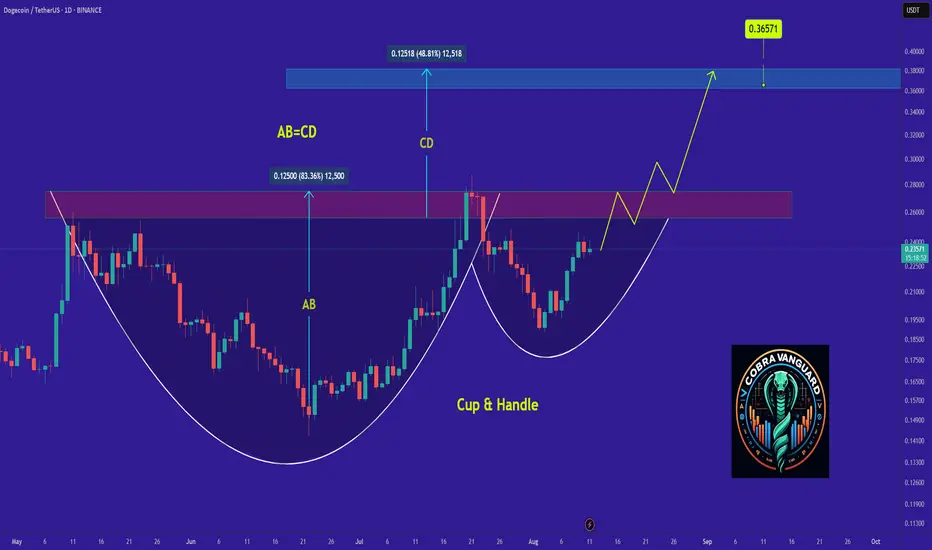
DOGE's Situation, A Comprehensive Analysis !!!It appears that the price is forming a cup and handle pattern, and if this occurs, it could push the price above $0.33.
Best regards CobraVanguard.💚
TradeCityPro | Bitcoin Daily Analysis #150👋 Welcome to the 150th Bitcoin Analysis on TradingView by TradeCity Pro!
I am very happy that the number of daily Bitcoin analyses has reached 150. I hope the analyses have been useful so far and that you have been able to benefit from them. On this occasion, I want to present a complete and comprehensive analysis of Bitcoin.
📅 Weekly Timeframe
On the weekly timeframe, Bitcoin has been in a very strong uptrend since early 2023. After breaking the 24512 resistance, it made several sharp moves and, in multiple bullish waves, managed to register a new ATH in the 120000 zone.
✨ At the moment, it can be said that Bitcoin is in the seventh wave of its trend, which is quite a high number. The more waves a trend has and the more it shows signs of weakness, the higher the probability of a trend reversal.
📊 Regarding volume, there is not much to say because over time, Bitcoin’s trading volume on Binance has decreased. The reason is partly due to Binance exiting certain countries, and partly due to the growth of the DeFi space, where a significant percentage of trading now happens on DEXs, naturally reducing CEX volume.
⭐ However, if we compare the magnitude, slope, and candlestick size of the bullish waves, the trend weakness is clearly visible. But this does not mean the trend will reverse.
🧩 Many trends, even after showing weakness, continue for several more waves. If this happens for Bitcoin on the weekly timeframe, we can still take many long positions in futures during those waves.
💥 Therefore, this trend weakness is not a solid reason to avoid opening long positions for now. I still believe long positions in futures take priority over short positions.
🛒 For spot, if you have already bought Bitcoin, I suggest you keep holding for now. We can take profit after confirming the trend, but for now, it is better to hold.
🎲 However, for spot buying at current prices, I do not recommend it because it is not worth it. It is better to open futures positions to get a more reasonable profit.
🔔 Now that the 110000 resistance has been broken, the next targets are 128000 and 162000. If RSI enters the Overbought zone, these targets will be within reach.
📅 Daily Timeframe
In the last analysis I shared for this timeframe, the price was in a correction phase, and I mentioned that as long as the price is above 110183, the trend is bullish, and the probability of upward movement is higher than a drop.
🔑 That’s exactly what happened — the price formed a higher low above 110183, and RSI bounced from near the 38.21 support level and moved upward.
🔍 We had a Maker Seller zone between 120000 and 122000, and now the price has penetrated into it.
🔼 It seems to be getting rejected from the top of this zone and today failed to break it. Now we need to see what happens during the New York session.
✔️ In my opinion, it is unlikely that the price will break this top today. The market will probably wait for the U.S. inflation data release tomorrow before deciding on the next move.
📊 If inflation comes in higher than expected, the market will re-enter a correction phase, likely dropping back toward 110183.
📈 If inflation is lower than expected, Bitcoin can break the 122000 resistance and start a new bullish leg.
⏳ 4-Hour Timeframe
On this timeframe, Bitcoin finally broke through the Maker Seller zone it had formed, with a strong bullish candle. After RSI entered the Overbought zone, a Blow Off candle was printed near the 122733 resistance.
☘️ Currently, given the recent red candles, it appears that RSI’s entry into Overbought was a fake-out, and the price has pulled back to 120041.
⚡️ There is a possibility that the price could resume its upward movement from here, as the 120041 zone is an important level that can prevent further declines. In this scenario, the price would also have completed a pullback to the SMA7.
💥 If a deeper correction occurs, the next dynamic support is the SMA25, which is also an important momentum support.
📉 The lower static support levels for Bitcoin are currently 116829 and 115364.
❌ Disclaimer ❌
Trading futures is highly risky and dangerous. If you're not an expert, these triggers may not be suitable for you. You should first learn risk and capital management. You can also use the educational content from this channel.
Finally, these triggers reflect my personal opinions on price action, and the market may move completely against this analysis. So, do your own research before opening any position.

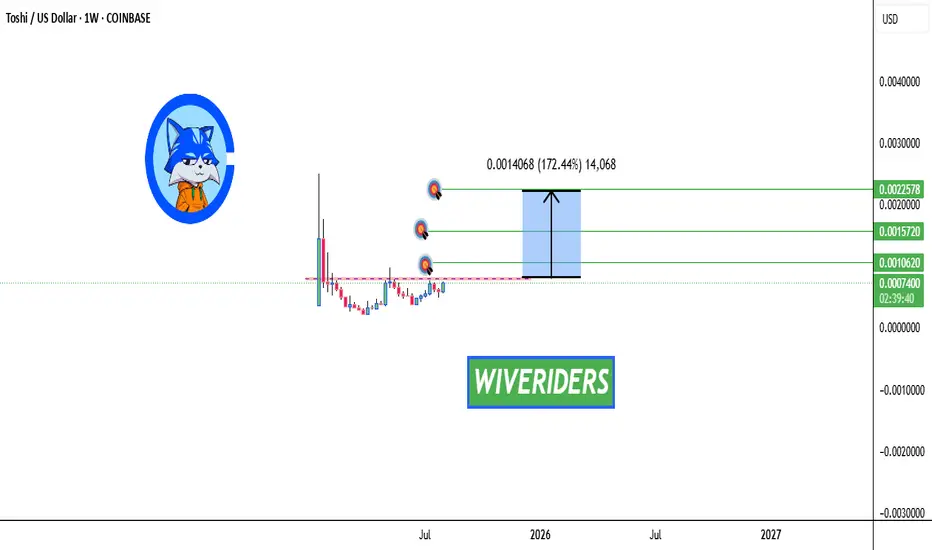
TOSHI Breakout Watch – Testing Red Resistance Again!🚨 $TOSHI Breakout Watch – Testing Red Resistance Again! 🔴⏳
$TOSHI is testing the red resistance zone again.
📊 If breakout confirms, realistic targets in this bull market are the green line levels.
💡 If you have $TOSHI, don’t sell now — at this moment, there’s no sell signal. Best move is to hold and wait for a breakout.
TradeCityPro | PENGU Consolidates, Awaiting Altseason Breakout👋 Welcome to TradeCity Pro!
In this analysis, I want to review the PENGU coin for you. This project is one of the new Solana-based meme coins from China, with a market cap of $2.4 billion, ranked 43rd on CoinMarketCap.
📅 Daily Timeframe
On the daily timeframe, this coin started a strong bullish trend from the 0.003813 low. In the first wave of this move, it managed to reach around the 0.015 zone, and after a long correction period, it has now started a new bullish wave, moving up to the 0.043576 high.
✔️ Currently, the price is in a correction and consolidation phase, but the correction is mostly time-based since it hasn’t even reached the 0.236 Fibonacci level yet.
📈 The next bullish leg will start with a break above 0.043576. I will try to open a long position on this coin if this level is broken.
📊 For now, we can’t determine the next targets based on Fibonacci levels because we first need to see how far the price corrects. After breaking 0.043576, I will update the analysis and define the targets.
✨ If the correction deepens, the price can retrace to the 0.236, 0.382, and 0.5 Fibonacci levels. In the case of a sharp drop, as long as the price remains above the 0.015 zone, the trend is still bullish, and a break below this level would signal a trend reversal.
📝 Final Thoughts
Stay calm, trade wisely, and let's capture the market's best opportunities!
This analysis reflects our opinions and is not financial advice.
Share your thoughts in the comments, and don’t forget to share this analysis with your friends! ❤️

XAUUSD - Daily Sniper Battle PlanGood day traders 🌟
🌍 MACRO PULSE & CONTEXT
USD Sentiment: Dollar showing mixed signals as markets await fresh catalysts. No major USD movers today keeping gold in pure structural play mode. Fed remains hawkish but dovish pivot expectations keep safe-haven flows active. Gold sitting in premium territory testing institutional patience.
Key Events: Watch for any surprise USD strength that could accelerate moves through key levels. Current levels showing distribution vs accumulation battle.
📊 HTF OVERVIEW (D1 → H4 → H1)
Daily Bias: BULLISH BUT EXTENDED
Long-term trend remains bullish with higher highs intact
Price in premium territory - caution for longs
Multiple supply layers above current price creating resistance stack
H4 Bias: CONSOLIDATION IN PREMIUM
Price testing upper structural boundaries
Bull case: Hold above 3380 for continuation toward higher supply zones
Bear case: Break below 3360 for deeper correction to demand
H1 Bias: MIXED - CRITICAL DECISION ZONE
Sitting at key structural level at 3396
Breakout zone: 3390-3405 range
Direction of next move will define short-term bias
🎯 STRUCTURAL ZONES (SMC/ICT CONFLUENCE)
PREMIUM SUPPLY ZONES - STACKED RESISTANCE
🔴 3540-3560 | Weekly Nuclear Supply
Ultimate resistance - weekly structural ceiling
Major institutional distribution zone
Final target for any extreme bullish scenario
🔴 3500-3520 | Daily Major Supply
Strong daily supply block with heavy rejection history
Key institutional selling zone
Secondary target for bullish extensions
🔴 3460-3480 | H4 Supply Block
Immediate major resistance above current consolidation
Previous rejection area with bearish OB formation
First major target if bulls break above 3440
🔴 3420-3440 | H4 Near Supply
Current upper boundary resistance
Recent high rejection point
Scalp short opportunity zone
DISCOUNT DEMAND ZONES
🟢 3280-3300 | H4 Nuclear Demand
Major structural support with institutional backing
Previous breakout point turned support
High probability bounce zone if deep correction occurs
🟢 3340-3360 | H1 Key Demand
Critical pullback support level
Clean demand block with previous respect
First major support below current price
CURRENT BATTLEFIELD
⚡ 3390-3405 | Decision Zone
Critical range where price currently consolidates
Breakout either direction will dictate next major leg
Low probability zone for range entries
⚡ CURRENT ACTION PLAN
IMMEDIATE FOCUS: 3396 in critical decision zone - patience required
BULL SCENARIO ROADMAP:
Above 3405 = Target 3420-3440 first supply test
Above 3440 = Target 3460-3480 major supply
Above 3480 = Target 3500-3520 daily supply
Above 3520 = Target 3540+ nuclear supply
BEAR SCENARIO ROADMAP:
Below 3390 = Target 3340-3360 demand test
Below 3340 = Target 3280-3300 nuclear demand
Below 3280 = Major trend shift - deeper correction
ZONE INVALIDATION:
Bull case compromised: Below 3280 major demand with volume
Bear case invalidated: Above 3540 nuclear supply with momentum
BEST R:R ZONES:
3340-3360 long - Perfect H1 demand with multiple targets above
3460-3480 short - Major supply with deep correction potential
3280-3300 long - Nuclear support with massive upside potential
🎯 FINAL BATTLE SUMMARY
Gold at 3396 sits in the eye of the premium storm - multiple supply layers stacked above like a fortress, while solid demand zones wait below. This is institutional chess at its finest.
The Setup: Stacked resistance creates multiple short opportunities on any push higher, while solid demand zones below offer high R:R long setups. The market is loaded and ready for explosive moves.
The Mindset: Premium territory with multiple supply layers demands surgical precision. Don't force trades at current levels - wait for the extremes where smart money reveals their true intentions.
Next Move: Any fundamental catalyst could trigger violent moves through these stacked zones. Clean breaks of structure with institutional volume will separate high-probability setups from noise.
The beauty of this setup is the multiple layers - bulls have targets, bears have multiple ambush points. Perfect battlefield for patient snipers.
If this layered battlefield analysis brought clarity to your gold game, smash that 🚀🚀🚀, drop your bias in the comments, and follow for precision execution intel. No fluff, just pure structural warfare.
📎 Disclosure: Part of TradeNation's Influencer Program - charts used for educational analysis only.

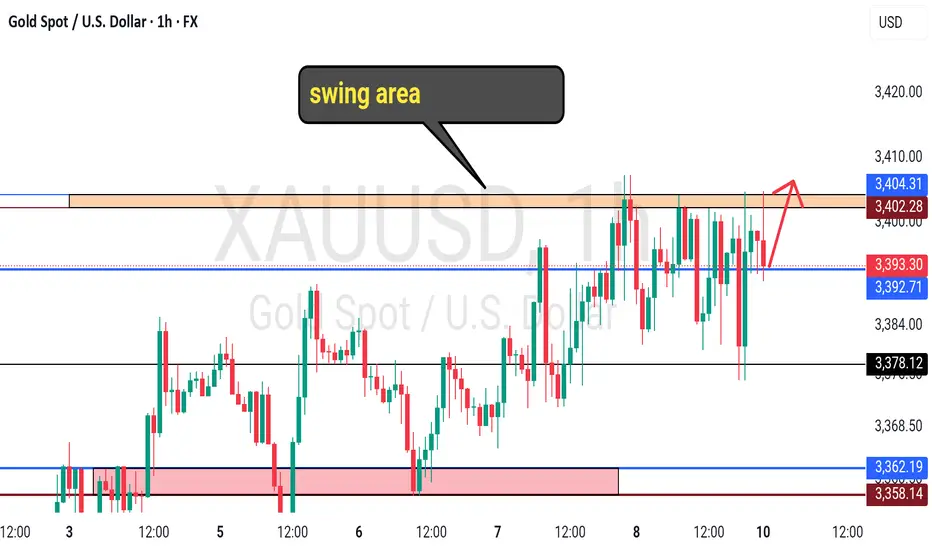
GOLD - at support ? What's next??#GOLD... Perfect move as per our video analysis and now market just at his current immediate supporting level.
That is 3392-93
Keep close and if market hold it in that case we can expect bounce otherwise not..
NOTE: we will go for cut n reverse below 3392-93 on confirmation.
Good luck
Trade wisely
Bitcoin’s Next Move? ETH Heating Up & Altcoin Liquidity Shifthey I’m Skeptic,
in this one we’re looking at BTC’s breakout attempt, the good & bad signs in the daily candle, and why ETH & other alts are moving while BTC is ranging.
also sharing my triggers for both BTC & ETH, plus what I’m watching on BTC.D for the week ahead.
manage your risk, don’t fomo — peace out :)

BTCUSD UPDATE Bitcoin has gone up and now I will close partial profits and secure what I have or even swing again to the up side

EURYEN EURJPY BUYSEurjpy keeping it simple and straightforward will be buying easily and will be closing partials

BTCUSDT 111k first then UPHi fellow traders,
Here’s my current BTCUSDT view on the 4H chart, based on Elliott Wave principles.
After a corrective structure, we’ve seen a strong bounce, and price is now approaching a key area of interest. I’ve marked the zones I’m watching for potential buys and sells:
🟨 Lower box: Potential buy zone if price pulls back with a corrective structure.
🟨 Upper box: Area of interest for taking partials or looking for potential short setups, depending on how price reacts.
If momentum continues, we could see BTC pushing into the 125K region, which aligns with fib extensions from previous swings.
As always, I’m waiting for confirmation before making any entries.
Let me know what you see on your end!

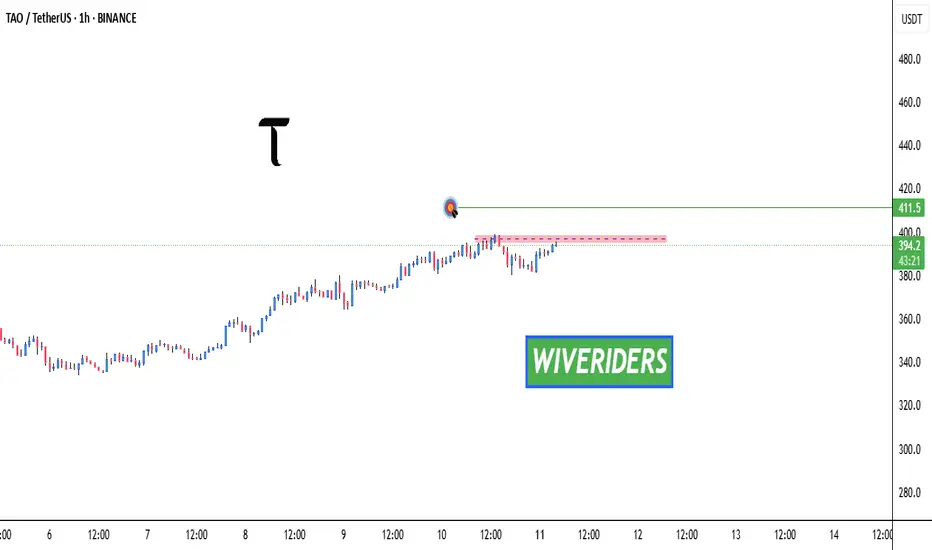
TAO Breakout Watch – Red Resistance Being Tested!🚨 TAO Breakout Watch – Red Resistance Being Tested! 🔴⏳
TAO is testing the red resistance zone.
📊 If breakout confirms, next move could target:
🎯 First Target → Green line level
A breakout could trigger bullish continuation and upside momentum.
UNI Breakout Watch – Red Resistance Being Tested! 🚨 UNI Breakout Watch – Red Resistance Being Tested! 🔴⏳
UNI is testing the red resistance zone.
📊 If breakout confirms, next move could target:
🎯 First Target → Green line level
A breakout could trigger bullish continuation and upside momentum.

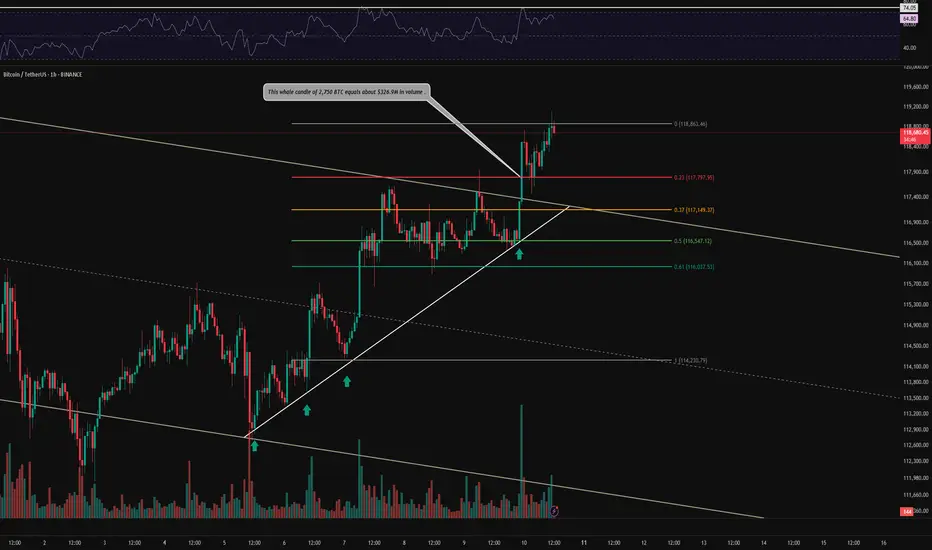
BTC 1H Analysis – Key Triggers Ahead | Day 7💀 Hey , how's it going ? Come over here — Satoshi got something for you !
⏰ We’re analyzing BTC on the 1-hour timeframe .
👀 After breaking out of its descending channel, Bitcoin is moving upward with a high-volume whale candle.
🕯 The trading volume and number of trades are rising sharply, and this volume increase during the New York session could lead to Bitcoin forming a new high.
⚙️ Our key RSI level is 74.05. If this level breaks, the volatility of Bitcoin’s long positions could increase significantly, potentially triggering a price surge.
🎮 After breaking the 0 Fibonacci level and pulling back to it, we can open our positions in line with the market structure change and move with the market.
🔒 An upward-sloping trendline has been drawn from the channel’s bottom to the top, and on the fourth reaction to it, Bitcoin bounced and beautifully broke through the channel’s top.
🔔 There’s no specific alert zone unless the current market structure changes, in which case an alert zone will be provided.
🖥 Summary: Bitcoin is moving upward, our long position trigger has been activated, and if the current structure is maintained, it could continue toward higher price levels.
📊 If USDT.D drops below 4.20% BTC might push toward higher targets .
❤️ Disclaimer : This analysis is purely based on my personal opinion and I only trade if the stated triggers are activated .
BTC Breakout Watch – Red Resistance Being Tested! 🚨 CRYPTOCAP:BTC Breakout Watch – Red Resistance Being Tested! 🔴⏳
CRYPTOCAP:BTC is testing the red resistance zone.
📊 If breakout confirms, next move could target:
🎯 First Target → Green line level
A breakout could trigger bullish continuation and upside momentum.

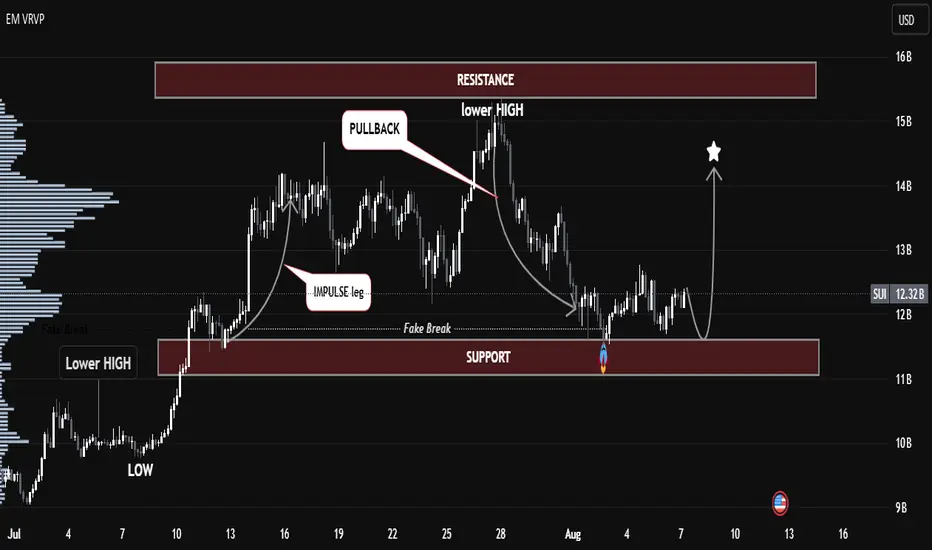
SUI/USDT – Smart Money Accumulation at Key Demand Zone📊 SUI/USDT – Smart Money Accumulation at Key Demand Zone | Bullish Outlook Ahead 🚀
The current SUI/USDT structure highlights a textbook Smart Money accumulation phase playing out at a key support zone, following a clear impulse–pullback–lower high formation.
🔍 Key Technical Insights:
🔻 Lower Highs Formation: A strong bearish structure led price back into the previous demand zone, sweeping liquidity below the support.
🎭 Fake Break Identified: Price action broke below the support briefly, indicating a liquidity grab (stop-hunt), often a precursor to bullish reversals.
🌀 Volume Node Alignment: Strong volume interest is building at the current support area, adding confluence for potential accumulation.
⚡ Projection Path: If the demand holds, expect a potential bullish reversal, targeting the previous resistance zone between 14–15B.
🧠 SMC Concepts in Play:
Fake Breakout = Liquidity Sweep
Impulse Leg = Institutional Activity
Pullback = Re-Entry for Smart Money
📈 Bullish Scenario:
Watch for confirmation around the support zone (~11B). A higher low or bullish engulfing pattern could trigger a rally toward 14B–15B resistance.
🛑 Bearish Invalidator:
A clean break and close below the 11B zone would invalidate the current bullish thesis.
GOLD - Cut n Reverse Region? Holds or not??#GOLD.. .market just reached at his current major supporting area/region.
That is around 3340-45
Keep close and stay long above that.
NOTE: we will go for cut n reverse below 3340 on confirmation.
Good luck
Trade wisely

BTC 1H Analysis – Key Triggers Ahead | Day 8💀 Hey , how's it going ? Come over here — Satoshi got something for you !
⏰ We’re analyzing BTC on the 4-hour timeframe , Bitcoin is pushing toward its all-time high with a massive, high-volume whale candle .
👀 After breaking through its resistance zones, Bitcoin surged toward its ATH but faced rejection and selling pressure near that level. Key potential support areas are the 25 and 99 moving averages, marked in yellow and sky blue on the chart. The 25 MA is close to the 0.61 Fibonacci level, around $118,000, and is moving toward the average of the last 25 candles. A reaction to this moving average could indicate whether Bitcoin will rebound or drop further .
⚙️ Bitcoin’s key RSI zone is at 55.25, which corresponds to the $118,000 range. Breaking below this could push RSI under 50 .
🎮 Fibonacci retracement drawn from the breakout and pullback of the V-pattern shows that the 0.13 and 0.23 levels failed under selling pressure, sending BTC toward lower support levels. The current support based on Fibonacci is at 0.37. If this is lost, BTC could range on the 4-hour chart between 0.37 and 0.61 .
✉️ Tomorrow at 8:30 AM New York time, the official CPI (Consumer Price Index) report will be released by the U.S. Bureau of Labor Statistics. This news can significantly impact the crypto market — if inflation decreases, purchasing power rises , and Bitcoin could set a new all-time high .
🕯 BTC trading volume and activity are strong in both directions. Each price surge is followed by a quicker consolidation, and corrections occur under selling pressure .
🔔 An alert zone is set at the 0.13 Fibonacci level to observe price behavior when it reaches that point, then decide on the best course of action .
📊 A break below Tether dominance at 4.10% would signal a long position on BTC, while a break above 4.20% could lead BTC into a deeper correction .
🖥 Summary : Tomorrow’s CPI news could spark large, powerful candles and potentially a new ATH for Bitcoin. If U.S. inflation increases, stronger selling pressure is possible. There’s no specific trigger for this current level, but breaking 0.13 will prompt me to open a position — or at least take trades on altcoins with a bullish correlation to Bitcoin .

Skeptic's Night Byte: How to Catch Altcoin MovesHey, welcome to the first episode of the Skeptic's Night Byte
In this quick lesson, we’ll dive into how to spot when liquidity moves from Bitcoin into altcoins .
Each video is about 60 seconds, giving you fast, no-fluff insights to help improve your trading game :)
If you find this useful, give it a boost and share it with your trading circle.
Let’s get started!

BTCUSD BITCOIN Bitcoin has now triggered my trade and now I await it, to return to the upside and provide profits , I shall partial close if necessary

ETHUSD surpassed 4,000.00 level, ready to retestETHUSD surpassed 4,000.00 level, ready to retest
ETHUSD has been trading bullish since last August 7 due to the same fundamental reasons as bitcoin. U.S. retirement policy is planning to include crypto into 401(k) retirement accounts. Additionally, Alaska summit between Trump and Putin on August 15 may favor risky assets due to the geopolitical risks are getting lower.
Technically, the price shows bearish divergence on 1-h timeframe. Price may decline towards crucial 4,000.00 level. However, next bullish development is expected afterwards with possible target of 4,600.00

BTCUSD nearby ATHBTCUSD nearby ATH
Recently Bitcoin surged on 2.3 % after reports that President Trump plans to sign an executive order allowing crypto and other alternative assets into 401(k) retirement accounts. The order directs the Labor Secretary to work with the Treasury, SEC, and other regulators to revise ERISA guidance, which typically excludes assets like crypto, real estate, and private equity from retirement plans, aiming to reduce legal barriers for their inclusion.
Technically, the bitcoin is nearby ATH at 123,250.00. Price has developed a new bullish momentum and is ready to grow further with possible target at 130,000.00.
