TradeCityPro | WLD Builds Pressure Inside Long-Term Range👋 Welcome to TradeCity Pro!
In this analysis, I want to review the WLD coin for you. It’s one of the Privacy and Identity coins with a market cap of $1.5 billion, ranked 55 on CoinMarketCap.
⏳ 4-Hour Timeframe
In the 4-hour timeframe, a ranging box has formed for this coin between the 0.855 and 0.969 zones, and it’s been fluctuating within this range for several weeks.
📊 Volume is gradually decreasing within this box, which could indicate that a move is approaching.
⚡️ For now, we can say the volume slightly favors buyers, as the green candles have more volume than the red ones. Additionally, the size and strength of the green candles are greater, which increases the likelihood of the box breaking upward.
📈 If the price moves up toward the 0.969 zone with increased volume, we can enter a long position upon breaking 0.969.
✔️ Alternatively, if the price is supported at the 0.855 bottom, we could also open a long position—but it’s riskier, and in my opinion, not worth it. It’s better to wait for the main trigger to activate.
🔽 For a short position, if the price forms a lower high below 0.969 and then moves toward 0.855, we can open a short if 0.855 breaks. The next support zone would be 0.795.
📝 Final Thoughts
This analysis reflects our opinions and is not financial advice.
Share your thoughts in the comments, and don’t forget to share this analysis with your friends! ❤️
Tradingview

BTC's Situation, A Comprehensive Analysis !!!Bitcoin is now at a point where it cannot be ignored! In my view, the bullish wave has started after the corrective wave ended. This wave could continue until it breaks the ascending triangle, then with a slight correction, push the price upward again. The current period and the coming days could be crucial in determining the market's trend.
Best regards CobraVanguard.💚

TradeCityPro | Bitcoin Daily Analysis #120👋 Welcome to TradeCity Pro!
Let’s dive into the Bitcoin analysis and key crypto indices. As usual, in this analysis I want to review the futures triggers for the New York session.
⏳ 1-Hour Timeframe
In the 1-hour timeframe, as you can see, Bitcoin has finally broken out of the range it formed yesterday and is now moving upward.
✔️ If this upward move continues, we can open a long position in these zones by getting confirmation in the lower timeframes. The main long trigger is still activated after breaking 110256.
💥 The RSI oscillator entered the Overbuy zone in the previous candle. We need to see how the price reacts to this move and what impact this oscillator will have on the price.
⚡️ In my opinion, this RSI move won't have much impact. Although the price is moving upward, the main trend has not yet formed, so there's no real momentum in the market, and RSI is basically useless for now.
✨ If this upward move turns out to be fake, we can enter a short position with the 107853 trigger.
👑 BTC.D Analysis
Let’s look at Bitcoin Dominance. Yesterday, dominance had an upward move and broke its ascending trendline but failed to stabilize above 65.52, resulting in a fake breakout and a move downward.
☘️ The fake breakout trigger for the trendline was the 65.38 zone, which was activated, and now the price is heading downward. If this move continues, the next target will be 65.04.
📅 Total2 Analysis
Alongside Bitcoin’s upward move, this index also activated the 1.14 trigger and is moving up, now reaching 1.15.
💫 If the move continues, the next entry trigger is at 1.17, which is still quite far from the current price.
📅 USDT.D Analysis
Looking at Tether Dominance, the 4.82 trigger was activated, and dominance is now moving down, having reached 4.78.
📈 If it stabilizes below 4.78, we can confirm the continuation of the downtrend in dominance, which could push it down to 4.72.
❌ Disclaimer ❌
Trading futures is highly risky and dangerous. If you're not an expert, these triggers may not be suitable for you. You should first learn risk and capital management. You can also use the educational content from this channel.
Finally, these triggers reflect my personal opinions on price action, and the market may move completely against this analysis. So, do your own research before opening any position.

TradeCityPro | 1INCH Tests Supply Zone After Strong Bounce👋 Welcome to TradeCity Pro!
In this analysis, I want to review the 1INCH coin for you. It’s one of the DeFi coins, with a market cap of $256 million, ranked 162 on CoinMarketCap.
⏳ 4-Hour Timeframe
As you can see in the 4-hour timeframe, this coin is sitting on a support floor at the 0.1668 zone and has formed a range box at this bottom.
🔔 There’s a key supply zone at the top of this range box, which I’ve marked as a range for you, and currently, the price is inside this zone.
📊 Given the significant buying volume that has entered this coin, the price has penetrated into this range and is testing it for the several-th time.
✨ If this range is broken, we can confirm the bullish reversal of this coin and open a long position. Volume has already given us confirmation, and if RSI enters the Overbuy area, that will be our momentum confirmation.
🔼 The next resistance levels for this coin—which we can consider as targets—are 0.2031 and 0.2207.
✔️ If the price gets rejected from this zone, it may move back down toward the 0.1668 floor. For a short position, we can enter if 0.1668 is broken.
📉 However, if we get confirmation of rejection from the zone, we can look for an early entry trigger in the lower timeframes.
📝 Final Thoughts
This analysis reflects our opinions and is not financial advice.
Share your thoughts in the comments, and don’t forget to share this analysis with your friends! ❤️

TradeCityPro | Bitcoin Daily Analysis #119👋 Welcome to TradeCity Pro!
Let’s go over the analysis of Bitcoin and the key crypto indexes. As usual, in this analysis I’m going to review the futures triggers for the New York session.
⏳ 1-Hour Timeframe
Yesterday, the price broke out of the range box between 108619 and 110256 that I had marked for you, and with the heavy selling volume that entered the market, this bearish move took place.
✔️ This move continued to the 107448 zone, and as you can see, we are now in a consolidation and rest phase, and once again the volume has dropped significantly.
✨ As I mentioned in yesterday’s analysis, I believe this low volume will persist through the weekend, and for a solid move to happen, we’ll need to wait for the new week to begin.
💥 For now, the price has room to move up to 108619 and perform a retracement. A break above the 50 zone on the RSI greatly increases the likelihood of this move.
📊 If selling volume re-enters the market and the price moves downward, the short trigger we have is the 107448 level, and breaking it could start the next bearish leg.
📈 For a long position, the price must first stabilize above 108619, and then, if we see that buying volume continues and increases, we can enter a long position. The main trigger will be 110256.
⭐ I myself won’t be opening any positions for now and will wait until the market shows some proper volume and trend before entering. If you plan to open a position based on these triggers, I suggest you take on very little risk so that in case your stop-loss is hit, you don’t lose much money.
👑 BTC.D Analysis
Let’s look at Bitcoin dominance. Yesterday, dominance touched the trendline I had marked and is still dealing with this dynamic resistance.
💫 A bottom has formed at 65.38. If this bottom is broken, we’ll get confirmation of rejection from the trendline, and dominance could have a bearish move down to 65.04.
⚡️ If the trendline is broken instead, we’ll have a new trigger at 65.52, and breaking it would confirm a bullish reversal in dominance. The main trigger will still be a break of 65.64.
📅 Total2 Analysis
Now let’s move on to Total2. This index dropped to the 1.13 zone and has now pulled back to 1.14. It seems like it’s getting ready for another downward move.
☘️ If Bitcoin dominance gets rejected from the trendline and moves down, and if Bitcoin moves upward, Total2 could make a very sharp move.
🔑 Even if Bitcoin drops, Total2 might range or even move up. For now, our short trigger is 1.13, and aside from 1.14, we don’t have any specific long trigger.
📅 USDT.D Analysis
Finally, let’s look at Tether dominance. This index made a bullish move to 4.85 after breaking 4.78 and is now in a corrective phase.
📊 If 4.85 is broken, the next bullish leg could continue up to 4.93. If a correction happens, dominance might pull back to 4.78.
❌ Disclaimer ❌
Trading futures is highly risky and dangerous. If you're not an expert, these triggers may not be suitable for you. You should first learn risk and capital management. You can also use the educational content from this channel.
Finally, these triggers reflect my personal opinions on price action, and the market may move completely against this analysis. So, do your own research before opening any position.

TradeCityPro | AVAX Holds Key Support in Sideways Structure👋 Welcome to TradeCity Pro!
In this analysis, I want to review the AVAX coin for you. It’s another Layer1 and RWA project whose coin has a market cap of 7.48 billion dollars and ranks 16th on CoinMarketCap.
📅 Daily Timeframe
On the 1-day timeframe, as you can see, the price is sitting on a very important and strong support at the 16.46 zone, which I’ve marked as a range for you.
🔍 This range is where buyer makers are heavily present, and the price has touched it three times so far and has been supported each time. This shows the high strength of this zone.
✨ Currently, after being supported from this zone, the price has reached the 18.77 level and is fluctuating below this level. Volume is also gradually decreasing, and we have to see what happens next.
📊 If the volume keeps decreasing like this, the price will probably continue ranging between 16.46 and 18.77 until volume enters the market. But if strong buying or selling volume enters, the price can make a move and exit this range.
✔️ If buying volume enters and the price wants to move upward, we can enter a long position with a break of 18.77 and even buy in spot. A confirmation for this position could be the RSI breaking above the 50 level.
🛒 I personally consider this trigger suitable for a long position, but for spot I suggest waiting for a break of 25.78. More important than that is Bitcoin dominance, and in my opinion, as long as the long-term trend of Bitcoin dominance is bullish, buying altcoins is not logical and we have to wait until dominance changes trend.
📉 If the price wants to move downward and selling volume enters the market, the break of this same support range would be the best trigger. With a break of 16.46, we can enter a short position, and if you already bought this coin in spot, you can activate your stop-loss as well.
💥 A momentum confirmation for this position would be the RSI breaking below the 30 level and the oscillator entering the Oversell zone.
📝 Final Thoughts
This analysis reflects our opinions and is not financial advice.
Share your thoughts in the comments, and don’t forget to share this analysis with your friends! ❤️

VTI 1D: breakout on the daily within a long-term weekly uptrend On the daily chart, VTI (Vanguard Total Stock Market ETF) has broken through the key $303.5 resistance level with strong volume. This breakout occurs within a larger weekly uptrend channel, highlighting a continuation of the long-term bullish structure.
Volume profile shows a clear path ahead: $321.7 (1.272 Fibo) and $345 (1.618 Fibo). The golden cross (MA50 crossing MA200 from below) further supports the bullish case.
Fundamentally, VTI represents the entire U.S. equity market - large to small caps - and benefits from economic resilience, declining inflation, and passive inflows. It’s a logical macro play for trend continuation.
Tactical plan:
— Entry by market or after retest $303.5
— TP1: $321.7
— TP2: $345
— Invalidation below $300
The whole market breaking out? That’s not noise — it’s the signal.

BTCUSDT - single support, short below.#BTCUSDT.. .market placed a very reasonable low tha tia around 107200
Keep close it and short below that only.
Good luck
Trade wisely

TradeCityPro | Bitcoin Daily Analysis #118👋 Welcome to TradeCity Pro!
Let’s dive into the Bitcoin analysis and key crypto indexes. As usual, in this analysis, I’ll review the futures triggers for the New York session.
⏳ 1-Hour Timeframe
On the 1-hour timeframe, the price remains within the same range box between 108619 and 110256, and it is currently sitting at the bottom of that box.
✔️ Since yesterday, market volume has significantly declined — as you can see, there's practically no real volume in the market.
⭐ On the other hand, it seems the 108619 trigger is about to be activated, and price may move downward. However, personally, as long as market volume stays this low, I prefer not to open any positions.
📊 If we see selling volume entering the market following a break below 108619, I’ll consider opening a short position. But in the current situation, as mentioned, I prefer to stay out of the market.
💥 The RSI oscillator is steadily and gradually declining like a waterfall. This is also due to the lack of volume in the market, which has led to very low price volatility.
⚡️ So for now, it's better not to rely on RSI data because without volume, RSI readings won't be useful.
📈 If the price gets supported at the 108619 level with a good buying volume and starts moving toward 110256, the chance of breaking that level will increase significantly.
👀 If that happens, I’ll personally try to open a long position once 110256 breaks. But I think today, Saturday, and Sunday will remain the same in terms of market conditions, and real volume will likely return starting next week.
👑 BTC.D Analysis
Moving on to Bitcoin Dominance, a descending trendline can be drawn here, which has been tested twice and is now being approached again.
☘️ If BTC dominance gets rejected from this trendline and moves downward, it will likely reach the 65.04 support level. If the trendline breaks, the next resistance will be 65.64.
📅 Total2 Analysis
Looking at Total2, you’ll notice it’s showing more bearishness than Bitcoin and has lost the support it formed at the 1.15 level.
💫 This happened because BTC dominance has been rising since yesterday, which means more money has been flowing into Bitcoin than into altcoins.
🔼 The next support level for Total2 is at 1.13, and a potential downside move may reach this zone. The suitable long trigger remains a break above 1.17.
📅 USDT.D Analysis
Finally, USDT Dominance has exited the range box it had formed and climbed back above the 4.78 level.
🎲 If this upward move continues, the next major resistance will be 4.90. However, if this move turns out to be fake, the short trigger for a bearish reversal will be a break below 4.72..
❌ Disclaimer ❌
Trading futures is highly risky and dangerous. If you're not an expert, these triggers may not be suitable for you. You should first learn risk and capital management. You can also use the educational content from this channel.
Finally, these triggers reflect my personal opinions on price action, and the market may move completely against this analysis. So, do your own research before opening any position.

GOLD - at CUT n REVERSE Area? holds or not??#GOLD.. market palced around 3317 18 as day low so far but hour closed above 3323 that was our area.
so keep close our region that is around 3320 to 3323
that is our ultimate region for now and if market hold it in that case we can expect bounce again
NOTE: below 3320 we will go for cut n reverse on confirmation.
good luck
trade wisely
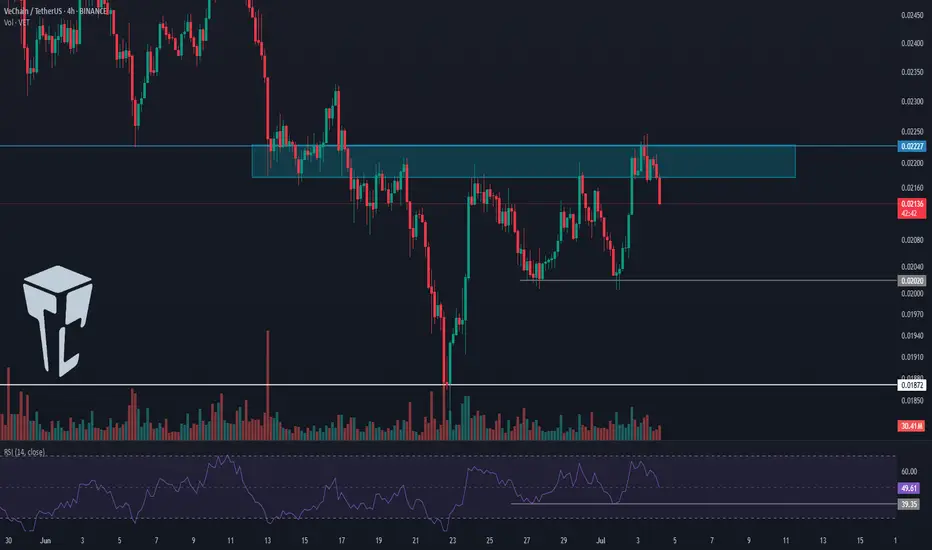
TradeCityPro | VET Battles Key Resistance Amid Buyer Momentum👋 Welcome to TradeCity Pro!
In this analysis, I’m going to review the VET coin for you. VET is a Layer1 and RWA project with a market cap of 1.84 billion dollars, currently ranked 44 on CoinMarketCap.
⏳ 4-Hour Timeframe
On the 4-hour timeframe, as you can see, this coin experienced a downtrend and eventually reached the 0.01872 bottom. It then received support from that level and began a bullish move.
✨ Right now, a significant resistance is located at 0.02227, which I’ve marked on the chart as a supply zone. So far, it seems the price has been rejected from this area.
🔍 Price has attempted to break this zone three times already. Each time, although it managed to penetrate further, it still failed to break through and got rejected.
💥 With each rejection, the RSI oscillator has also been rejected from near the 70 level and moved downward. If, in future attempts, the RSI enters the Overbuy area, the probability of breaking 0.02227 will significantly increase.
📊 Currently, market volume favors buyers. The buying volume on green candles has increased noticeably. Meanwhile, during the rejection from the resistance zone, the selling volume was very low, which signals strong buyer control.
⚡️ If the downtrend continues and price fails to form a higher low above 0.02020, we can enter a short position upon the break of 0.02020. A break of 39.35 on the RSI would be a solid momentum confirmation for this setup.
📉 The main short position can be opened upon the break of 0.01872. This would confirm the continuation of the downtrend and could lead to a sharp downward move.
📝 Final Thoughts
This analysis reflects our opinions and is not financial advice.
Share your thoughts in the comments, and don’t forget to share this analysis with your friends! ❤️
Skeptic | Dogwifhat (WIF): Precision Triggers for Spot & FuturesWelcome, traders, Its Skeptic! 😎 Is Dogwifhat (WIF) the next meme coin rocket or a risky gamble? I’m diving into a pro-level breakdown of WIF, the Solana-based meme coin with a $882.06M market cap, ranked #75 globally. This analysis covers recent performance, ecosystem strengths, and technical triggers for spot and futures trading, grounded in cycle-based strategies. Trade with no FOMO, no hype, just reason. Let’s dissect WIF! 🚖
📰 Recent Performance & Key Events
Dogwifhat (WIF) , a Solana-based meme coin launched in late 2023, trades at 0.886 with a $882.06M market cap, ranking #75 globally. Featuring a Shiba Inu in a pink beanie, it leverages Solana’s high-speed, low-fee blockchain and a deflationary burn mechanism with a 998.9 million token supply. Listed on major exchanges like Binance, KuCoin, and Gate.io, WIF enjoys strong liquidity. In July 2025, it’s up 5.26% in 24 hours and 24.57% over 7 days, with a 24-hour trading volume of $450M. However, it’s down 80.94% from its all-time high of $4.84 (March 31, 2024), reflecting meme coin volatility :)
Technical & Market Position
WIF benefits from Solana’s scalable ecosystem, a hub for DeFi and NFTs, with 160,000+ TPS and low fees, outpacing slower networks. Its community-driven appeal, active on X, Reddit, and Discord, fuels its momentum, with posts highlighting a cult-like following. Compared to Pepe ($4.08B market cap, 456,000+ holders, 37% holding over a year), WIF’s smaller but vocal community shows dedication. However, its lack of real-world utility and reliance on social media hype mirror Pepe’s 25.7% year-to-date drop, raising concerns about sustainability.
Risks : Speculative volatility, pump-and-dump schemes, and dependence on Solana’s performance and social media sentiment make WIF a high-risk bet. Use stop loss to manage swings.
📈 Technical Analysis
Daily Timeframe
The Weekly (HWC) is bearish, entering a major bearish trend after forming a double bottom and breaking support. However, the Daily (MWC) started an uptrend, achieving 350 % growth before correcting to the 0.5 Fibonacci retracement —a healthy correction without breaking the uptrend momentum. Key support zones are $0.635–$0.679 . A break below could resume the Weekly bearish trend, so stay alert.
Spot Trigger (Long): Break above resistance at $ 1.047 , confirmed by a volume surge (ideally 2x the average of the prior 5–7 candles). Volume is critical—technical analysis is an art, not a science, so don’t fixate on exact numbers.
Key Insight: The Daily uptrend holds, but a volume spike is essential to confirm bullish moves and avoid fakeouts.
4-Hour Timeframe (Futures Triggers)
On the 4-hour chart (LWC), for longs:
Trigger: Break of the downward trendline and resistance at $ 0.958 , with volume confirmation (strong volume seen in the prior uptrend leg). Additional confirmation: RSI re-entering overbought.
Shorts: No short trigger currently. Despite the Weekly bearish HWC, the Daily MWC uptrend and strong support at $0.635–$0.679 make shorting illogical. Wait for a support break and MWC turning bearish for a safer short with better R/R.
Pro Tip: Longs are viable with volume and RSI confirmation. Avoid shorts until the MWC aligns bearish to minimize fakeout risk. Always use MAX 1%–2% risk per trade.
Final Vibe Check
This WIF breakdown delivers precise triggers for spot ($1.047) and futures ($0.958 long, no short yet), leveraging cycle-based strategies. With a bearish Weekly but bullish Daily, prioritize volume confirmation to navigate meme coin volatility. Solana’s ecosystem and exchange listings give WIF an edge, but its hype-driven nature demands caution. Want more cycle setups or another pair? Drop it in the comments! If this analysis sharpened your game, hit that boost—it fuels my mission! 😊 Stay disciplined, fam! ✌️
💬 Let’s Talk!
Which WIF trigger are you watching? Share your thoughts in the comments, and let’s crush it together!

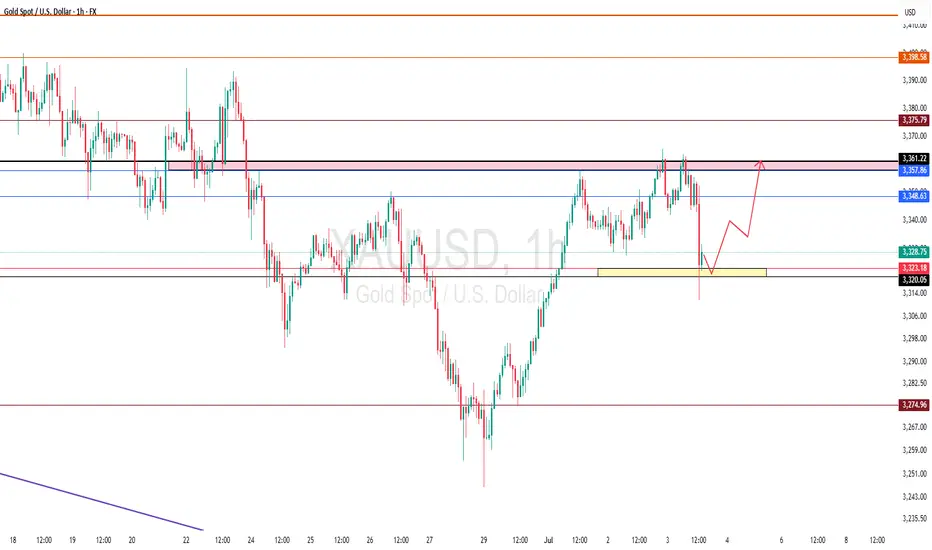
Gold (XAUUSD) – July 4: Structure Shift & Short BiasYesterday’s price action (July 3) delivered a crucial structure break that changes our short-term trading outlook.
We were expecting a bullish continuation with a clean break above the 3365 M15 swing high .
Price reached as high as 3364, but failed to break the high — showing early signs of exhaustion.
Then came the PMI news release, triggering a sharp drop that broke the M15 Higher Low and shifted structure.
🔻 Structure Has Shifted
As of today, July 4, the intraday market structure has flipped from bullish to bearish.
✅ M15 trend: Now in a confirmed downtrend
✅ H4 trend: Entering a pullback phase
❌ Previous bullish continuation setup is invalidated
We now adjust our approach to align with the new structure — not the old expectation.
📉 Updated Bias: Short
With M15 and H4 now aligned in pullback, our active bias is bearish.
This means:
• We are not planning any long trades until structure shifts back
• Focus shifts to short setups only, executed with discipline
🔍 Intraday Short Setup Plan – July 4
We are watching for price to retrace into valid M15 POI zones before resuming the downtrend.
🔸 First zone to watch:
• 3348–3352 → M15 POI with strong probability for rejection
🔹 Execution Rule:
→ If price enters this zone
→ And we see M1 confirmation (ChoCh + micro BoS)
→ We will plan a short entry, with structure-based SL and minimum 1:3 RR
🎯 Downside Levels Ahead:
If bearish momentum continues, the next potential reversal/support zone is:
📍 3280–3285
→ This will be a key area to observe for signs of exhaustion or base formation
→ Until then, trend remains valid to the downside
🧭 Final Thoughts:
This shift from bullish to bearish bias is a textbook example of why we follow structure — not predictions .
The market gave a clean BoS at 3358, but failed to follow through.
Instead of forcing the long, we’ve now flipped bias in line with the chart’s reflection.
📖 Let the chart guide your thinking.
Structure reveals the direction.
Confirmation controls the execution.
The chart is the mirror.
📘 Shared by @ChartIsMirror
Author of The Chart Is the Mirror: Mastering Gold with Structure, Stillness, and Price Action

Skeptic | SUI Breakdown: Precision Triggers for Spot & FuturesWelcome, traders, its Skeptic! 😎 Ready to unlock SUI’s next big move? I’m delivering a pro-level breakdown of SUI, the #12 crypto with a $10.4B market cap.This Analysis dives into recent performance, ecosystem growth, and technical triggers for spot and futures trading, all rooted in cycle-based strategies. Trade with no FOMO, no hype, just reason , Let’s conquer SUI! 🚖
Recent Performance & Key Events
SUI , trading at $ 2.98 with a $ 10.4 billion market cap, ranks as the # 12 cryptocurrency globally. A Layer-1 blockchain using the Move programming language, it boasts parallel transaction processing with over 160,000 TPS. In July 2025, SUI showed strong momentum, surging 10% in 24 hours and 12% weekly after bottoming in the $2.30–$2.40 range. However, a 44 million token unlock ($122M) on July 1 introduces potential selling pressure. 📊
Technical & Market Position
SUI’s Total Value Locked ( TVL ) reached $ 2.1 billion in early 2025, ranking it the 8th largest blockchain by TVL. Its DeFi ecosystem is exploding, with stablecoin volume jumping from $ 400M to $ 1.2B . Bitcoin integration and a Microsoft partnership bolster institutional adoption, signaling strong fundamentals despite volatility.
Technical Analysis
Daily Timeframe
The Daily (HWC) is in an uptrend, holding above the upward trendline (marked in blue). The major trend remains bullish unless this trendline breaks. However, the MWC is bearish, with declining volume during recent price rises suggesting a secondary corrective trend rather than a primary bullish trend. As Mark Andrew Lim notes in The Handbook of Technical Analysis, rising prices need increasing volume to confirm trader conviction and bullish momentum. Low volume indicates trend weakness, typical of corrective moves.
Spot Trigger (Long): Break of the downward corrective trendline with consolidation above resistance at $ 3.0408 . The last series breaking this trendline saw 85 % growth, but don’t rush in. Confirm with:
Falling BTC.D (Bitcoin dominance).
Total 3 long triggers (market-wide altcoin signals).
SUI/BTC uptrend, with an initial trigger on breaking its downward trendline and a primary trigger at 0.00003998 resistance.
Key Insight: Volume confirmation is critical. Without a volume surge on breakout, the risk of fakeouts is high.
4-Hour Timeframe (Futures Triggers)
On the 4-hour chart, if price reacts again at resistance $ 3.0890 , you can go long on a breakout, confirmed by RSI entering oversold. If it rejects sharply, the next long trigger is a break of $3.1606. For shorts, a break below support at $2.6593 is a strong trigger, especially with volume confirmation.
Pro Tip: Volume is king for all triggers. Without a volume spike on breakout, fakeout risk is high. Always apply capital management—1%–2% risk per trade to stay safe.
Final Vibe Check
This SUI Analysis equips you with precise triggers for spot ($3.0408) and futures ($3.0890/$3.1606 long, $2.6593 short) trading, leveraging cycle-based strategies. Want more cycle setups or another pair? Drop it in the comments! If this analysis sharpened your edge, hit that boost—it fuels my mission! 😊 Stay disciplined, fam! ✌️
💬 Let’s Talk!
Which SUI trigger are you eyeing? Share your thoughts in the comments, and let’s crush it together!

TradeCityPro | Bitcoin Daily Analysis #117👋 Welcome to TradeCity Pro!
After nearly 20 days of inactivity on this channel, we’re back with our regular analyses. As the first post in this new round, I’ll continue the Bitcoin series and present analysis number 117.
✅As usual, the analysis is done on the 1-hour timeframe to identify potential futures triggers for the New York session.
📰 Before diving into the charts, let’s briefly look at the market fundamentals. Over the past three weeks, we’ve had the news of the conflict between Iran and Israel. Aside from the initial couple of days, it didn’t have a significant impact on the market, and eventually, the market stopped reacting to it. Right now, the two countries have agreed to a ceasefire and seem to be negotiating.
🔍 In my opinion, the market is unlikely to care anymore whether this war continues or not. Whether they reach an agreement or not probably won’t make a big difference to the market.
🔑 The other major event was the Federal Reserve meeting. Everyone was expecting Jerome Powell to provide some clear outlook regarding US monetary policy, but once again, that didn’t happen. Powell didn’t provide any meaningful data.
📊 This uncertainty led to minimal market volatility and prevented any strong legs from forming, with no significant volume entering the market as everyone was waiting for Powell’s remarks. Since that didn’t yield much, the market remains indecisive for now.
💥 We’ll have to wait and see what kind of impactful news comes in the future. Until then, it’s best to remain patient.
⏳ 1-Hour Timeframe
On the 1-hour chart, you can see a bullish move that started from the 105370 zone, and with strong buying volume, price broke through 108619 and reached the top of 110256.
✨ Currently, price has only wicked into 110256 and hasn’t shown a decisive reaction to it yet. If it revisits this zone, we’ll be able to observe its real reaction to the supply level.
🔔 The current support zone is 108619, which has already received a bounce, forming a range box between 108619 and 110256.
📈 If the 110256 level breaks, the upward move could continue with another bullish leg.
🔽 For short positions, the first trigger would be a confirmation below 108619. But for a more reliable short, I would wait for the price to form a lower high and a lower low below that zone before entering.
👑 BTC.D Analysis
Bitcoin dominance is currently hovering around a key support at 65.04. A key resistance sits at 65.64, which would be the first trigger for bullish continuation.
⭐ The main breakout level for starting a new bullish trend in dominance would be 65.97. For bearish confirmation, a break below 65.04 would suffice.
📅 Total2 Analysis
Looking at Total2, a range box has formed between 1.15 and 1.17, with price oscillating in between.
🧩 Momentum is currently bullish, and there’s a high chance of breaking above 1.17. If this level is broken, we could see another bullish leg and a long position would be valid.
📉 For shorts, a break below 1.15 would be the first signal, but I personally prefer to wait for a clearer trend change before entering any short positions.
📅 USDT.D Analysis
USDT dominance is also ranging between 4.72 and 4.78, very similar to Total2.
📊 A break below 4.72 would confirm a bearish move, while a break above 4.78 would indicate bullish continuation for dominance.
❌ Disclaimer ❌
Trading futures is highly risky and dangerous. If you're not an expert, these triggers may not be suitable for you. You should first learn risk and capital management. You can also use the educational content from this channel.
Finally, these triggers reflect my personal opinions on price action, and the market may move completely against this analysis. So, do your own research before opening any position.

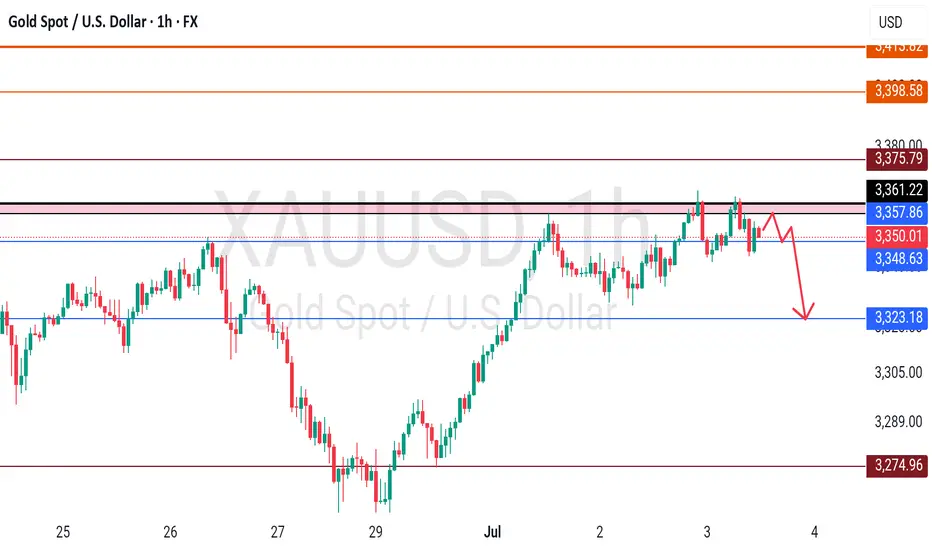
GOLD - High placed? Short now?#GOLD... market placed 3362-64 after our last idea regarding gold buying.
And market behaved indicate us that that is a final high for now and below that a dip can be possible.
So keep close and don't buy until market holds..
Good luck
Trade wisely
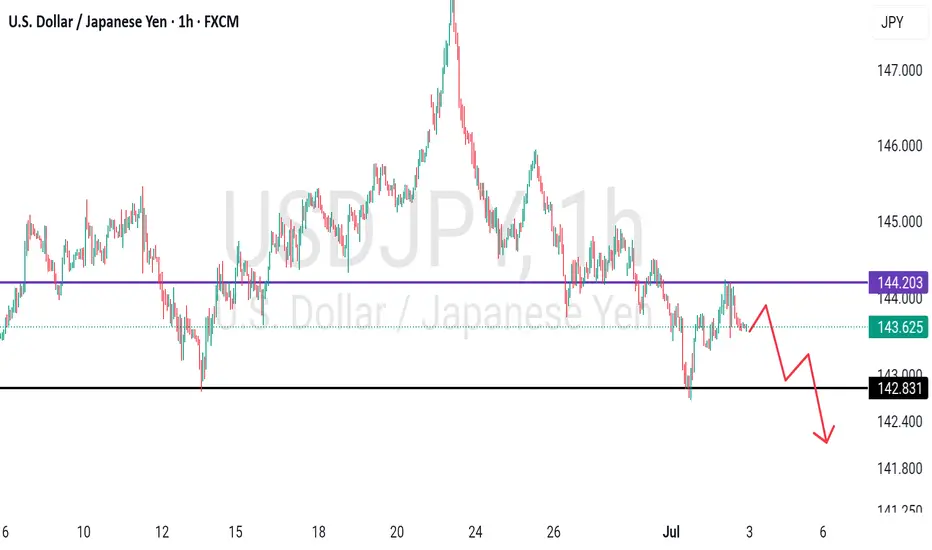
USDJPY - placed reasonable high? What's next??#USDJPY.. market placed 144.20-25 day high in yesterday and that is a very reasonable high.
If market hold it in that case we can expect drop from here.
Don't be lazy here.
Good luck
Trade wisely
GOLD - it's breakout? What's next??#GOLD... perfect move as per our last analysis and now market just broke his current resistance area that was 3348-49 and 3353-54
So keep close and if market hold these areas then upside further bounce expected.
Good luck
Trade wisely

BTC's Situation, A Comprehensive Analysis !!!The situation has become quite strange. Bitcoin is forming deceptive patterns, and altcoins continue their downward trend. Currently, Bitcoin is positioned within two triangles—one symmetrical and the other descending. Now that Bitcoin has reached the top of the triangle and appears ready to break upward, it might actually be hiding yet another trap within the price action.
This market has shown disregard for technical patterns, and every time the price approaches historically significant levels, it reveals its true intentions and disappoints us. This cycle tends to repeat.
In my opinion, we’re likely to see one more drop in Bitcoin’s price. After that, instead of continuing the expected downtrend from the pattern, the price could break the descending formation and experience a strong upward move.
Stay Awesome , CobraVanguard.

CAD/JPYSince my ascending triangle formation has violated its characteristics it is no longer valid. I took this opportunity to revisit this pair and start again. I still believe price is operating from the Double Bottom Formation so I'm still looking for price to go up. Here we have 4 touches on our Trendline & A Expanding Flat Formation (highlighted in blue letters). I have entered a position after the 4hr close but im still looking for a retrace for a better position.

GOLD - Range bound, Need to stay calm??#GOLD.. .be ready for a headache range bound move guys,
It will be very choppy so don't be panic and dont expect too much.
It will be messy.
Good luck
Trade wisely

GOLD - at CUT n REVERSE area? Holds or not??#GOLD ... Perfect holdings of our upside resistance area that was actually 3357
And now market just at his current ultimate supporting area, that is 3336-37
Keep close that area and if market thold it in that case we can expect again bounce otherwise not.
NOTE: we will go for cut n reverse below 3336-37
Good luck
Trade wisely

Q3 Could Be Big for #ETH, Breakout Watch ON#ETH bounced exactly from the 0.5 level of Fib Retracement, as expected.
Now it appears to be gearing up for its next breakout move!
After weeks of chopping inside a falling channel, ETH is showing signs of strength. It's reclaiming key levels and slowly pushing toward the breakout zone near $2,520.
A breakout above this resistance could trigger a sharp move toward $2,880 and beyond.
However, bulls need to hold the $2,300 zone, a drop below might delay the pump.
Structure is bullish, just needs confirmation.
IMO, Q3 could be massive for ETH.
Like & retweet for more updates.
#Ethereum
