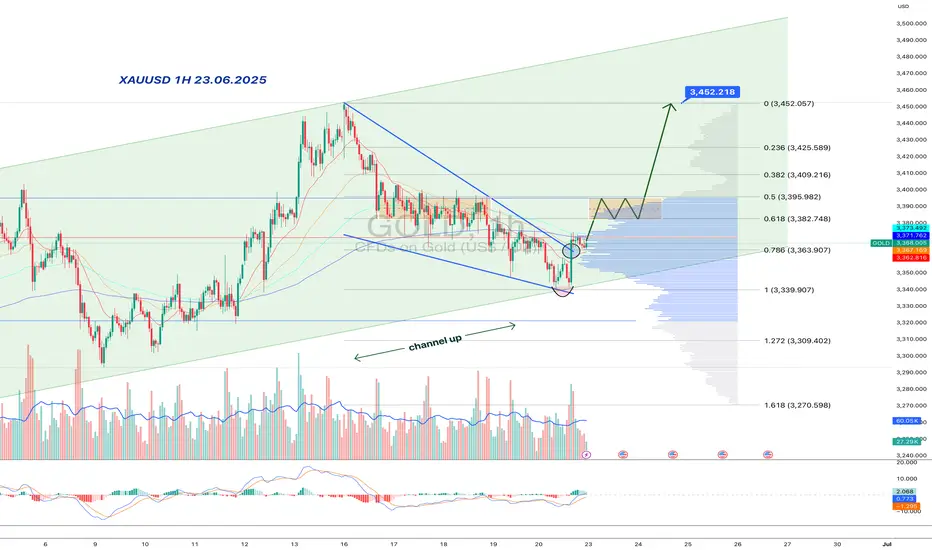
Gold:bullish wedge inside a rising channel-double trap for bearsInside the major upward channel, gold formed a falling wedge — and, of course, faked a breakdown. But the move reversed quickly: price reclaimed the wedge, surged on volume, and held above the key 3363–3368 area. This isn't just a bounce — it's a structural reclaim in line with the broader trend.
Price is now in the upper part of the rising channel and has broken a local downtrend line, reinforcing the bullish signal. Consolidation around 3380–3395 might be the last pause before acceleration. Above that lies a volume gap — no resistance until 3452.
MACD is flipping bullish, RSI turning upward, and volume confirms smart money presence. Classic: trap below, breakout above. As long as 3363 holds — longs remain in control.
Tradingview
Skeptic | Weekly Watchlist Top Triggers for Forex, Gold & More!DXY: The Market’s Compass
Let’s kick it off with DXY—the Dollar Index every trader needs to watch to get the market’s big picture.
Daily Timeframe: After a failed break below the critical support at 98.801 , DXY dumped to 97.596 , then pulled back to test 98.801 . With rate cuts looking likely soon , I’m betting on more downside for DXY. The only wildcard? Rising Middle East tensions could spike inflation, push rates higher, and strengthen DXY, hammering crypto and CFD indices.
4-Hour Triggers:
Short: Break below 98.530 —a clean setup to ride down to 97.596 . I’m leaning heavier on this, pairing it with USD-based forex trades for max R/R. 😤
Long: Break above 99.114 —riskier against the trend, so keep stops tight and profits quick.
Pro Tip: Shorts are the safer play here, but watch geopolitical news for sudden reversals.
EURX: Uptrend Power
EURX is flexing some muscle.
Weekly Timeframe: The resistance at 1072.6 looks broken. If we avoid a fakeout and hold above this zone, I’m expecting the major uptrend to keep rolling.
Game Plan: No trigger needed—just confirm a few 4-hour candles above 1072.6, and I’m opening longs on EUR-based pairs. Patience for confirmation is key! 🙌
Pro Tip: Watch for fake breakouts—let the market prove itself before jumping in.
Commodities: Gold & Silver
XAU/USD (Gold)
My gold analysis from last week still holds ( check it if you missed it—it’s got Middle East war scenarios and Bitcoin insights too ). No need to repeat—go read it for the full scoop! 📚
XAG/USD (Silver)
Silver’s been on a wild ride after a massive pump.
4-Hour Timeframe : We’re now in a 4-hour range, which makes sense, and I expect it to linger into next week.
Triggers:
Long: Break above resistance at 37.31559 .
Short: Break below support at 35.56800 .
Pro Tip: If you’re holding my 33.68317 long from last week, don’t close yet—let it ride for more gains. If you’re not in, avoid FOMO and wait for the range break. 😎
Forex Pairs
EUR/USD: Ready to Pop
With EURX in an uptrend and DXY likely breaking support, I’m super bullish on EUR/USD next week.
4-Hour Triggers:
Long: Break above resistance at 1.15429 . No need for RSI or SMA confirmation—just a clean breakout, and we’re in. 🚀
Short: Break below 1.13566—only if EURX’s 1072.6 break turns out to be a fakeout.
Pro Tip: Longs are the play here—keep it simple and ride the breakout wave.
GBP/USD: Bearish Break
GBP/USD is looking spicy after a downward move.
Daily Timeframe: The upward channel broke to the downside. I cloned the channel and placed it below—support at 1.34090 is massive, with multiple reactions in the past.
4-Hour Trigger: Break below 1.34090 opens a bearish move with high R/R. I’m personally shorting this break. 😤
Pro Tip: This is a key level—set alerts and don’t miss it!
USD/JPY: Range Game
USD/JPY is stuck in a long 4-hour box range.
4-Hour Timeframe: Price keeps testing the ceiling but travels less toward the floor, showing traders want to break up, not down.
Triggers:
Long: Break above ceiling at 146.204.
Short: Break below the upward trendline, then support at 145.194 .
Pro Tip: Longs have more juice—watch for volume on the break.
EUR/CHF: Mirror of USD/JPY
EUR/CHF is vibing like USD/JPY—a 4-hour box range.
4-Hour Triggers:
Long: Break above resistance at 0.94293 .
Short: Break below channel floor at 0.92963 .
Pro Tip: Wait for a clean break—ranges can be choppy!
Final Vibe Check
That’s your Weekly Watchlist , fam! I’ll keep you updated daily as markets shift. Stay safe with capital management—max 1% risk per trade, no excuses. This week’s loaded with banger triggers, so sit down now, analyze, and set your alerts so you don’t miss a single move. Let’s make it a profitable week! 🚨
💬 Let’s Talk!
If this watchlist got you hyped, smash that boost—it means the world! 😊 Got a pair or setup you want me to hit next? Drop it in the comments. Thanks for rolling with me—keep trading sharp! ✌️

BTCUSDT - major support, Cut n Reverse Area??#BTCUSDT... market just r ached at his one of the most expensive area of the week and month
Keep close 101200
That is our ultimate supporting area.
Note: below 101200 we will cut n reverse on confirmation.
Good luck
Trade wisely

TRX's situation+ Target PredictionFinally, the price broke the wedge, and the price experienced a significant drop. I think is the time for TR to rise again to 0.73 after more correction . STRONG SUPPORT 0.26.
Previous analysis
Give me some energy !!
✨We spend hours finding potential opportunities and writing useful ideas, we would be happy if you support us.
Best regards CobraVanguard.💚
_ _ _ _ __ _ _ _ _ _ _ _ _ _ _ _ _ _ _ _ _ _ _ _ _ _ _ _ _ _ _ _
✅Thank you, and for more ideas, hit ❤️Like❤️ and 🌟Follow🌟!
⚠️Things can change...
The markets are always changing and even with all these signals, the market changes tend to

#Bitcoin is approaching a strong demand zone!#Bitcoin is approaching a strong demand zone!
This level has acted as solid support several times in the past.
According to the Fibonacci levels, we’re currently at the 0.5 level, which makes this area even more significant.
In my opinion, we’re likely to see a bounce from here.
However, if the price fails to hold this level, there’s a good chance we’ll retest the $92K zone.
But for that to happen, we need a daily close below $100K.
Until then, we’re still in a safe zone.
I’ll keep you updated as things develop.
If you find my updates helpful, don’t forget to like and follow for more!
DYOR, NFA

TESLA PRICE ACTION 20JUNE 2025This is the price action of Tesla . I have discussed everything deeply and if you have any doubts then feel free to message or leave a comment.
I am bullish on Tesla.
NOTE:DO NOT SHORT TESLA

GOLD - At CUT n REVERSE Region? Holds or not??#GOLD .. perfect move as per our analysis and now market just at his CUT N REVERSE region, that is around 3367-68 to 3370-71
Keep close that region because that is our ultimate region of the week and month.
Only holdings of that region means you can see again bounce for now otherwise not.
NOTE: we will go for cut n reverse below that region on confirmation.
Good luck
Trade wisely

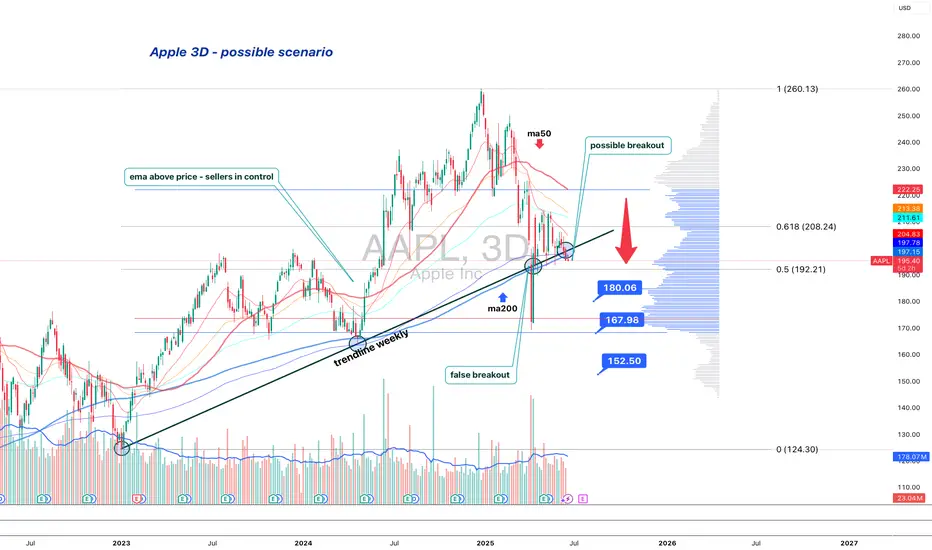
Apple is standing at the edgeApple (AAPL) is losing its long-term structure — second retest of the broken trendline suggests a bearish setup
On the 3D chart, Apple shows signs of structural breakdown. The weekly trendline from 2023 was broken and retested — twice. The price failed to regain it and now trades below, with candles showing weakness: low body closes, upper wicks, and no upside follow-through.
MA200 is now above price, and all EMAs are turning down. Volume Profile shows a heavy resistance block near $197. If the price remains below, sellers are in control.
Key levels:
— $192.20 = 0.5 Fibo support.
— Breakdown ➝ targets: $180 → $167 → $152.
Fundamentals:
Apple's recent reports show decelerating growth, weak China demand, and compressed margins. While AI buzz supports sentiment, institutional flow suggests distribution. BigTech may be topping out, and Apple is positioned for pullback.
Strategy:
Short below $196 with confirmation. Stop: $198. Targets: $180 / $167 / $152.
Failure to reclaim $192–197 = broken trend confirmed.
This is not a growth setup. This is where trends end — and profit-taking begins.
Crude Oil Futures: Navigating Geopolitical Risk and VolatilityMarket Context:
NYMEX:CL1! COMEX:GC1! CBOT:ZN1! CME_MINI:ES1! CME_MINI:NQ1! CME:6E1!
Implied volatility (IV) in the front weeks (1W and 2W) is elevated, and the futures curve is in steep backwardation. This indicates heightened short-term uncertainty tied to geopolitical tensions, particularly in the Middle East involving Iran and Israel. The forward curve, however, suggests the market is not fully pricing in sustained or escalating conflict.
We evaluate three possible geopolitical scenarios and their implications for the Crude Oil Futures market:
Scenario 1: Ceasefire Within 1–2 Weeks
• Market Implication: Short-term geopolitical premium deflates.
• Strategy: Short front-month / Long deferred-month crude oil calendar spread.
o This position benefits from a reversion in front-month prices once the risk premium collapses, while deferred months—already pricing more stable conditions—remain anchored.
o Risk: If the ceasefire fails to materialize within this narrow window, front-month prices could spike further, causing losses.
Scenario 2: Prolonged War of Attrition (No Ceasefire, Ongoing Missile and Air War)
• Market Implication: Front-end volatility may ease slightly but remain elevated; deferred contracts may begin to price in more geopolitical risk.
• Strategy: Long back-month crude oil futures.
o The market is currently underpricing forward-looking risk premiums. A persistent conflict, even without full-scale escalation, may eventually force the market to adjust deferred pricing upward.
o Risk: Time decay and roll costs. Requires a longer holding horizon and conviction that the situation remains unresolved and volatile.
Scenario 3: Full-Scale Regional War
• Market Implication: Severe market dislocation, illiquidity, potential for capital flight, and broad-based risk-off sentiment across global assets.
• Strategy: Avoid initiating directional exposure in crude. Focus on risk management and capital preservation.
o In this tail-risk scenario, crude oil could spike sharply, but slippage, execution risk, and potential exchange halts or liquidity freezes make it unsuitable for new exposure.
o Alternative Focus: Allocate to volatility strategies, defensive hedging (e.g., long Gold, long VIX futures), and cash equivalents.
o Risk: Sudden market shutdowns or gaps may make exit strategies difficult to execute.
Broader Portfolio Considerations
Given the crude oil dynamics, there are knock-on effects across other markets:
• Gold Futures: Flight-to-safety bid in Scenarios 2 and 3. Long positioning in Gold (spot or near-month futures) with defined stop-loss levels is prudent as a hedge.
• Equity Index Futures (E-mini Nasdaq 100 / S&P 500): Vulnerable to risk-off flows in Scenarios 2 and 3. Consider long volatility (VIX calls or long VX futures) or equity index puts as portfolio hedges. In Scenario 1, equities could rally on resolution optimism—especially growth-heavy Nasdaq.
• Currency Futures: USD likely to strengthen as a safe haven in Scenarios 2 and 3. Consider long positions in Dollar and Short 6E futures.
• Bond Futures: Risk-off flows theoretically should support Treasuries in Scenarios 2 and 3. Long positions in 10Y or 30Y Treasury futures could serve as a defensive allocation. Yields may retrace sharply lower if escalation intensifies. However, given the current paradigm shift with elevated yields, higher for longer rates and long end remaining high, we would not bet too heavily on Bond futures to act as safe haven. Instead, inflows in Gold, strengthening of Chinese Yuan and Bitcoin will be key to monitor here.
Scenario-based planning is essential when markets are pricing geopolitical risk in a non-linear fashion. Crude oil currently reflects a consensus expectation of de-escalation (Scenario 1), which opens the door for relative value and mean-reversion strategies in the front-end of the curve.
However, given the asymmetric risks in Scenarios 2 and 3, prudent exposure management, optionality-based hedges, and a flexible risk framework are imperative. A diversified playbook; leveraging volatility structures, calendar spreads, and cross-asset hedges offers the best path to opportunity while managing downside risk.

FED Day: NQ Futures planCME_MINI:NQ1!
Today is FOMC day; however, there is a larger geopolitical risk looming, along with the trade war and tariffs situation unfolding.
Recently, we have noted inflation moving lower, although it is not yet at the FED’s 2% target. Retail sales fell sharply last month. Tariffs have not yet resulted in inflation so far, partly due to the 90-day pause, and with possible extensions, some deals agreed upon, and a framework for others in place, tariff uncertainty has considerably reduced.
On the contrary, lower energy prices that supported lower inflation have risen due to ongoing geopolitical issues. Risks remain high for elevated energy prices even if supply and sea routes remain unharmed. In our view, this is due to the fragility of the situation and what it would take to turn the ongoing war into the worst possible outcome.
The FED releases their Summary of Economic Projections. Key data points will be inflation and growth projections, along with interest rate projections and any talks about neutral rates and expected cuts, given the bleak global outlook and growth. The FED is otherwise expected to hold rates steady in this meeting.
Given this, and what Chair Powell says in the FOMC press conference, their commitment towards driving inflation lower versus maximum employment, risks on the growth and employment side have started to worsen. If rate cut bets are moved forward or if markets price in more rate cuts than currently priced in, we may see equity index futures make further gains.
NQ futures are coiling; the yearly VPOC has shifted higher, as we explained in our previous analysis.
Today’s meeting may be key for further fuel higher or lower, depending on how it pans out. Market participants are in a wait and see mode. Markets are accepting higher prices and break of balance is key to determine the direction price may be headed in. Until otherwise proven, markets are range bound and mean reverting from June Composite Volume Profile towards monthly VWAP and VPOC.

USDCAD - Scalping in the deepHello dear scalpers, this is our next little scalping setup...
With a ratio of 1.14 ^^
I think this will be a nice position in this downtrend situation.

USOIL - Near CUT n REVERSE Area? holds or not??#USOIL.. straight bounce after #IranvsIsrael war situation, and now market just reached near to his current Resistance Area / region
keep close that region and if market holds then drop expected otherwise not at all.
NOTE: we will go for cut n reverse above region on confirmation.
good luck
trade wisely

Skeptic | DXY Crash Alert: Epic Bearish Triggers Unleashed!heyy, traders, what’s good? It’s Skeptic ! 😎 Let’s dive into a full-on breakdown of DXY—the Dollar Index is making waves, and I’m hyped to unpack it. The 98.801 level looks busted with a pullback in play, and I’m expecting more action. Stick with me to the end as we rip through Daily and 4-Hour timeframes to catch the vibe and nail those triggers! 🚖
Daily Timeframe: The Big Picture
So, US inflation data came in softer than expected recently, but DXY still dumped. You might be like, “Wait, shouldn’t lower inflation juice up the dollar?” Nah, here’s the deal: markets move on expectations, not just news. When something grows in the markets, it’s ‘cause traders are betting it’ll keep growing—and vice versa. For DXY, traders are sniffing out a US economic slowdown and expecting the Federal Reserve to cut rates soon, which could spark higher inflation later. That’s the double-whammy driving DXY’s drop, despite the tame inflation numbers. This is the biggest secret in markets—nobody talks about it, but it’s what I learned in econ class and see every day: markets run on expectations. 📚
Major Trend: Per Dow Theory, we’re in a bearish trend as long as we’re below 98.801 .
Game Plan: While under this level, hunt longs on USD pairs like EUR/USD. If we break above 98.801, chill and let the market reform before jumping in.
4-Hour Timeframe: Long & Short Triggers
Now, let’s get to the 4-hour chart for the real action—our long and short triggers:
Short Trigger: A break below support at 98.017 could keep the bearish vibe rolling. RSI hitting oversold would be a dope confirmation. 😤
Long Trigger: Since the major trend is bearish, longs are against the flow, so keep risk tight and take profits quick. The trigger is a break above 98.801, but the main long trigger is smashing through 99.244. So, 99.244 is your go-to for longs. 💪
Pro Tip: Shorts align with the trend, so they’re safer, but longs need extra caution—small positions, tight stops, and don’t get greedy!
Final Vibe Check
That’s the DXY lowdown, fam! Markets are tricky, but if you stick to reasoning over hype, you’ll stay ahead. No FOMO, no hype, just reason —that’s how we roll at Skeptic Lab. Wanna dive deeper into risk management or another pair? Let me know! 🙌
💬 Let’s Talk!
If this analysis got you pumped, smash that boost—it means a ton! 😊 Got a pair or setup you want me to tackle next? Drop it in the comments. Thanks for vibing with me—keep trading sharp! ✌️

Oil Surges on Israel-Iran Nuclear Strike Fears🛢️ Israel’s attacks on Iran’s nuclear sites are pushing oil ( BLACKBULL:WTI , BLACKBULL:BRENT ) higher!
Bloomberg reports Trump’s G-7 exit and Tehran evacuation warning as Israel-Iran strikes intensify (June 17, 2025). Analysts warn of Strait of Hormuz risks, with 17M barrels/day at stake.
4H Chart Analysis:
Price Action: WTI ( BLACKBULL:WTI ) broke $75 resistance (June 2025 high), exiting a 3-week range. Brent ( BLACKBULL:BRENT ) mirrors at $78.
Volume: 4H volume spiked 15% vs. prior week, confirming breakout buying.
Key Levels:
Current Support: $75 (WTI), $78 (Brent) – former resistance, now support.
Next Support: $73 (WTI), $76 (Brent) – prior range lows, tested twice in June.
Context: Oil gained 2% this week, driven by Middle East supply fears, with WTI at a 1-month high.
Trading Insight: The $75/$78 breakouts signal bullish momentum. $73-$76 is a key support zone for dips. Watch Iran retaliation news and volume for supply disruption clues.
What’s your 4H oil trade? Post your setups! 👇 #OilPrice #WTI #Brent #IsraelIran #TradingView

GBPUSD ScalpAs we see, here we have strong and beautiful resistance level.
The price will go down and test previous levels. TP: 1.35659 (30-33pips).

GOLD - at resistance, what's next??#GOLD .. perfect bounce from our supporting area as we discussed in our weekly analysis video and now market have today most important resistance 3398.50
Keep close that area and if market hold then drop expected from here.
Note: we will go for cut n reverse above 3398 on confirmation .
Good luck
Trade wisely

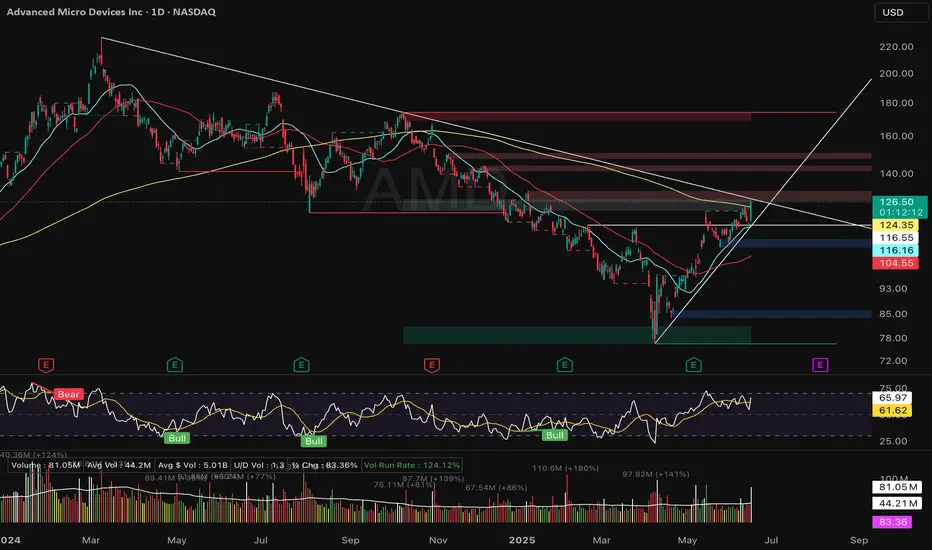
AMD – Breakout Watch (Daily Chart)NASDAQ:AMD surged +9.12% on June 16 with volume 1.8× above average, reclaiming the 200-day SMA for the first time in 7 months.
This marks a clear character change, but not yet a setup. Price stalled into multi-quarter trendline resistance around 128–130.
No pivot, no contraction — just strength into supply. Still needs to consolidate below trendline resistance for a valid trade.
Key Levels:
• Resistance: 130 / 145
• Support: 124.35 (breakout zone), 116.55 (MA stack)
• Watch for: Tight coil, volume dry-up, pivot pattern formation
Not chasing — watching for structure. Patience is a position.
📉 Weekly chart also reclaimed 30-week MA for the first time since Nov ’24.
#AMD #technicalanalysis #breakoutwatch #tradingview
EURUSD 1H. for 50 pips! :)Hello dear traders, this is EURUSD with Nika.
I want to share you this idea, with buy on limit perspective.
We may see this previous and current pattern are strong in connection.
So that's my opinion, about how we may receive some price movement.
It's good trading idea only in low budget. :)
Thank you!

Weekly Market Outlook: FOMC, Trade Deals and GeopoliticsIt is a holiday-shortened week, with the majority of markets halting early on Thursday, June 19, 2025, in observance of Juneteenth. See here for holiday trading schedule
Key Themes to Monitor This Week
Geopolitical Risks
Any outside intervention in the ongoing Israel-Iran conflict will likely be seen as a risk-off event by market participants. Despite Friday’s sell-off, markets shrugged off during the Sunday open and overnight sessions.
There are potential risks to trade routes and energy infrastructure, although disruptions seem unlikely at the moment. Amena Bakr at Kpler noted that, so far, there are no signs of disruptions in oil loadings from Iran. Without a supply outage, there is no pressing need for additional barrels to be brought onto the market.
Trade War and Trade Deals
There have been recent developments with the U.S. reaching key trade deal milestones with several countries. The baseline scenario remains optimistic, with expectations for an extension in negotiations and potential reciprocal tariffs for countries failing to reach agreements.
FED Week
This is a key week for U.S. monetary policy, with the FOMC decision, Summary of Economic Projections (SEP), and Chair Powell’s press conference scheduled.
Traders will be closely watching how the Fed’s inflation and growth expectations have evolved, as reflected in the SEP. All eyes will be on the dot plot to note how interest rate expectations have evolved since last quarter. Of note: Will President Trump’s continued calls for rate cuts influence Chair Powell’s tone or guidance?
Expectations for the Week Ahead
NQ futures have continued one-time framing higher, consistently creating higher lows since the week of April 21, 2025. A strong support zone exists below, anchored at the yearly Volume Point of Control (VPOC) and the Anchored VWAP from May 11, 2025, when markets gapped higher.
Key Levels to Watch
• yVAH: 22,690.50
• R2: 22,510
• R1 / Previous Week High: 22,322.50
• May 11 AVWAP: 21,672.25
• yVPOC: 21,660
Scenario 1: Market Grinds Higher but Stays Cautious
Despite several looming risk factors, the market could continue to grind higher. In this scenario, we anticipate a test above the prior week's high, followed by a potential pullback into last week’s range.
Example Trade Idea 1
• Entry: 22,000
• Stop: 21,930
• Target: 22,322
• Risk: 70 pts
• Reward: 322 pts
• Risk-Reward Ratio: 4.6R
Scenario 2: Pullback to Support, Range-Bound Consolidation
If the market pulls back, we expect the yearly VPOC and AVWAP from May 11 to act as key support levels. In this case, price action may remain range-bound within the previous week’s range, forming an inside week.
Example Trade Idea 2
• Entry: 21,672
• Stop: 21,600
• Target: 22,000
• Risk: 72 pts
• Reward: 328 pts
• Risk-Reward Ratio: 4.6R
________________________________________
Glossary
• VPOC: Volume Point of Control
• VA: Value Area
• VAL: Value Area Low
• VAH: Value Area High
• VP: Volume Profile
• AVP: Anchored Volume Profile
• Y: Yearly
• pWk: Previous Week

$NMR Breakout 240% Upside Ahead$NMR/USDT has broken out of its long-term downtrend, bouncing from a key support zone around $7.20–$7.50.
The breakout signals a potential trend reversal. If this level holds, price could target $26.50, offering a 240% upside.
DYRO, NFA

Gold Breaks Out as Iran Tensions Flare🚨 Israel’s Iran strike fears are sending gold ( OANDA:XAUUSD ) soaring to $3448!
reports Israel may target Iran’s nuclear sites (June 16, 2025), fueling safe-haven demand as oil prices climb.
4H Chart Analysis:
Price Action: XAUUSD cleared $3440 resistance (a June 2025 high) after a 2-week consolidation, confirming an uptrend.
Volume: 4H volume surged 20% vs. the prior week, reflecting strong buying pressure.
Key Levels:
Current Support: $3440 (former resistance, now support, tested today).
Next Support: $3410-$3420 (consolidation low, held three times since June 1, 2025).
Context: Gold is up 6.49% this month, with $3448 the highest 4H close since May 2025, driven by Middle East risks.
The $3440 breakout with high volume shows buyers dominating. $3410-$3420 is a key support zone for pullbacks, backed by recent price action. Track Iran news and volume for breakout strength or reversal signals.
How’s your 4H gold setup looking? Drop your charts! 👇 #GoldPrice #XAUUSD #IsraelIran #SafeHaven #TradingView

GOLD - Near to his resistance region? Cut n reverse area??#GOLD.. .market just reached near to his current resistance region that is around 3451-52 to 3460-61
Keep close that mentioned region and keep in mind that is our ultimate region and only short expected below that.
Note: we will go for cut n reverse abo w that region on confirmation.
Good luck
Trade wisely

BTCUSD - 1H. TECH.In this trading idea, we are reviewing the last price movement of Bitcoin/USD
I hope this video analysis will have a good and positive effect on your trading perspectives!
Wishing you profits in your trades.
