XAUUSD - Emotional Scalping on Gold Leads to Blown Accounts📔 “I’ll just scalp Gold on the 1-minute” — said the future blown account
Gold doesn’t care about your emotions.
It doesn’t care that you think you can catch a move before it happens.
And it definitely doesn’t care about your $50 dream from a 20-pip scalp.
Real Gold traders don’t come for 20 pips.
They come for precision, for structure, and for 80–100 pip setups backed by real confluence.
If you’re pressing buttons on the 1-minute because you “feel it,”
you’re not trading Gold — you’re feeding it.
And it will eat you alive.
⭐1. Gold is Not a Currency Pair — It’s a Metal with a Temper
You’re not trading EURUSD.
You’re trading a metal — one of the most reactive and manipulated instruments in the market.
Gold doesn’t respond like a normal pair.
It reacts like a sensor. A trigger.
🔸 Geopolitical tension? It spikes.
🔸 USD news? CPI, NFP, FOMC — massive moves.
🔸 Imbalances and inducement zones? It respects them with surgical precision.
🔸 Thin liquidity or Asian session? Expect the unexpected.
Last night, due to a political situation Gold didn’t hesitate.
It exploded — hundreds of pips — while other pairs just twitched.
And here’s the truth:
🔱 Gold is the most loved asset on the planet.
• It’s wealth.
• It’s power.
• It’s culture.
• It’s fear and greed — in physical form.
That’s why it dominates the market.
That’s why it’s unpredictable.
And that’s why you need to approach it with respect — not emotion.
⏱️ 2. The 1-Minute Trap: Why You’re Always Late
On M1, there is no structure — only speed.
By the time you “see a pattern,” you’re already the exit liquidity.
Order blocks? FVGs? Choch?BOS?
They’re there… but barely readable in real time unless you’re hyper-trained.
You’re not early.
You’re late — many, many times.
And Gold punishes late entries without mercy.
So what should you do instead?
🧭 Zoom out. Reset. Re-anchor.
Start with D1-H12-H4-H1. Mark the structure.
Drop to M30/15/5 to refine your zones.
Then — and only then — use M1 as a trigger, not a chart to trade blindly on.
M1 is for confirmation — not discovery.
It shows behavior, not bias.
And if you treat it like a full chart, it will bury your account one candle at a time.
🤓3. If You're New — Respect the Timeframes
If you’ve been trading Gold for less than 6 months,
you don’t need more entries. You need more patience.
Work with:
✅ 1H
✅ 30m
✅ 15m
That’s where the story unfolds — clean, structured, readable.
Yes, study the lower timeframes.
Flip through M1, M3, M5, M7, M10…
Zoom in, zoom out. Train your eye.
And slowly, you’ll start to recognize the way Gold breathes — how it baits, spikes, pauses, and traps.
But execution?
Execution stays clean, until your structure reads faster than your fear.
🚨4. Gold Doesn’t Just Move Fast — It Gets You Hooked
Gold isn’t just volatile — it’s addictive.
You win once… you feel unstoppable.
Twice… now you think you’re the chosen winner.
And just like that, you’re hooked.
You start ignoring your loss, because those two wins gave you more dopamine than a full week of consistency.
You don’t even notice you’re in a loop:
→ Two wins
→ Five losses
→ One clean trade
→ Three more losses
→ Still confident… because of one high
You’re not trading structure.
You’re chasing a chemical high — and Gold is your dealer.
That’s why M1 destroys accounts.
Because the more you “almost catch it,” the more obsessed you get.
You don’t need a new setup.
You need to break the loop.
Walk away, breathe, come back and trade less.
😶🌫️ 5. If Your Mind is Not Calm — Stay Off the Chart
Gold will test your technicals — but it’ll destroy your psychology if you’re not stable.
Had a bad day at work? Argued with someone? Feeling off?
Do. Not. Trade. Gold!!
This metal feeds on instability.
It senses when you’re not focused.
And it will punish you faster than you can say “SL hit.”
💬 “You trade what you feel. So if you’re a mess inside, your chart becomes chaos too.”
🔚 Bottom Line: You Don’t Need More Trades. You Need Better Vision.
Scalping Gold on M1 sounds smart.
Feels efficient. Looks exciting.
Until you’re left with a blown account and a broken mindset.
🫶 Want to stop gambling and start dominating?
Start with patience. Stick to timeframes. Learn the rhythm.
Gold is not for the impulsive — it’s for the precise.
If this lesson helped you today and brought you more clarity:
Drop a 🚀 and follow us✅ for more published ideas.
Tradingview
Markets Crash: Gold Soars, Crypto Dips!Israel’s strikes on Iran shook markets—Bitcoin and stocks tanked, gold soared. What’s next? Let’s unpack the best trading moves for this chaos!
Hey traders, Skeptic here!👋 Yesterday’s Israeli strikes on Iran’s military and nuclear sites, plus high-profile casualties, sent markets into a tailspin. If your positions got stopped out today, don’t sweat it—that’s normal in this mess. Today, I’m breaking down the most likely scenarios for financial markets, especially stocks and crypto, with no FOMO, no hype, just reason. Stick with me to navigate this storm!
📉Right now, markets are screaming risk-off . Stocks like the S&P 500, indices, and crypto like Bitcoin are bleeding as buyers have zero confidence. Everyone’s piling into safe-haven assets like gold, the Japanese yen, and the Swiss franc. Last night’s news triggered sharp drops in Bitcoin and SPX500, while gold’s rallying hard. This is classic flight-to-safety behavior, and it’s why your stops might’ve been hit. Let’s dive into the geopolitical scenarios driving this and then get to the charts.
📍First, the big picture.
Scenario one: Iran retaliates for Israel’s strikes, and we’re stuck in a tit-for-tat escalation for weeks. Markets stay risk-off, stocks and crypto keep sliding, and safe havens like gold thrive.
Scenario two: The US-Iran nuclear talks on Sunday, June 15th, lead to a deal, tensions cool, and markets stabilize. If those talks fail, I’m not optimistic— recent US inflation relief, might’ve pushed the Federal Reserve toward rate cuts to boost markets. Without de-escalation, rate cuts won’t save risky assets, and we’re looking at muted growth for crypto and stocks.
But if a deal happens, markets could rip—Bitcoin might hit $130K short-term and even $170K as the bull run’s ceiling. For now, uncertainty rules, so let’s see what the charts say.
👀 Let’s start with Bitcoin on the daily.
The first major support is $100K-$101K. If we lose that, we’re looking at a 3-4 month time-based correction . I know some of you see Bitcoin’s dip and think it’s a bargain, but hold up—if tensions escalate, breaking $100K-$101K is almost guaranteed. We could slide to $95K (0.382 Fibonacci retracement) or even $86K (0.618 retracement). No buying until Tuesday’s clarity—too risky. Shorting? Also a bad idea. After this sharp drop, where do you put your stop-loss? An 8% stop is the minimum, which trashes your risk-reward ratio. Best move? Sit tight, no positions, and wait for the dust to settle.
📈 Gold’s the star in this risk-off market.
On the 4-hour, as we said in last week’s watchlist, it broke the descending channel’s ceiling at 3333.86 and pulled back. Using our trick of cloning the prior channel and placing it above, it’s reacting perfectly at the new channel’s midline. A break above 3434.35 could push us to the channel ceiling at 3550.13 . Personally, I’d wait for more ranging here before going long—stops are too wide right now for a clean entry. If you caught our 3340 long trigger from the watchlist, you’re sitting pretty— just hold . Gold’s got more upside potential, but if you’re not in, don’t FOMO. Wait for a better setup.
🎯 Our EUR/USD long trigger from last week’s watchlist at 1.14555 was a winner
if you took it, you hit your risk-reward target and likely locked in profits. Nice work! The new long trigger is a break above 1.16142 resistance. No short triggers here, just like gold. With both major and secondary trends screaming uptrend, shorting against the flow is nonsense. I’d wait for key levels to break and confirm a bearish shift before even thinking about shorts. Trade with the trend, always.
📝our plan: Gold longs above 3434.35 target 3550.13; hold 3340 entries or wait for a range. EUR/USD longs above 1.16142, no shorts. Risk max 1% per trade, set alerts, and stay patient—geopolitical chaos means no FOMO moves.
I hope for a day with no wars, where we can focus on what matters—building value and humanity.🤍
That’s today’s breakdown, traders!
If this helped, smash that Boost button and Follow for more no-hype analysis. Drop a comment—what’s your next move? Want a coin or market analyzed? This is Skeptic, stay safe, protect your capital, and see you next time! <3

GOLD - where is current support? What's next??#GOLD.. perfect move as per our last idea regarding gold with fundamental support of Israel attacked.
Now market have 3410-11 as immediate supporting area and if market sustains above that then we can expect further push to upside.
Good luck
Trade wisely

Gold (XAUUSD) Technical Breakdown : Structure Shifting + Target📍 Overview:
Gold (XAUUSD) has been displaying a classic technical development that traders need to pay close attention to. What initially looked like a smooth parabolic rally has now transitioned into a clear structure shift, as evidenced by the breakdown of a rounded support curve and rejection from a major resistance zone. The market is signaling a bearish retracement or even a deeper correction, and this setup offers potential trading opportunities both for short-term scalpers and swing traders.
📊 Chart Breakdown:
🔸 1. The Rounded Support Curve (Black Mind Curve):
The curve outlines a strong upward acceleration phase starting from the June 9 low.
This curve often acts like a dynamic support — similar to a parabolic trendline.
As long as price stays above it, the momentum remains intact.
In this case, Gold broke below the curve, which is a sign of exhaustion and potential bearish control.
🔸 2. Major Resistance Zone (~$3,417 – $3,427):
This level has acted as a ceiling multiple times in the past, visible in earlier highs from June 5 and 6.
Upon re-approaching this zone, price showed aggressive wicks to the upside followed by strong bearish candles — signaling institutional selling and profit-taking.
This triple rejection reinforced the resistance’s significance.
🔸 3. Structure Mapping and Transition:
After the breakdown, we observed a clean market structure shift: the formation of lower highs and lower lows, a key sign of bearish trend development.
The current price action is flowing downward in an organized pattern, suggesting further downside unless a strong reversal or bullish engulfing setup occurs.
🔸 4. Next Reversal Zone (~$3,360):
This area is identified as a high-probability support zone based on:
Past price reaction.
Previous accumulation zone from June 10–11.
Psychological round number proximity (e.g., $3,350 – $3,360).
Traders should monitor this level for potential reversal setups such as bullish engulfing candles, pin bars, or RSI divergence.
🧠 Market Psychology:
This pattern reflects a classic distribution phase at resistance after an emotionally driven uptrend:
Retail traders jump in late as the price approaches highs.
Institutions begin distributing (selling into strength).
Support breaks down as retail stops get triggered.
Price drops into a demand zone where accumulation may begin again.
Understanding this psychological cycle helps traders align with the smart money rather than chasing price action blindly.
🛠️ Potential Trading Plans:
✅ Scenario 1: Bearish Continuation
Wait for a retest of the broken structure (~$3,390 – $3,400).
Look for rejection patterns (e.g., bearish engulfing, shooting star).
Entry: ~$3,395–$3,400 | Target: ~$3,360 | SL: Above $3,420.
✅ Scenario 2: Bullish Reversal from Support
Monitor price action around $3,360 zone.
Look for bullish structure forming: higher lows, reversal candles, divergence.
Entry: On confirmation (e.g., bullish pin bar on 1H or 4H).
Target: Back to structure at ~$3,400–$3,410.
⚠️ Risk Considerations:
Avoid entering in the middle of the range.
Use proper stop-loss positioning to manage volatility.
Keep an eye on macro catalysts like:
US inflation reports
Fed commentary or interest rate decisions
Geopolitical tensions that can spike gold
🧭 Summary:
The market is unfolding a textbook technical setup:
Resistance rejection
Rounded support breakdown
Bearish structure
Approaching a high-probability support zone
Patience is key — let price come to your level. Watch the $3,360 zone for potential reversal, and use structure to guide entries and exits.
📌 Final Note:
This analysis is part of the MMC Methodology (Market Mapping Cycle), which focuses on identifying macro structure, confirming micro structure, and mapping turning points with precision.
Let the market reveal itself. Don't chase — plan and execute with clarity.

Teva: The flag’s ready — someone just needs to hit “launch”Teva Pharmaceutical (TEVA) is setting up for a potential continuation move after a clean impulse. On the daily chart, we have a textbook bull pennant — and not just any sloppy one. Price has broken above the 200-day moving average, and all key EMAs (50/100/200) now sit below price, confirming a solid bullish structure.
Volume behavior fits the script: declining inside the pennant, signaling pressure is building. More importantly, the Volume Profile reveals a low-volume void above current levels — meaning there’s little resistance until we hit the $22+ zone. In other words, once this breaks, it could run fast.
RSI is comfortably in bullish territory without being overheated, and the flagpole projection gives us clean upside targets:
– Entry: breakout above pennant resistance
– Target: $22.80 — full flagpole height
– Support: $17.60 — confluence of 0.5 Fib + volume base
TEVA isn’t asking for confirmation anymore — it’s showing it. All systems are technically armed. Now we just wait for the market to press the button.

TradeCityPro | Bitcoin Daily Analysis #115👋 Welcome to TradeCity Pro!
Let’s dive into the analysis of Bitcoin and the key crypto indices. As usual, I’ll be reviewing the futures triggers for the New York session.
⏳ 1-Hour Timeframe
On the 1-hour chart, as you can see, yesterday the price was rejected from the 110256 level I previously mentioned. Following that, with the activation of the 108617 trigger, Bitcoin experienced a downward leg.
📊 Personally, I didn’t open a short position after the break of that level, but if you did, I suggest taking profits now as the price has reached the marked support zone.
🔍 As for me, I’ll wait to see how the price reacts to this support. If it breaks down, we can open a short position.
📈 However, if the price finds support here, we can once again look for a long position. The trigger for this will be found in the lower timeframes.
👑 BTC.D Analysis
Let’s move to Bitcoin dominance. Yesterday, BTC.D made a pullback to the 64.18 zone and now seems ready for another drop.
✔️ If 63.96 breaks, BTC.D could enter another bearish leg. If instead, the 64.18 ceiling breaks, it could push up toward 64.49 or even 64.67.
📅 Total2 Analysis
Looking at the Total2 index, after reaching 1.24 yesterday, it started to correct and dropped down to 1.18, touching the support with a shadow.
✨ If the 1.2 level breaks to the upside, the price could move back toward 1.24. If 1.18 breaks down, the correction may continue further.
📅 USDT.D Analysis
Now onto USDT.D. After a brief correction up to the 4.68 level, it has resumed its downward movement. If 4.64 breaks, the decline could extend toward 4.56.
💥 If instead, the 4.68 top breaks, it might bounce back up toward 4.72.
❌ Disclaimer ❌
Trading futures is highly risky and dangerous. If you're not an expert, these triggers may not be suitable for you. You should first learn risk and capital management. You can also use the educational content from this channel.
Finally, these triggers reflect my personal opinions on price action, and the market may move completely against this analysis. So, do your own research before opening any position.

Huge Ready BTCAs we learn at start, trend is your friend... :)
Here is our friend, singing as some good song.
Thank you.
Wishing you great week! :)

TradeCityPro | TON: Eyes Breakout from Daily Range Top👋 Welcome to TradeCity Pro!
In this analysis, I’m going to review the coin TON for you. The TON project is developed for Telegram and operates on a Layer One blockchain, enjoying significant popularity within the Telegram community.
✔️ The coin currently has a market cap of 7.95 billion dollars and ranks 18th on CoinMarketCap.
📅 Daily Timeframe
On the daily chart, as you can see, there’s a range box formed between the levels of 2.851 and 3.513, and price is oscillating between these two zones.
⚡️ I’ve marked the top of the box as a zone as well. This is a major supply zone, and a breakout above it could trigger a bullish trend.
🧩 Personally, I’m watching this coin closely. If buying volume enters and the trigger is activated, I’ll either enter a long position or buy it in spot.
📈 For a long position, the breakout of the 3.513 zone that I marked seems appropriate. If this zone breaks, we can open a long position.
🔍 The target for this position can be set around 4.123. This level is also a good spot trigger. If we enter a long at 3.513 and price moves up to 4.123, we can use the profit from the futures trade to buy this coin in spot.
✨ This way, we’ll have purchased a reasonable amount of the coin using profits, without needing any unusual risk or capital management because the capital was already managed beforehand.
📊 There’s also an ascending trendline visible on the chart that the price has responded to well. If the price gets rejected from the 3.513 zone and breaks this trendline, we can open a short position once the trendline trigger is activated, targeting the 3.024 and 2.851 levels.
📝 Final Thoughts
This analysis reflects our opinions and is not financial advice.
Share your thoughts in the comments, and don’t forget to share this analysis with your friends! ❤️

GOLD - at support ? What's next??#GOLD... perfect bounce as per our discussion.
Now market have 3360-61 as immediate supporting area.
Keep close and if market hold it in that case we can expect further push to upside.
Good luck .trade wisley

RENDER Bounces from Strong Confluence Zone$RENDER/USDT Update
RENDER is holding well above the key support zone after a clean retest of the area of confluence.
What’s interesting here is that the old resistance has now flipped into support, this is often a strong bullish signal on higher timeframes.
Price bounced exactly where you’d expect, at the intersection of horizontal support and the rising trendline.
As long as RENDER continues to respect this zone, the structure remains bullish.
DYOR, NFA
Thanks for following along — stay tuned for more updates!

Breakout Watch: NEAR Approaching Moment of Truth If you want, ICBOE:NEAR is currently testing the breakout zone but is still holding below the key trendline.
It’s a critical spot — if NEAR manages to break and close above this trendline, it could unlock further upside. For now, the trendline remains intact, so patience is needed here.
Watching closely to see if the breakout gets confirmed or if we see another rejection.
DYOR, NFA

TradeCityPro | Bitcoin Daily Analysis #114👋 Welcome to TradeCity Pro!
Let’s go over Bitcoin analysis and the key crypto indexes. As usual, I’ll break down the futures triggers for the New York session.
⏳ 1-Hour Timeframe
On the one hour timeframe, as you can see, a trading range has formed between the levels of 108617 and 110256. This has happened after a strong upward move with significant buying volume, and now we’re in a market correction phase.
📊 Market volume is decreasing during this corrective phase, which shows the strength of the buyers and supports the ongoing uptrend. RSI has exited the Overbuy zone and is now cooling off, which indicates that the bullish momentum has weakened for now.
📈 For a long position, the 110256 trigger seems very suitable today. If the price forms a higher low above 108617 before breaking this level, the probability of breaking 110256 increases significantly.
💥 If this trigger is activated, it’s crucial that volume rises as well. That would confirm the strength of the trend and increase the chances of the uptrend continuing. The current target for this position is 111747.
🔽 In the correction scenario, if the price stabilizes below 108617, this scenario becomes more likely and a deeper correction could follow.
✨ Personally, I won’t open a short position unless we get confirmation of a trend reversal. But if you want to go short, a break below 108617 is not a bad option and could signal a downward move.
👑 BTC.D Analysis
Bitcoin dominance has continued its downward movement, stabilized below 64.12, and is now heading toward 63.93.
⭐ If the 63.93 low is broken, the bearish move in dominance will likely continue. If it pulls back, a break above 64.12 will confirm that retracement.
📅 Total2 Analysis
Let’s look at Total2. Yesterday, it broke through the 1.2 level and is now moving toward 1.24. A breakout above this level could start the next bullish leg.
🎲 If a correction occurs, the price may drop back to 1.2 or even 1.18.
📅 USDT.D Analysis
Now for Tether dominance. This index is still sitting at the 4.56 support and is currently being held there. If 4.56 breaks, the next bearish leg can form.
🔔 In case of a retracement, USDT dominance might rise to 4.64.
❌ Disclaimer ❌
Trading futures is highly risky and dangerous. If you're not an expert, these triggers may not be suitable for you. You should first learn risk and capital management. You can also use the educational content from this channel.
Finally, these triggers reflect my personal opinions on price action, and the market may move completely against this analysis. So, do your own research before opening any position.

Mid-Week Outlook Update: US CPI- Trade TalksCPI day today. Scheduled to be released at 7:30 AM CT.
CME:6E1! CME_MINI:ES1! CME_MINI:NQ1! CME_MINI:MNQ1! CME_MINI:MES1! COMEX:GC1! CBOT:ZN1!
ES futures edged slightly higher after positive commentary from US-China trade talks. The delegations from both sides agreed on a framework to move forward with negotiations.
It is important to note that Trade War 1.0 took about two years to formalize and finalize. However, given the previous experience and the current agreement on the framework, our opinion (which is not the consensus) is that the trade deal between China and the US may be closer than what most analysts and investors might otherwise predict.
Like any negotiations, China and the US have previously discussed these difficult issues and have found a way to resolve them. Although the concerns have shifted towards niche sectors, we still view baseline tariffs with some sectors seeing increased tariffs as likely.
TACO (Trump Always Chickens Out) acronym traders will see a tougher stance from Trump to resolve the overarching trade deficit issue with China, particularly the dumping of Chinese goods.
AI, defense technology, chips, and rare earth minerals are at the center of these discussions. There will be targeted controls on exports of chips from the US and exports of rare earth minerals on the Chinese side, despite the current framework and deals agreed. In our view, these controls will be phased out until agreements are finalized, to maintain leverage and show TACO acronym backers that Trump is not “chickening out,” but rather maintaining a strong stance while negotiating trade deals with China and other countries.
In our analysis, despite positive headlines, the overhanging uncertainty has not dissipated. In fact, there is clarity that President Trump is willing to take the difficult road to negotiate from an apparent position of strength. Would this result in extension of trade deadlines or temporary increase in tariffs followed by an extension of deadlines? This remains to be seen!
If May CPI comes in lower than expectations, this will be a nudge in the direction that tariffs are not translating into higher inflation. We may see a rally in index futures.
On the contrary, any increase in CPI above the previous 2.3% YoY increase will be seen as tariff-induced inflation.
In our analysis, given lower energy prices, rent inflation stabilizing at levels last seen in late 2021, and services inflation in the US trending lower from the peak in January 2023, we are seeing embedded inflation in the prior two months and this may remain sticky in today’s release. However, any stability with lower energy prices seen in the prior month will point to a lower inflation print overall.
Comment with your favorite trade idea from our past trade ideas and what you would like to see more of.

TON It will grow soon...Currently, TON is forming an ascending triangle, indicating a potential price increase. It is anticipated that the price could rise, aligning with the projected price movement (AB=CD).
However, it is crucial to wait for the triangle to break before taking any action.
Give me some energy !!
✨We spend hours finding potential opportunities and writing useful ideas, we would be happy if you support us.
Best regards CobraVanguard.💚
_ _ _ _ __ _ _ _ _ _ _ _ _ _ _ _ _ _ _ _ _ _ _ _ _ _ _ _ _ _ _ _
✅Thank you, and for more ideas, hit ❤️Like❤️ and 🌟Follow🌟!
⚠️Things can change...
The markets are always changing and even with all these signals, the market changes tend to be strong and fast!!

$PNUT in Freefall – Can $0.20 Hold as Support?$PNUT is dropping like a falling knife!🚨
Technically, we have support around $0.22 and $0.20.
According to the Fibonacci levels, the 0.786 level may
act as strong support near $0.20, making that area a key zone to watch.
So unless this support range is reached, the price may continue to drop toward that zone.
If you're currently stuck in this coin, you could consider adding funds and setting your liquidation point below $0.18 for safety.
If you're looking to enter or accumulate, the range between $0.22 and $0.20 is ideal for accumulation.
However, even with these support levels, we still need to wait for clear reversal patterns before expecting a trend reversal in the shorter time frame.
Thank you so much for reading, I hope my updates help you in your trading journey.
DYOR, NFA

Latest Published Ideas by UsersThis is not a trading idea, but some form of representing my desire, about to see again on TradingView, the great function that can help and improve the vision and knowledge about the current situation on the market, so effectively.
If you an individual user, member, and friend of TradingView, like this idea,
Click Boost Symbol!
Thank you! Have a great day.

TradeCityPro | KAS Ranges Near Top with Bullish Momentum Rising👋 Welcome to TradeCity Pro!
In this analysis, I want to review the coin KAS for you. It’s one of the Layer One projects, and its token currently ranks 40 on CoinMarketCap with a market cap of 2.35 billion dollars.
⏳ 4-Hour Timeframe
On the four hour timeframe, the price is moving inside a range box between the levels of 0.082767 (which I’ve also marked as a zone) and 0.091126, and is currently near the top of the box.
✔️ Considering that other coins and market indexes like Bitcoin and Total2 are showing bullish confirmations, the activation of this coin’s long trigger could initiate a strong upward move.
📊 The volume increase shown on the chart is another reason why the probability of breaking the top of the box has gone up.
📈 For a long position, we can enter with the trigger at 0.091126. If the breakout candle comes with strong volume, we’ll have volume confirmation as well, and momentum confirmation will come from RSI breaking above 62.96.
✨ Given the confirmations, the likelihood of this trigger activating seems high, and we can target a move to 0.102417 or even 0.126033.
🛒 For a spot buy of this coin, it’s better to wait for a break above 0.126033. We can open a futures position at the 0.091126 trigger aiming for 0.126033, and once the price reaches 0.126033, we can use the profits from the futures trade to enter the spot market.
🔽 As for bearish movement and a short trigger, the first sign would be rejection from the 0.091126 area. The main trend reversal trigger will be the breakdown of the support zone.
📝 Final Thoughts
This analysis reflects our opinions and is not financial advice.
Share your thoughts in the comments, and don’t forget to share this analysis with your friends! ❤️

TradeCityPro | Bitcoin Daily Analysis #113👋 Welcome to TradeCity Pro
Let’s dive into the Bitcoin analysis and key crypto indexes. As usual in this analysis, I’ll walk you through the futures triggers for the New York session.
⏳ 1-Hour Timeframe
As you can see in the one hour timeframe, Bitcoin has continued its upward movement and reached the 110256 level and is now undergoing a correction.
✔️ If the price continues correcting, the next support level will be 108777. In case of a deeper pullback, the next area to watch is 106586.
📈 For a long position, our first trigger level is 110256, with a target of 111747.
📊 Market volume is currently increasing, and if this inflow of buy volume continues, the probability of a bullish move increases.
💥 The RSI oscillator has dropped below the 70 level. If RSI reenters the overbought zone, we’ll also get a strong momentum confirmation.
👑 BTC.D Analysis
Let’s take a look at Bitcoin Dominance. Today, it finally closed below the 64.49 level and has dropped to 64.12.
⚡️ This drop has allowed capital to flow into altcoins, and many of them are moving upward today. If 64.12 breaks, the downtrend may continue.
📅 Total2 Analysis
Moving on to Total2, this index finally broke above the 1.21 level and is now heading toward 1.24.
💫 At the moment, there is no major resistance preventing the market from continuing its upward trend. But there’s an important point regarding USDT Dominance, which I’ll cover below.
📅 USDT.D Analysis
During this bullish move in the market, the dominance of Tether hit the support at 4.56, while other indexes and most altcoins activated their triggers.
🔑 The key point here is that Tether Dominance has such a significant influence on the market that the inability to break this support has caused the entire market, including Bitcoin, to start correcting.
🔽 The 4.56 level in USDT Dominance is very important and will be the key to triggering the next bullish leg.
❌ Disclaimer ❌
Trading futures is highly risky and dangerous. If you're not an expert, these triggers may not be suitable for you. You should first learn risk and capital management. You can also use the educational content from this channel.
Finally, these triggers reflect my personal opinions on price action, and the market may move completely against this analysis. So, do your own research before opening any position.

TradeCityPro | ICP Approaches Key Resistance with Rising Volume👋 Welcome to TradeCity Pro
In this analysis, I want to review the ICP coin for you. The Internet Computer project operates in the fields of artificial intelligence and DePIN.
⭐ The coin of this project, with the symbol ICP, has a market cap of 3.25 billion dollars and ranks 32nd on CoinMarketCap.
📅 Daily Timeframe
As you can see in the daily timeframe, there is a descending trendline visible on the chart, which has been tested multiple times. The price has broken above it and is now sitting just below the 6.205 resistance level.
🔍 In recent candles, the volume has increased significantly, which raises the likelihood of a breakout above 6.205.
🔔 If the 6.205 level is broken, ICP's bullish trend could begin. In that case, the price could move toward the 7.423 and 9.887 levels.
📊 Entering a position with the breakout of 6.205 is supported by volume confirmation, and we will get RSI momentum confirmation if it enters the overbought zone.
📉 For the bearish scenario to play out, the price must first get rejected from 6.205, and then we’ll look for confirmation of a trend reversal with a break below 4.468.
🛒 You can also use this same 6.205 trigger for a spot buy, but keep in mind that Bitcoin dominance is still in an uptrend, so in my opinion, it’s not yet the right time to buy altcoins.
✔️ The best trigger for buying any altcoin is to wait for confirmation of a trend reversal in Bitcoin dominance. Once that’s confirmed, you can start buying the altcoins you’ve selected.
📝 Final Thoughts
This analysis reflects our opinions and is not financial advice.
Share your thoughts in the comments, and don’t forget to share this analysis with your friends! ❤️

EURUSD Analysis (MMC Strategy) : Structure Mapping + Target🧠 Overview
This analysis is based on the MMC (Market Mapping Concept), combining smart money principles, structure mapping, and price behavior analysis. EUR/USD has been showing strong bullish activity over the past few months, but we are now approaching a critical decision zone. Let’s break it all down.
🔹 1. Arc Structure – Accumulation Phase (Dec 2024 – Feb 2025)
The chart starts with a well-defined Arc formation, signaling accumulation by large players.
Price showed a series of higher lows within the arc, compressing volatility.
This is where smart money quietly loads positions before pushing price.
Key Insight: This arc often precedes an impulsive breakout, as seen next.
🔹 2. Central Zone Breakout (Feb – Mar 2025)
The price exploded out of the arc, breaking through the central compression area.
Marked as the Central Zone, this acted as both support and a launchpad.
This phase included imbalance filling, reaccumulation, and clean price action.
Observation: Notice the aggressive bullish candles—clear indication of institutional interest.
🔹 3. Structure Mapping & QFL Zone (April 2025)
A classic QFL (Quick Flip Level) was formed after the initial rally.
Price pulled back into a structure support zone, respected it cleanly, and bounced back.
This gave a textbook smart money entry.
Structure Mapping highlights how each leg of the trend is forming based on supply/demand reaction.
🔹 4. Major BOS – Break of Structure (May 2025)
Price broke the previous swing high, giving us a Major Break of Structure.
This BOS confirms a change in character (CHOCH) from ranging to trending.
After BOS, the market retested the breakout zone—providing a second ideal long entry for continuation traders.
🔹 5. Minor Resistance Zone (Current Price)
Currently, price is testing a Minor Resistance zone around 1.1400–1.1450.
This level acted as resistance earlier and may slow price down temporarily.
However, there’s still room for bullish continuation unless reversal patterns emerge.
Key Watch Point: If price shows weakness here (e.g., rejection wicks, bearish engulfing), short-term retracement may follow.
🔹 6. Next Reversal Zone (Projected Target: 1.1700–1.1800)
The green box above marks the Next Reversal Zone, based on historical supply, Fibonacci extension levels, and structure analysis.
Expect this area to act as strong resistance unless momentum is very strong.
This is a potential TP zone for long traders or an area to scout for short opportunities if reversal signals appear (divergence, order block rejection, liquidity grab).
📌 Key Levels
Zone Price Range Role
Central Zone 1.0800–1.1000 Support/Accumulation
Minor Resistance 1.1400–1.1450 Immediate Hurdle
Next Reversal Zone 1.1700–1.1800 Target / Short Setup
QFL Zone 1.1100–1.1200 Smart Money Entry Point
🧠 Strategy Outlook
✅ Bullish Bias: Structure is clearly bullish. Buyers are in control.
🕵️♂️ Watch for Reaction at Minor Resistance – a clean break = continuation, rejection = short-term pullback.

USDJPY Analysis: MMC Resistance vs Major BOS (Technical View)🔍 Chart Summary:
The USDJPY pair is currently trading around 144.58, showing strong signs of structural buildup as it approaches a critical inflection point. This analysis leverages MMC (Market Mapping Concept) and price action structure to identify two possible directional outcomes — each grounded in key technical levels.
🧠 Key Technical Highlights:
📌 1. Expanding Wedge Pattern:
Price previously formed an expanding structure, signaling volatility and accumulation.
Expansion typically precedes major directional breakouts — either trend continuation or reversal.
📌 2. Downtrend Break Test:
A long-standing descending trendline has now been tested multiple times.
A confirmed breakout would be significant, indicating a major shift in market momentum.
📌 3. Resistance Zones:
Minor Resistance Zone around 158.00–160.00 marks a key supply area.
Watch for price action behavior if this level is tested — possible rejection or breakout continuation.
📌 4. Major Support Zone:
Support near 139.00–140.00, where price previously bounced, represents a solid floor and demand zone.
📌 5. BOS (Break of Structure):
Two BOS levels are marked:
Minor BOS (Around 146.00): Immediate reaction level to watch.
Major BOS (Around 149.00–150.00): If broken, could lead to sharp bullish continuation.
🔮 MMC Forecast Scenarios:
✅ Condition 1: Bullish Breakout Scenario
Price breaks above the descending trendline and clears the Minor BOS.
Target zone: 158.00–160.00 resistance.
Structure confirms bullish dominance if Major BOS is cleanly broken and retested.
⚠️ Condition 2: Bearish Rejection Scenario
Price rejects from current trendline or Minor BOS and reverses.
Potential drop toward Major Support around 140.00.
Watch for reversal confirmation with bearish engulfing candles or re-entry into expanding zone.
🧭 MMC Outlook Summary:
The chart is setting up for a key decision point. The market will either validate a bullish breakout structure or revert back into bearish continuation. These scenarios align with the MMC mapping method, providing clear conditions for traders to follow without bias.

GOLD - at support ? Holds or not??#GOLD - well guys in today we have 3323-24 as a immediate n most important support of the day.
Keep close and if market thold it in that case we can expect a bounce from here.
Note: keep in mind that we will go for cut n reverse below that on confirmation.
Good luck
Trade wisely

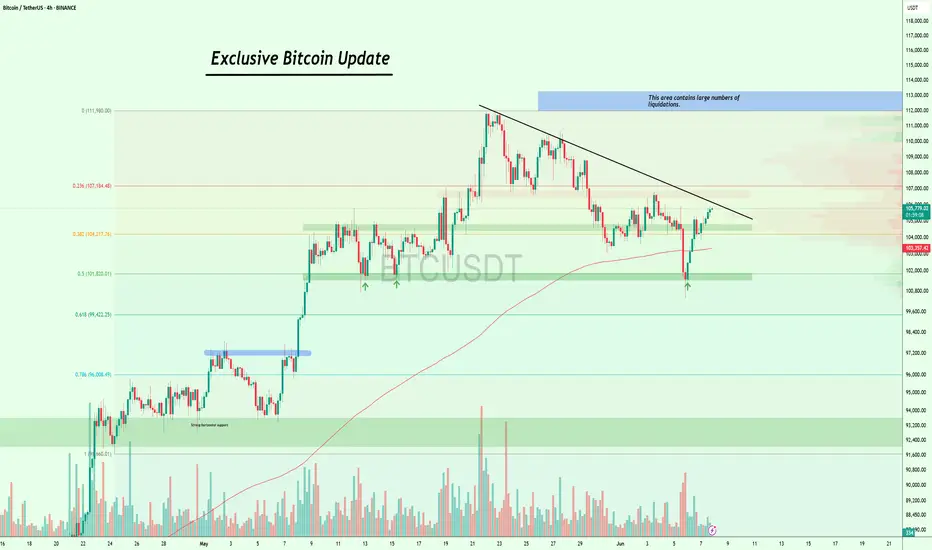
No Change in Plan! $BTC Targeting Major Liquidation ZoneAs I warned you guys, CRYPTOCAP:BTC came down to the $100K exactly as expected, and then we bounced from the $100K level!
That lower trendline once again acted as strong support, just as expected.
Now #Bitcoin is pushing back up toward the major trendline and eyeing the $107K–$112K zone, which holds large liquidations.
No changes in the game plan, watching the daily and weekly closes closely.
If Bitcoin breaks above this trendline clearly, we could see a strong move up. 🚀
I’ll keep you posted as things unfold. If you find my updates helpful, don’t forget to like and follow for more!