GBPCHF Is Waking Up — This Long Trigger Looks CleanGBPCHF just broke out of a long accumulation and is eyeing fresh bullish momentum. Here’s the exact trigger, stop-loss idea, and RSI confirmation I’m watching this week. If it helps, boost it and let’s catch the move.
Disclaimer: This content is for educational purposes only and is not financial advice. Trade at your own risk.
Tradingview

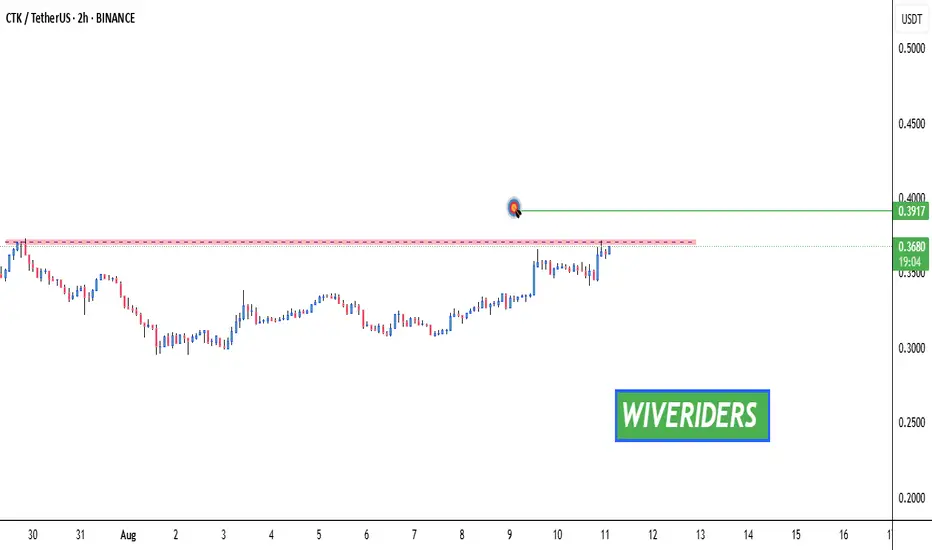
CTK Breakout Watch – Red Resistance Being Tested!🚨 CTK Breakout Watch – Red Resistance Being Tested! 🔴⏳
CTK is testing the red resistance zone.
📊 If breakout confirms, next move could target:
🎯 First Target → Green line level
A breakout could trigger bullish continuation and upside momentum.
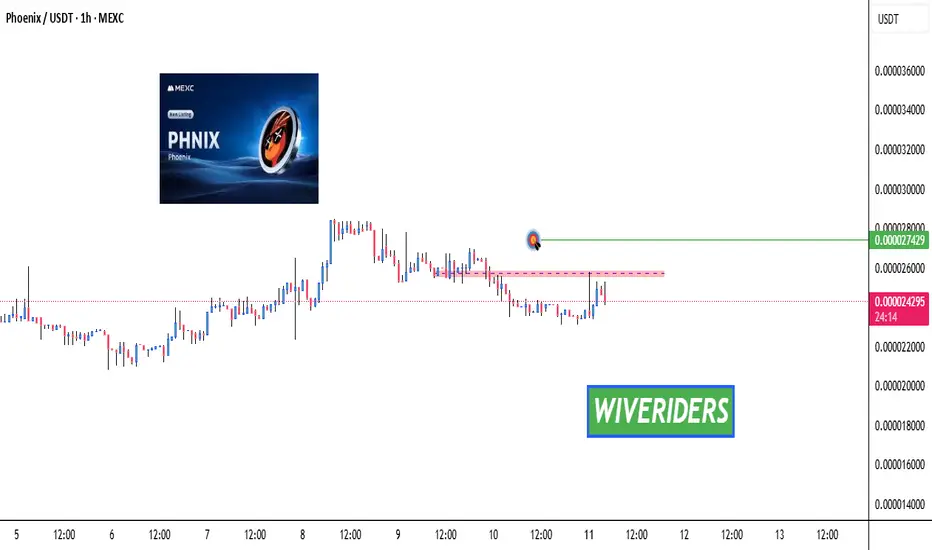
PHNIX Breakout Watch – Red Resistance Being Tested!🚨 PHNIX Breakout Watch – Red Resistance Being Tested! 🔴⏳
PHNIX is testing the red resistance zone.
📊 If breakout confirms, next move could target:
🎯 First Target → Green line level
A breakout could trigger bullish continuation and upside momentum.
PENGU Breakout Watch – Red Resistance Being Tested! 🚨 PENGU Breakout Watch – Red Resistance Being Tested! 🔴⏳
PENGU is testing the red resistance zone.
📊 If breakout confirms, next move could target:
🎯 First Target → Green line level
A breakout could trigger bullish continuation and upside momentum.

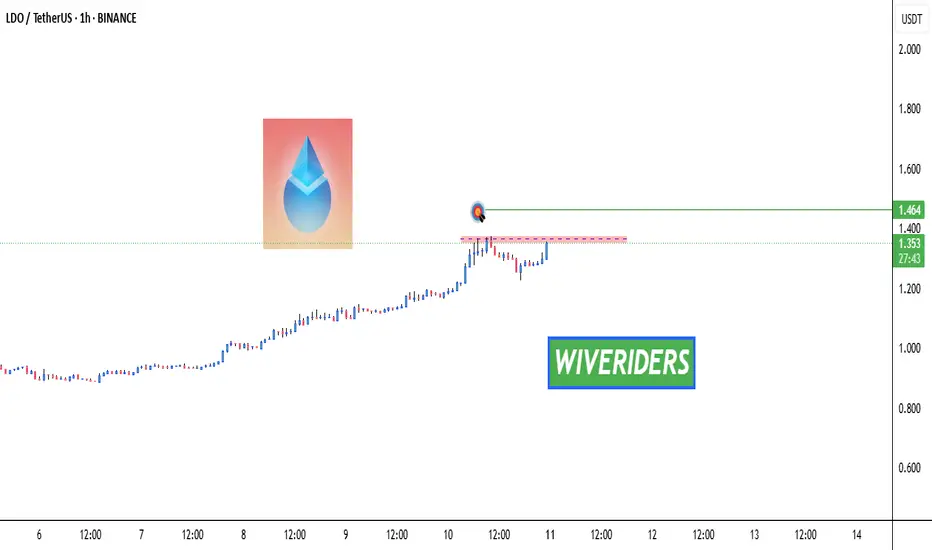
LDO Breakout Watch – Red Resistance Being Tested! 🚨 MIL:LDO Breakout Watch – Red Resistance Being Tested! 🔴⏳
MIL:LDO is testing the red resistance zone.
📊 If breakout confirms, next move could target:
🎯 First Target → Green line level
A breakout could trigger bullish continuation and upside momentum.
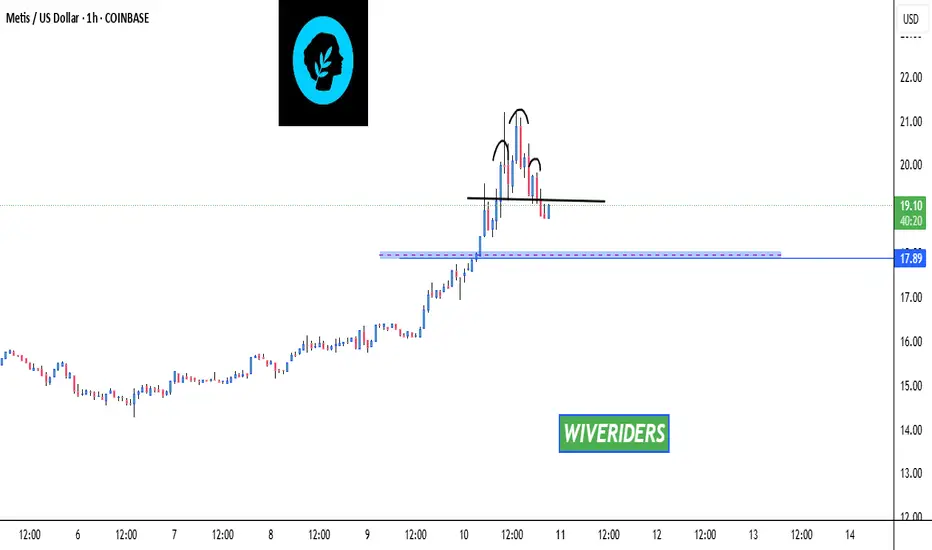
METIS Bearish Pattern Alert – Blue Support in Focus!🚨 METIS Bearish Pattern Alert – Blue Support in Focus! 🔵⚠️
METIS has formed a bearish head and shoulders pattern.
📊 If the price drops back to the blue support level, there is a possibility to enter long from this zone with confirmation, as buyers were active here before.
#BIGTIME #BIGTIMEUSD #BIGTIMEUSDT #Analysis #Eddy#BIGTIME #BIGTIMEUSD #BIGTIMEUSDT #Analysis #Eddy
A reversal structure has formed on the weekly and daily time frames, and the necessary confirmations have been given on the weekly time frame. Considering the structure formed on the above time frame, as well as the behavior of this currency in the past chart, it is expected that this currency will perform a good pump.
I have identified the important supply and demand zones of the higher timeframe for you.
This analysis is based on a combination of different styles, including the volume style with the ict style.
Based on your strategy and style, get the necessary confirmations for this analysis to enter the trade.
Don't forget about risk and capital management.
The responsibility for the transaction is yours and I have no responsibility for your failure to comply with your risk and capital management.
💬 Note: The red order block cannot stop the growth of the price of this currency and by 0.29 cents this currency will be pumped more than 350%.
Be successful and profitable.

#SONIC #SONICUSD #SONICUSDT #Analysis #Eddy#SONIC #SONICUSD #SONICUSDT #Analysis #Eddy
A reversal structure has formed on the weekly and daily time frames, and the necessary confirmations have been given on the weekly time frame. Considering the structure formed on the above time frame, as well as the behavior of this currency in the past chart, it is expected that this currency will perform a good pump.
I have identified the important supply and demand zones of the higher timeframe for you.
This analysis is based on a combination of different styles, including the volume style with the ict style.
Based on your strategy and style, get the necessary confirmations for this analysis to enter the trade.
Don't forget about risk and capital management.
The responsibility for the transaction is yours and I have no responsibility for your failure to comply with your risk and capital management.
💬 Note: The red order block cannot stop the growth of the price of this currency and by 0.66 cents this currency will be pumped more than 230%.
Be successful and profitable.

#VIRTUAL #VIRTUALUSD #VIRTUALUSDT #Analysis #Eddy#VIRTUAL #VIRTUALUSD #VIRTUALUSDT #Analysis #Eddy
A reversal structure has formed on the weekly and daily time frames, and the necessary confirmations have been given on the weekly time frame. Considering the structure formed on the above time frame, as well as the behavior of this currency in the past chart, it is expected that this currency will perform a good pump.
I have identified the important supply and demand zones of the higher timeframe for you.
This analysis is based on a combination of different styles, including the volume style with the ict style.
Based on your strategy and style, get the necessary confirmations for this analysis to enter the trade.
Don't forget about risk and capital management.
The responsibility for the transaction is yours and I have no responsibility for your failure to comply with your risk and capital management.
💬 Note: The red order block cannot stop the growth of the price of this currency and by 4.20 cents this currency will be pumped more than 200%.
Be successful and profitable.

#YGG #YGGUSD #YGGUSDT #Analysis #Eddy#YGG #YGGUSD #YGGUSDT #Analysis #Eddy
A reversal structure has formed on the weekly and daily time frames, and the necessary confirmations have been given on the weekly time frame. Considering the structure formed on the above time frame, as well as the behavior of this currency in the past chart, it is expected that this currency will perform a good pump.
I have identified the important supply and demand zones of the higher timeframe for you.
This analysis is based on a combination of different styles, including the volume style with the ict style.
Based on your strategy and style, get the necessary confirmations for this analysis to enter the trade.
Don't forget about risk and capital management.
The responsibility for the transaction is yours and I have no responsibility for your failure to comply with your risk and capital management.
💬 Note: The red order block cannot stop the growth of the price of this currency and by 1 dollar this currency will be pumped more than 400%.
Be successful and profitable.

BTC 1H Analysis – Key Triggers Ahead | Day 6💀 Hey , how's it going ? Come over here — Satoshi got something for you !
⏰ We’re analyzing BTC on the 1-hour timeframe .
👀 On the 1-hour timeframe, Bitcoin rebounded from $114,200 after heavy whale buying. It broke through the $115,530 zone and moved toward its resistance at $117,600, but was rejected twice by strong seller tickers in that area. It is now moving toward its current support levels .
🎮 Key Fibonacci zones to watch are the 0.5 and 0 levels. A breakout of these areas can trigger potential long or short entries, making them valuable as breakout triggers .
⚙️ The important RSI pivot level is 44.87; losing this level could lead to a further correction .
🕯 Trading volume and transaction count are rising, suggesting the possibility of another “Bitcoin season.” Large institutions have been buying at the lows, increasing their positions each time. ETF data has turned highly positive, indicating strong recovery potential and attracting more risk capital .
🔔 There are two alert zones: one at $117,500 and another at $116,000. Setting alerts here can help you better track price behavior .
📊 USDT.D has broken above its range box , A break of the current zone could allow Bitcoin to push higher .
🖥 Summary : After its recent pump, Bitcoin is facing resistance from seller tickers and is trying to break through this zone. As long as BTC stays above $116,000, there is potential for another attempt to set a new high .
❤️ Disclaimer : This analysis is purely based on my personal opinion and I only trade if the stated triggers are activated .

TradeCityPro | Bitcoin Daily Analysis #149👋 Welcome to TradeCity Pro!
Let’s move on to Bitcoin’s analysis. Today, Bitcoin has once again moved toward a certain range, and we need to see whether it can break this zone this time or not.
⏳ 4-Hour Timeframe
On the 4-hour timeframe, Bitcoin has once again moved toward the 117000 zone today, faced a rejection candle from this level, and now it seems to be heading for a correction.
✔️ Considering tomorrow is also a holiday, the likelihood of ranging and correcting is much higher than continuing the trend, because for the uptrend to continue, the price needs volume inflow — and today and tomorrow, significant volume is unlikely to enter Bitcoin. That’s why the probability of correction and ranging is higher.
📊 If, during the correction, the price can hold above 115364, then with the start of the new week, the probability of a new bullish wave increases significantly. In that case, we can open a long position upon breaking the 117000 zone.
✨ However, if the price breaks below 115364, the correction could extend down to 112233. This still won’t change the overall trend, but it would fake the entire move made during the week — which is not a good sign for the bullish trend.
🔍 As long as the price remains above 112233, I am still only looking for long triggers and will not open any shorts for now.
❌ Disclaimer ❌
Trading futures is highly risky and dangerous. If you're not an expert, these triggers may not be suitable for you. You should first learn risk and capital management. You can also use the educational content from this channel.
Finally, these triggers reflect my personal opinions on price action, and the market may move completely against this analysis. So, do your own research before opening any position.

All the Triggers You Need to Watch This Weekyo its Skeptic from Skeptic Lab 🩵
Quick breakdown of my weekly watchlist — from forex pairs to commodities — including the exact levels and triggers I’m watching for potential setups this week. Whether you trade breakouts or reversals, this list will keep you ahead of the moves.
Disclaimer: This content is for educational purposes only and is not financial advice. Trade at your own risk.

TradeCityPro | OP Eyes Breakout in Prolonged Altseason Range 👋 Welcome to TradeCity Pro!
In this analysis, I want to review the OP coin for you — one of the Layer 2 projects whose token currently holds a market cap of $1.39 billion and is ranked 68th on CoinMarketCap.
📅 Daily Timeframe
On the daily timeframe, OP is moving within a range box between 0.521 and 0.920, which formed after a downtrend, and the price has been fluctuating in this box for several months.
🔑 One key resistance on this coin is 0.816, which can be used as a trigger for a long position.
📈 This trigger can also be used for spot buying, but given its Bitcoin pair, I prefer to take the position in futures and reserve spot buys for future triggers.
💥 For momentum confirmation of this position, we can use RSI’s entry into the Overbought zone, since RSI is currently near this area, and if it enters, it could support a strong upward move.
📊 The next long trigger is the breakout of 0.920. However, this trigger is not valid at the moment because the price hasn’t reacted to it for a long time, and in the future, if it does react, the level will likely change. In that case, I’ll update the analysis and give you the new trigger.
✔️ If OP declines, the first important support we have is 0.626. A close below this level could allow for a risky short position, but for shorts, I’ll personally wait for a break below 0.521.
📝 Final Thoughts
Stay calm, trade wisely, and let's capture the market's best opportunities!
This analysis reflects our opinions and is not financial advice.
Share your thoughts in the comments, and don’t forget to share this analysis with your friends! ❤️

SHIB Breakout Watch – Red Resistance Being Tested!🚨 CRYPTOCAP:SHIB Breakout Watch – Red Resistance Being Tested! 🔴⏳
CRYPTOCAP:SHIB is testing the red resistance zone.
📊 If breakout confirms, next move could target:
🎯 Target → Green line level
A breakout could trigger bullish continuation and upside momentum.

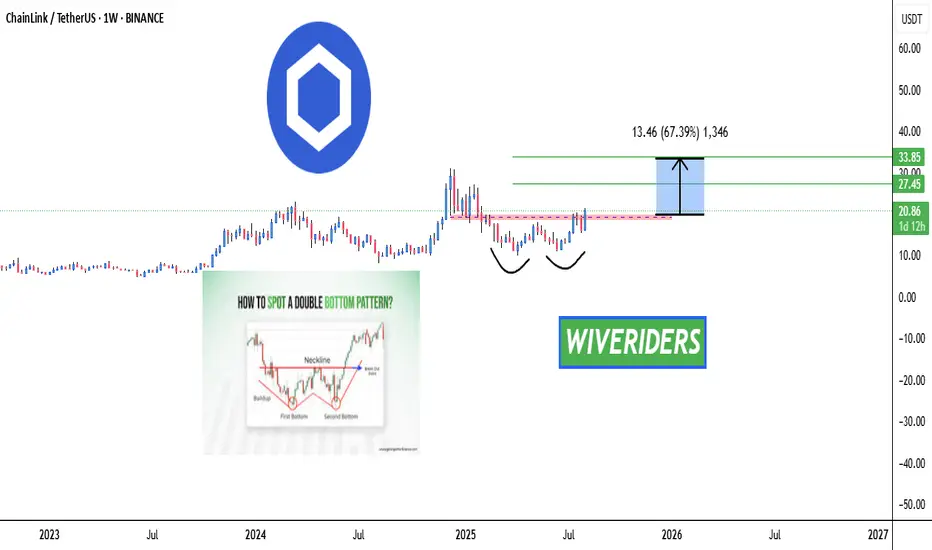
LINK Weekly Breakout Watch – Bullish Double Bottom Forming! 🚨 CRYPTOCAP:LINK Weekly Breakout Watch – Bullish Double Bottom Forming! 🔴📈
CRYPTOCAP:LINK is showing a bullish double bottom pattern on the weekly timeframe and is now testing the red resistance zone.
📊 If breakout confirms, next move could target:
🎯 First Target → Green line level 1
🎯 Second Target → Green line level 2
A breakout here could signal strong bullish continuation in the long term.
FARTCOIN Breakout Watch – Red Resistance Approaching! 🚨 $FARTCOIN Breakout Watch – Red Resistance Approaching! 🔴⏳
$FARTCOIN is approaching the red resistance zone.
📊 If breakout confirms, next move could target:
🎯 First Target → Green line level
A breakout could trigger bullish continuation and upside momentum.

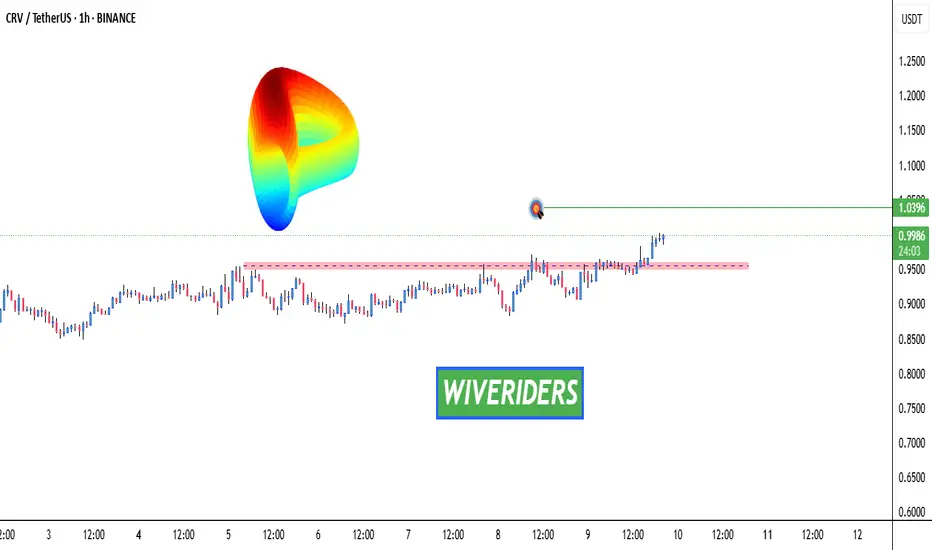
CRV Breakout Alert – Red Resistance Cleared!🚨 CRV Breakout Alert – Red Resistance Cleared! 🔴✅
CRYPTOCAP:CRV has successfully broken out of the red resistance zone.
📊 Next move could target the green line level.
🔥 Buyers showing strong momentum —
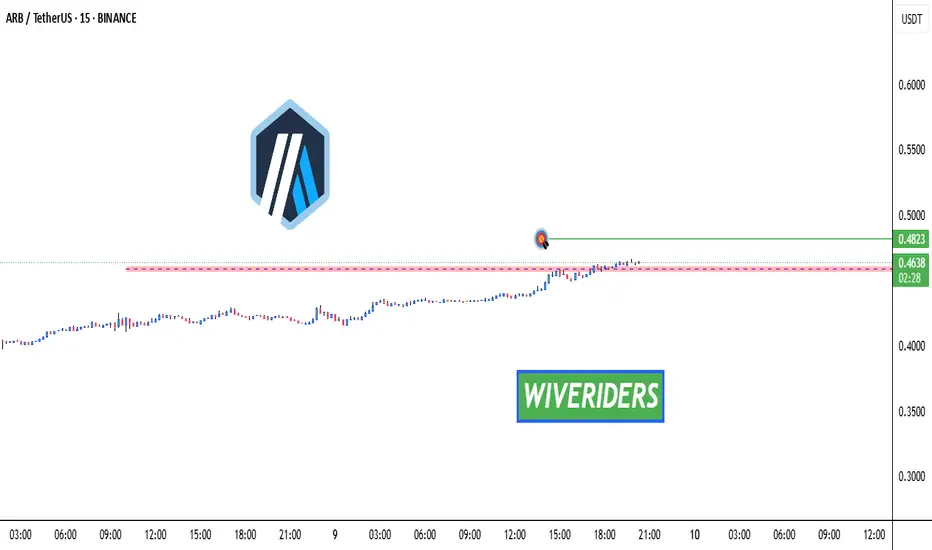
ARB Breakout Watch – Red Resistance Being Tested!🚨 AMEX:ARB Breakout Watch – Red Resistance Being Tested! 🔴⏳
AMEX:ARB is testing the red resistance zone.
📊 If breakout confirms, next move could target:
🎯 First Target → Green line level
A breakout could trigger bullish continuation and upside momentum.
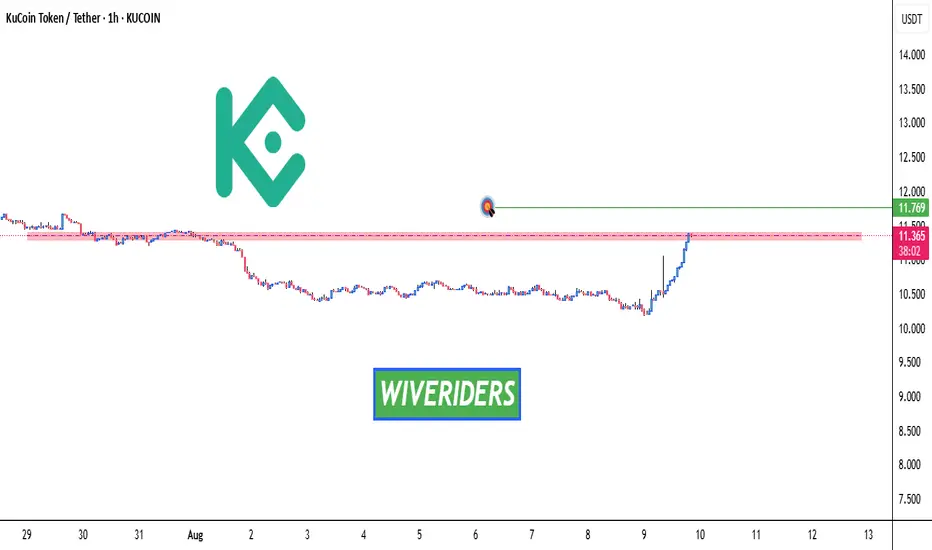
KCS Breakout Watch – Red Resistance Being Tested!🚨 KCS Breakout Watch – Red Resistance Being Tested! 🔴⏳
KCS is testing the red resistance zone.
📊 If breakout confirms, next move could target:
🎯 Next Target → Green line level
A breakout could trigger bullish continuation and upside momentum.
PEPE Breakout Watch – Red Resistance Being Tested! 🚨 CRYPTOCAP:PEPE Breakout Watch – Red Resistance Being Tested! 🔴⏳
CRYPTOCAP:PEPE is testing the red resistance zone.
📊 If breakout confirms, next move could target:
🎯 First Target → Green line level
A breakout could trigger bullish continuation and upside momentum.

XTZ Breakout Alert – Red Resistance Cleared!🚨 SEED_DONKEYDAN_MARKET_CAP:XTZ Breakout Alert – Red Resistance Cleared! 🔴✅
SEED_DONKEYDAN_MARKET_CAP:XTZ has broken out of the red resistance zone.
📊 Breakout signals bullish momentum — next move could target the green line level.

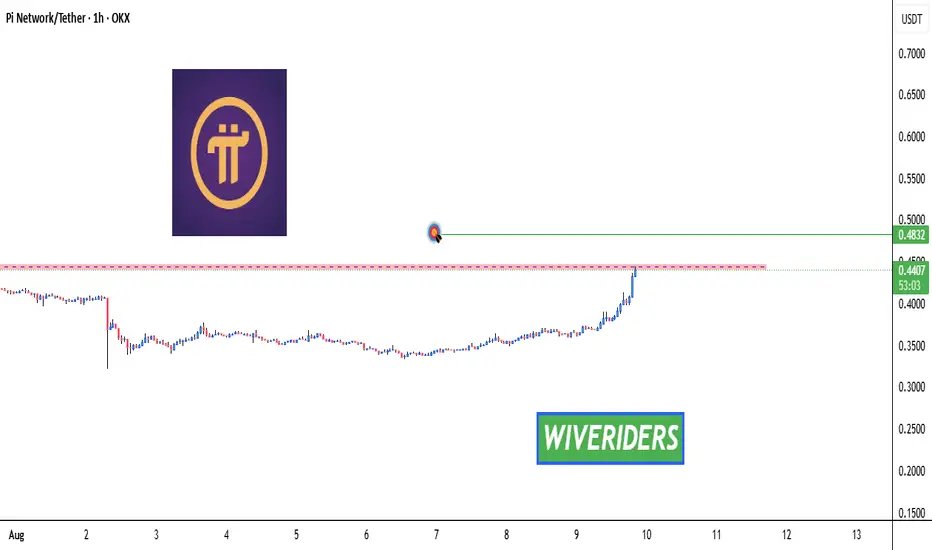
PI Breakout Watch – Red Resistance Being Tested!🚨 NASDAQ:PI Breakout Watch – Red Resistance Being Tested! 🔴⏳
NASDAQ:PI is testing the red resistance zone.
📊 If breakout confirms, next move could target:
🎯 First Target → Green line level
A breakout could trigger bullish continuation and upside momentum.