GOLD - at CUT N REVERSE area? what's next??#GOLD... market just holds his multi times holds area 3289
keep close that area and if market hold it in that case you we can expect a spike to upside
NOTE: we will go for CUT N REVERSE at breakage of 3289
good luck
trade wisely
Tradingview

XRP Ready for PUMP or what ?Ripple has successfully broken out of the falling wedge pattern and retested the breakout zone,the price is holding firmly above previous resistance, which now acts as strong support.
Continued strength could lead to upward movement toward targets at $2.65, $2.95, and $3.35
Stay Awesome , CobraVanguard

TradeCityPro | Bitcoin Daily Analysis #104👋 Welcome to TradeCity Pro!
Let’s dive into Bitcoin and key crypto indices. As usual, in this analysis I’ll walk you through the triggers for the New York futures session.
⏳ 1-Hour Timeframe
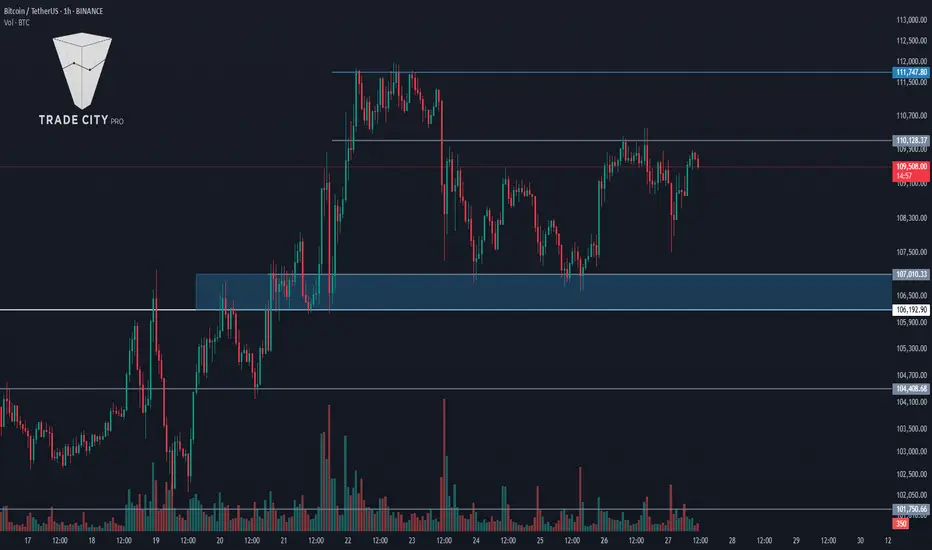
On the 1-hour chart, as you can see, Bitcoin was once again rejected from the 110128 level yesterday and is now hovering near 108237.
✔️ At the moment, price hasn’t yet touched the 108237 support. If it manages to stay above this level without breaking below, the chances of retesting 110128—and even breaking above it—increase.
🔍 If 108237 is broken, a short position could be considered. However, keep in mind that this setup goes against the current uptrend. As mentioned in previous analyses, the 106192–107010 range is a major support zone, and as long as price remains above it, the trend remains bullish.
📉 The main short trigger would be a break below this key support. If that occurs, it could introduce strong bearish momentum. An RSI break below 38.57 would serve as a momentum confirmation.
✨ During this pullback from 110128, market volume has been decreasing, which indicates the strength of the ongoing uptrend.
💥 If 110128 is broken, and considering the strong trend, a long position could be initiated. An RSI break above 50 would provide additional confirmation. The primary long trigger remains a break above 111747.
👑 BTC.D Analysis
Bitcoin Dominance continued to fall yesterday, reaching as low as 63.87. It has shown a slight bounce from that level and is currently in a mild upward correction.
⭐ If a lower high forms below 64.18, the chances of breaking below 63.87 increase. However, if the correction goes beyond 64.18, the probability of resuming the uptrend will grow.
📅 Total2 Analysis
Yesterday, Total2 was rejected from 1.24 and corrected down to 1.21. If price bounces from here and heads back toward 1.24, the chances of breaking that resistance will rise.
📊 If 1.21 fails to hold, a deeper correction toward 1.18 could follow.
📅 USDT.D Analysis
USDT Dominance is forming a lower high compared to 4.56. If this plays out and 4.49 is broken, it would confirm a bearish move.
⚡️ On the other hand, if 4.56 is broken to the upside, the move could extend toward 4.62.
❌ Disclaimer ❌
Trading futures is highly risky and dangerous. If you're not an expert, these triggers may not be suitable for you. You should first learn risk and capital management. You can also use the educational content from this channel.
Finally, these triggers reflect my personal opinions on price action, and the market may move completely against this analysis. So, do your own research before opening any position.

XAUUSD (Gold/USD) – Smart Money Setup with Key Zones & Target 🧠 Market Summary:
This chart shows a classic Smart Money Concept (SMC) play. We're looking at how big players (banks, institutions) trap retail traders, push price through liquidity zones, and move toward their real targets.
📌 Detailed Breakdown:
1️⃣ Ellipse Zone (Left Side – Accumulation Phase)
This shaded ellipse shows where price was moving sideways in a tight range. This is a classic accumulation zone, meaning big players were quietly building their long positions.
✅ Price stayed in this range from May 20–21 before breaking out with strong bullish candles.
👉 What this means: Institutions are loading up. Once they’re filled, they push price upward fast.
2️⃣ Central Zone of Market (Green Diamond)
After the breakout, price made a small pause/retest, which we marked with a green diamond.
This is a re-accumulation area—a temporary consolidation before another push up. It’s also a mid-point, showing the “central engine” of this price move.
👉 What this means: Market still bullish here, collecting more orders.
3️⃣ Major Resistance Zone (Top of Chart)
Price reached this supply zone near 3,360–3,370 and immediately faced strong rejection.
You can see:
Long wicks at the top
Bearish pressure stepping in
Start of a curve formation
👉 What this means: Big players are offloading their long positions and preparing for a reversal.
4️⃣ Rounded Top Curve (Distribution Phase)
Notice the arc shape drawn over the candles.
This is a distribution pattern — a rounding top that shows price is topping out slowly. It’s often a sign that smart money is exiting while trapping late buyers.
🔻Price then dropped aggressively, breaking structure.
5️⃣ BOS (Break of Structure)
A major bearish signal occurred here.
Price broke a recent low and created a BOS (Break of Structure) — a strong confirmation that the market has shifted from bullish to bearish.
👉 What this means: Now we look for retracement entries to go short.
6️⃣ 50% Retracement + Reversal Area
After the BOS, price pulled back to the 50% Fibonacci level and hit a small resistance zone (highlighted in purple). This is a classic area for smart entries.
✅ This level rejected price again — showing bearish confirmation.
7️⃣ Target Zone – 3,330.055
A clean, well-defined target area where:
Liquidity rests
Previous orders may get triggered
Market could react strongly
👉 If price pushes into this zone again, expect a reaction (either continuation or a reversal).
8️⃣ Support Zone – 3,290.345
This is your final support zone if the market continues to drop.
If price breaks this support, it could open room for a larger bearish move.
🎯 Trading Plan (Example):
📈 If price retraces to 3,330.055 and shows rejection → consider short setup
📉 Watch 3,290.345 for bounce or breakdown
❌ Invalidation: Break above 3,370 (major resistance)
💡 Bonus Tip – Trading Psychology:
“Smart money doesn’t chase. It waits for the trap to be set, then strikes with precision.”
Stay patient. Don’t rush entries. Let price come to your zones.
🏁 Summary:
This chart is a full example of smart money manipulation, showing:
Accumulation → Expansion → Distribution → Breakdown
BOS + 50% retrace = high-probability short
Key zones: 3,330 (Target) & 3,290 (Support)
📢 Don’t Forget:
If this analysis helped, drop a like, share, or comment your view below!
#XAUUSD #GoldAnalysis #SmartMoney #PriceAction #TradingView #Minds #ForexStrategy #GoldSetup #SMC #LiquidityZones

CHFJPY - Scalping is Back! Let's see...Hi guys. I will just be scalp here.
Entry price: 173.884 TP: 173.332 SL: 174.438 Win/Loss Ratio 1:1!
Let's do some good scalp! ^^

Be careful with ETH !!!Currently, ETH is forming an ascending triangle, indicating a potential price increase. It is anticipated that the price could rise, aligning with the projected price movement (AB=CD).
However, it is crucial to wait for the triangle to break before taking any action.
Give me some energy !!
✨We spend hours finding potential opportunities and writing useful ideas, we would be happy if you support us.
Best regards CobraVanguard.💚
_ _ _ _ __ _ _ _ _ _ _ _ _ _ _ _ _ _ _ _ _ _ _ _ _ _ _ _ _ _ _ _
✅Thank you, and for more ideas, hit ❤️Like❤️ and 🌟Follow🌟!
⚠️Things can change...
The markets are always changing and even with all these signals, the market changes tend to be strong and fast!!

Steepening Yields & Uncertainty: What says the Bond Markets?
CBOT:ZN1!
US Yield Curve in Image Above
Showing yields on May 27, 2024 vs May 27, 2025 . What happened in a year and how to understand this?
Looking at the image above, the yield curve was inverted on this day last year. Comparing last year’s term structure to today’s, we can see that the yield curve has steepened sharply.
What does this signify? Let’s dive deeper as we share our insights and assessment of what the bond market is doing.
At the March 16, 2022, meeting, the FED finally pivoted away from their "transitory inflation" narrative to a significant supply shocks narrative—supply-demand imbalances and Russia-Ukraine war-related uncertainty. This started a rate hike cycle, with rates peaking at 5.25%–5.50% in the July 26, 2023, meeting.
The Fed Funds rate was reduced by 100 bps, with a cut of 50 bps on September 18, 2024, and two cuts of 25 bps in the November and December 2024 meetings. The FED paused its rate cutting at the start of the year, citing—as we have all heard recently—that the inflation outlook remains tilted to the upside, and given policy uncertainty and trade tariffs, the risk to slowing growth continues to increase. Businesses are holding back spending due to this confusion and continued uncertainty. ** Refer to the image of FED rate path above.
The start of the rate hike cycle also began the FED’s balance sheet reduction program—from a peak of $8.97 trillion to the current balance of $6.69 trillion. **Refer to the image of FED's balance sheet above.
Rates remained elevated at these levels to bring down inflation, which peaked at 9.1% in June 2022. Inflation has currently eased to 2.3% as of April 2025. Refer to the CPI YoY image above.
Ray Dalio, Jamie Dimon, and most recently non-voter Kashkari (FED) highlighted stagflationary risks. FED Chair Powell noted risks to both sides of its dual mandate in its most recent meeting March 19, 2025.
In the March meeting, they also announced a slower pace of reducing Treasury securities, agency debt, and agency mortgage-backed securities. In this announcement, Treasury securities reduction slowed from $25 billion to $5 billion per month, while maintaining agency debt and agency mortgage-backed securities reduction at the same pace.
Many participants and analysts noted this as a dovish pivot. However, given the current market conditions and the supply-demand imbalance emerging within US Treasury and bond markets, we note the rising yields.
The yield curve steepening signifies that investors want better return on their bond holdings. The interesting turn of events here is that US Treasuries and bonds have not provided the safety they usually do in times of uncertainty and policy risk. The dollar has fallen in tandem with bonds, resulting in a devalued dollar and rising yields. Thirty-year yields touched the 5% level, and the DXY index traded at levels last seen in March 2022.
Looking deeper under the hood, we note that a repeat of COVID-pandemic-style stimulus measures may perhaps result in an uncontrollable inflation spiral. The ballooning twin deficits—i.e., trade and budget deficits—with the new “Big Beautiful Bill,” or as some analysts joked, noting this as a foreshadowing of the newest credit rating: “BBB.”
Any black swan event may just be the catalyst needed to tip these dominoes to start falling.
As we previously noted in some of our commentary, debt service payments are now more than defense spending.
The new bill, once passed, is going to add another $2.5 trillion to the deficit. While the deficit is an issue in the US, it is important to note that it is a global issue.
The key question here will be: in due time, will the US bond market and US dollar regain their usual haven status? Or will we continue seeing diversification into Gold, Bitcoin, and global markets?
So, to summarize these mechanics playing out in the US and global markets—in our view—sure, the US administration, one may debate, is not helping by creating this environment of uncertainty in global trade, coupled with a worsening deficit and higher-for-longer rates. The markets currently are perhaps at their most unpredictable stage, with so much going on in the US and across the world.
It is still too early to write off US exceptionalism, and there will be value in rotating back to US markets once the dust on policy uncertainty settles. We suggest that investors stay diversified, watch for any upside surprises to the inflation and do not chase yields blindly as the move may already be overstretched. It is also our view that we are past the extreme policy uncertainty having already noted Trump put when ES Futures fell over 20%.
Although note that near All-time highs or at 6000 level, we are likely to see further headline risks until trade deals are locked in. As always, be nimble, pragmatic and be ready to adjust with evolving market conditions.
Definitions
Plain-language definition: A “basis point” (bps) is 0.01%. So, a 50 bps cut = 0.50% reduction in interest rates.
Plain-language definition: A steep yield curve means long-term interest rates are much higher than short-term ones. This can reflect rising inflation expectations or increased risk.
A “black swan event”—an unpredictable crisis—could set off a chain reaction if confidence in US finances weakens further.
Trade deficit: Importing more than exports
Budget deficit: Government spending far more than it earns

TradeCityPro | Bitcoin Daily Analysis #103👋 Welcome to TradeCity Pro!
Let’s dive into Bitcoin and key crypto indices. As usual, in this analysis I’ll walk you through the triggers for the New York futures session.
⏳ 1-Hour Timeframe
As you can see on the 1-hour chart, Bitcoin was rejected from the 110128 resistance yesterday and began a pullback, but it didn't reach the support at 107010 — instead, it formed a higher low and is now moving back toward 110128.
📊 Buy volume during this bullish leg has been relatively low, which isn’t ideal for a strong uptrend and indicates potential weakness.
📈 If the 110128 resistance breaks, a long position can be considered. However, if you take this trade, I suggest not setting your target at 111747 — instead, aim for higher targets and hold the position longer.
💥 The main long trigger remains at 111747. So if you missed or don’t want to trade the 110128 breakout, you can wait for this higher confirmation.
🔽 As for short setups, just like yesterday, it's still better to wait for a trend reversal. As long as the price remains above the support zone, the uptrend remains intact.
👑 BTC.D Analysis
Bitcoin Dominance broke above 64.32 yesterday but failed to hold and fell back below it, also breaking the 64.18 support. It’s now moving toward 63.97.
⭐ Currently, there is strong bearish momentum in BTC.D, and if 63.97 is broken, this downward move is likely to continue.
📅 Total2 Analysis
Total2 printed a higher low above 1.18 and has now broken above the 1.22 resistance.
✨ If it can hold above this level, we could see an upward move toward 1.26. For bearish confirmation and short positions, a break below 1.18 would be the key trigger.
📅 USDT.D Analysis
USDT Dominance printed a lower high compared to 4.62 and is now sitting on support at 4.49. A break below this level could push the dominance down to 4.38.
🎲 To confirm a bullish reversal in USDT.D, we would need to see a break above 4.62.
❌ Disclaimer ❌
Trading futures is highly risky and dangerous. If you're not an expert, these triggers may not be suitable for you. You should first learn risk and capital management. You can also use the educational content from this channel.
Finally, these triggers reflect my personal opinions on price action, and the market may move completely against this analysis. So, do your own research before opening any position.
GOLD - it's breakout? What's next??#GOLD - market just broke his today supporting area that was around 3336-38
Keep close if that is proper breakout then we can expect a drop towards our further supports.
Good luck
Trade wisely

TradeCityPro | AVAX: Watching Key Resistance in RWA Uptrend👋 Welcome to TradeCity Pro!
In this analysis, I’ll be reviewing the AVAX coin — one of the popular RWA projects in crypto with a high market cap.
🔍 This coin currently has a market cap of $9.94 billion and ranks 14th on CoinMarketCap.
⏳ 4-Hour Timeframe
As shown on the 4-hour chart, there’s a clear ascending trendline that has been tested several times. There was also a fake breakout below the trendline, and now price is reacting to it once again.
⚡️ A resistance level has formed at 23.90, which the price has reacted to. Given the recent bounce off the trendline, the probability of breaking 23.90 has increased.
✔️ A break above 23.90 offers a potential long entry, though this isn’t the main long trigger. The target for this move would be 25.78. The main long position should be considered after a breakout above 25.78.
💥 The 25.78 zone is a key resistance level that marked the top of previous bullish legs, so breaking it could lead to a strong bullish trend.
🔽 On the flip side, if the price prints a lower high below 25.78 and moves back toward the trendline, the probability of breaking the trendline increases.
✨ If the trendline breaks, the confirmation trigger would be 22.10. A break below 22.10 opens a short setup, with the next support level located at 19.23.
📊 Currently, market volume is favoring the buyers. With renewed buying volume off the trendline, if this momentum continues, the bullish scenario becomes more likely.
📝 Final Thoughts
This analysis reflects our opinions and is not financial advice.
Share your thoughts in the comments, and don’t forget to share this analysis with your friends! ❤️

Skeptic | Watchlist #1 - May 27, 2025: XAG/USD, EUR/USD, USD/JPYHey everyone, Skeptic here! Starting today, I’m kicking off a daily watchlist to share the setups I’m eyeing! 😎 These are the pairs I’m personally trading or watching for trigger activations. Feel free to create a dedicated section in your TradingView called “ Skeptic ” and plug in this watchlist with the triggers I provide. Then, based on your own strategy, jump into trades at those key levels if they align with your plan. My watchlist format will include a screenshot of the 4H or 1H timeframe with long/short triggers marked on the chart. If needed, I’ll add quick explanations or tips, but I’m keeping it short, sharp, and to the point to maximize your value. The goal? Help you blend these setups with your own strategy without overloading you with fluff. Let’s dive into today’s Daily Forex Watchlist!
👀XAG/USD
Long Trigger : 33.68855,
Short Trigger : 31.91991.
👀EUR/USD
Long Trigger : 1.14183,
Short Trigger : 1.12663.
👀USD/JPY
Long Trigger : 144.125,
Short Trigger : 142.218.
💬 Let’s Chat!
If this watchlist sparked some ideas, give it a quick boost—it means a ton! 😊 Thanks for joining me— let’s grow together! ✌️

TradeCityPro | ADAUSDT Is It Time to Buy Cardano?👋 Welcome to TradeCityPro Channel!
Let’s dive in and analyze one of the market’s favorite coins, Cardano (ADA), which is in a strong position compared to most altcoins and is holding at higher resistance levels.
🌐 Overview Bitcoin
Before starting the analysis, I want to remind you again that we moved the Bitcoin analysis section from the analysis section to a separate analysis at your request, so that we can discuss the status of Bitcoin in more detail every day and analyze its charts and dominances together.
This is the general analysis of Bitcoin dominance, which we promised you in the analysis to analyze separately and analyze it for you in longer time frames.
Bitcoin Chart
📊 Weekly Timeframe
On the weekly time frame, ADA, like SOL, SUI, XRP, and most of the top ten coins in the market, is still in a better situation, with the price fluctuating at higher levels.
After being rejected at 1.1983 and losing support at 0.7959, we experienced a sharp drop to 0.50, driven by panic in the market due to Trump and U.S. tariffs on other countries.
Currently, in the weekly time frame, we’re still at higher levels compared to most of the market, and we can expect a strong move going forward. It’s worth noting that breaking 1.1988 will provide the best trigger for a buy.
📈 Daily Timeframe
Interesting things are happening on the daily time frame, and we’re clearly still at higher levels than other altcoins. If the market itself undergoes a trend change, we can be ready for a long trigger sooner.
After breaking 0.8204 and losing the 0.236 Fibonacci level, we experienced a sharp decline that also saw high volume. I expected that after this volume, we’d transition from volatility to forming a range box, and that’s exactly what’s happening. We’re forming a box between 0.6777 and 0.8204, but if today’s daily candle closes as it is, the downtrend will continue!
Additionally, after this event, we had a break of the support floor that turned out to be a fakeout, leading us to establish a new support level. Currently, our most important support is 0.6090, and we’re moving along a daily trendline. If we bounce from this trendline and break the 0.8419 resistance, it will be the best trigger for a buy. On the other hand, if the support breaks and we lose the 0.7417 low, we can go for a short position.
📝 Final Thoughts
Stay calm, trade wisely, and let's capture the market's best opportunities!
This analysis reflects our opinions and is not financial advice.
Share your thoughts in the comments, and don’t forget to share this analysis with your friends! ❤️

TradeCityPro | Bitcoin Daily Analysis #102👋 Welcome to TradeCity Pro!
Let’s dive into Bitcoin and key crypto indices. As usual, in this analysis I’ll walk you through the triggers for the New York futures session.
⏳ 1-Hour Timeframe
As you can see in the 1-hour timeframe, yesterday we saw a bullish move that pushed the price up to and beyond the 109229 level.
🔍 In the previous analysis, I mentioned that if the price finds support before reaching 106192 and breaks above 109229, we could draw a support zone between the recent low and 106192. That’s exactly what happened — I’ve now marked the support range between 106192 and 107010.
💥 This is a critical support area, and if price revisits it later, it could act as a strong support. For now, the price is moving upward, and after breaking 109229, the next resistance is at 111747.
✔️ If you didn’t open a long position on yesterday’s trigger, you’ll need to wait for the break of 111747. If you already have an open position, you can hold it for now, as Bitcoin’s long-term trend is bullish and the move may continue.
📊 If buying volume increases and RSI breaks above 70 and enters the Overbought zone, bullish momentum will strengthen significantly, and the chances of breaking 111747 will increase.
📉 As for short positions or trend reversal — it's better not to consider them yet, as long as the price remains above the support zone. The uptrend is strong and offers better setups.
👑 BTC.D Analysis
Bitcoin dominance is still oscillating below the 64.32 level and hasn’t broken it yet. A local low has formed around 64.18.
🔔 A break above 64.32 would confirm the start of the next bullish leg in dominance. Conversely, breaking 64.18 could lead to a deeper correction toward 63.97 or even 63.50.
📅 Total2 Analysis
Yesterday, the descending trendline I highlighted was broken, and price moved up to 1.22.
✨ Breaking 1.22 would confirm the start of a larger bullish leg toward 1.26. If Total2 declines instead, we could enter on a break below 1.118.
📅 USDT.D Analysis
Yesterday, Tether dominance was rejected from the 4.62 resistance and also broke through 4.51.
🎲 If price moves toward 4.38 again, the probability of breaking this level will rise significantly — especially since a lower high has formed at 4.72, indicating that bearish momentum could be entering the market.
❌ Disclaimer ❌
Trading futures is highly risky and dangerous. If you're not an expert, these triggers may not be suitable for you. You should first learn risk and capital management. You can also use the educational content from this channel.
Finally, these triggers reflect my personal opinions on price action, and the market may move completely against this analysis. So, do your own research before opening any position.

TradeCityPro | Deep Search: In-Depth Of Arbitrum👋 Welcome to TradeCity Pro!
Today we have a deep research analysis on the Arbitrum project, and in this review, I’ll fully break down the project for you. First, let’s take a look at the project’s information, and then we’ll analyze the ARB coin from a technical perspective.
🌉 What is Arbitrum?
Arbitrum is a Layer 2 scaling solution for Ethereum that leverages Optimistic Rollups to enhance the network’s speed, scalability, and cost-efficiency. By offloading the majority of computation and data storage to off-chain processes, Arbitrum significantly reduces transaction fees while increasing throughput — all without compromising Ethereum’s security and full compatibility.
The network’s native token, ARB, plays a central role in governance. With the launch of the decentralized organization Arbitrum DAO, holders of ARB can participate in critical decision-making related to protocol upgrades, treasury allocations, and electing members of the Security Council.
🛠 Development and Roadmap
Arbitrum is developed by the U.S.-based company Offchain Labs. The 2023 roadmap introduced several key developments:
The launch of Orbit, a Layer 3 framework
Stylus integration, allowing smart contracts to be written in Rust, C++, and other popular languages
Increased inclusion of institutional validators
Enhanced decentralization of Arbitrum One
On March 16, 2023, Arbitrum announced that 12.75% of its total ARB token supply would be distributed via airdrop to early users and DAOs in its ecosystem. The token generation event (TGE) was executed on March 23, 2023.
👥 Founders of Arbitrum
Arbitrum was founded by three computer scientists from Princeton University:
Ed Felten, Professor at Princeton and former U.S. Deputy CTO under President Obama — Co-founder and Chief Scientist
Steven Goldfeder, Ph.D. in Computer Science — CEO
Harry Kalodner, Ph.D. candidate — CTO
In 2021, Offchain Labs raised $120 million in a Series B funding round led by Lightspeed Venture Partners, resulting in a $1.2 billion valuation. Other participants included Polychain Capital, Pantera Capital, and Mark Cuban.
🧬 What Makes Arbitrum Unique?
Arbitrum sets itself apart through its implementation of Optimistic Rollups, delivering several distinct advantages:
Full EVM Compatibility: Ethereum apps can run on Arbitrum without code changes
High Throughput: Capable of processing thousands of transactions per second with low fees
Developer Flexibility: Stylus allows for smart contract development in Rust, C++, and more
True Decentralization: Transactions are validated by a distributed set of validators, without relying on centralized sequencers
Arbitrum supports a dynamic ecosystem that includes projects like GMX, Treasure (MAGIC), Camelot (GRAIL), Radiant Capital (RDNT), Vela Exchange, ZyberSwap, Dopex, PlutusDAO, and Jones DAO.
As of the latest data from DeFiLlama, Arbitrum reached a peak TVL of $3.2 billion in November 2021 and currently maintains around $1.85 billion, making it the largest Layer 2 network by total value locked.
💸 Token Supply and Allocation
The ARB token has a total fixed supply of 10 billion. It is not used for gas payments — transactions are settled in ETH or other supported ERC-20 tokens — but serves solely as a governance asset.
The distribution breakdown is as follows:
DAO Treasury: 42.78%
Offchain Labs team and advisors: 26.94%
Investors: 17.53%
Airdrop to users: 11.62%
Airdrop to DAOs: 1.13%
ARB holders participate in governance over both Arbitrum One and Nova, voting on upgrades, resource allocation, feature integration, and treasury decisions.
🛡 Network Security
Arbitrum’s security is anchored in Ethereum. Transactions are executed off-chain and posted in batches to Ethereum’s mainnet via Optimistic Rollups. These batches are assumed valid unless contested during a designated fraud-proof window, during which challengers can submit cryptographic evidence of invalidity.
💱 Where to Buy ARB
ARB is available across a wide range of trading platforms, including:
Centralized exchanges: Binance, Coinbase, KuCoin, Bybit, Kraken, and Bitfinex
Decentralized exchanges: Uniswap V3 (Ethereum & Arbitrum) and SushiSwap (Arbitrum)
Fundraising and Token Vesting
Since its inception in 2019, Offchain Labs has completed three major fundraising rounds totaling over $143 million.
The Seed round raised $3.7 million from Pantera Capital and Compound VC. In April 2021, the company secured $20 million in a Series A round led by Lightspeed and supported by Mark Cuban. The most significant round, Series B, came in August 2021, with $100 million raised and a valuation of $1.2 billion.
Approximately 17.5% of ARB’s total supply was allocated to these investors, subject to a one-year cliff followed by monthly vesting. These funds provided the financial foundation for ecosystem growth, DAO development, and further decentralization.
🔓 Token Unlocks and Vesting Status
As of May 2025, the ARB token distribution is as follows:
Unlocked: 4.278 billion ARB (42.74%)
Locked: 2.378 billion ARB (23.72%)
Untracked: 3.356 billion ARB (33.54%)
Market Cap of Unlocked Tokens: ~$1.708 billion
The majority of remaining tokens will unlock monthly until March 2027. Most of these allocations pertain to the team, advisors, and early investors.
Current token distribution by role:
Team, future members, and advisors: 40.53%
Investors: 26.38%
DAO Treasury: 13.91%
Arbitrum ecosystem DAOs: 1.70%
Individual wallets: 17.48%
On-Chain Activity – May 2025 Snapshot
According to DeFiLlama’s latest figures, Arbitrum remains one of the most active and liquid Layer 2 environments. Key indicators include:
TVL: $2.63 billion
Stablecoin market cap: $2.76 billion
Bridge-in value: $14.02 billion
Treasury balance: $21.26 million
24h active addresses: 286,467
24h network fees: $33,415
24h protocol revenue: $33,032
24h dApp revenue: $92,966
24h DEX volume: $513 million
24h derivatives volume: $299 million
24h capital inflow: $163.4 million
ARB price: ~$0.40
Circulating market cap: ~$1.92 billion
Fully diluted valuation (FDV): ~$3.96 billion
Revenue Performance
Arbitrum has maintained a steady and upward revenue trend throughout the past year. On average, the network generates around $2.7 million per month in protocol revenue — primarily from transaction fees. dApps on the network contribute substantially as well, especially through DEXs, derivatives, and lending platforms.
With daily protocol revenue averaging $30,000–$35,000, the data reflects ongoing, high-frequency use by both end-users and developers. This recurring income stream enhances the network’s long-term sustainability.
🎁 The ARB Airdrop
On March 16, 2023, Offchain Labs announced the ARB airdrop as a core component of decentralizing network governance through the creation of the Arbitrum DAO.
A total of 12.75% of ARB supply was distributed:
11.62% to early users
1.13% to DAOs contributing to the Arbitrum ecosystem
Eligibility was determined via a point-based system that rewarded meaningful engagement — such as using Arbitrum bridges, interacting with dApps, and providing liquidity. The eligibility cutoff date was March 1, 2023.
The token generation event took place on March 23, 2023, with ARB going live on major exchanges the same day. Unlike ETH, ARB does not serve as gas; instead, it is used solely for governance.
✅ Conclusion
Over the past two years, Arbitrum has become one of the most essential infrastructure layers in Ethereum’s Layer 2 ecosystem. Leveraging Optimistic Rollup technology, it has successfully delivered scalability, speed, and cost-efficiency to both users and developers. From a tokenomics perspective, the total supply of ARB is capped at 10 billion, of which over 4.2 billion have already been unlocked. Approximately 2.3 billion tokens remain locked under a structured vesting program set to continue through 2027. A significant portion of these tokens is allocated to the core team, advisors, and early investors.
On-chain data further supports Arbitrum’s leading position: with over $2.6 billion in total value locked (TVL), more than $2.7 billion in stablecoin market cap, and over $14 billion bridged into the network, it has firmly established itself among the most robust Layer 2 platforms. This is backed by more than 280,000 active daily addresses and substantial volumes in both decentralized exchanges and derivatives markets.
Economically, Arbitrum generates an average daily protocol revenue of $30,000 to $35,000, while dApps on the network collectively bring in over $90,000 daily. On a monthly basis, network revenue exceeds $2.7 million — ranking Arbitrum second only to Base among Layer 2 networks in revenue generation.
In summary, Arbitrum stands strong not only in its technical foundation but also in its economic sustainability. With a stable revenue cycle, progressive token unlocks, and consistent user engagement, the network is well-positioned to expand its ecosystem, strengthen DAO governance, and reinforce its competitive edge in the evolving Layer 2 landscape.
Now that we’ve reviewed the project, let’s go to the chart and analyze it technically.
📅 Weekly Timeframe
As you can see in the weekly timeframe, after the token was listed in mid-2023, and following a correction, the price made a bullish move up to a high of 2.0997. After that, ARB entered a downtrend.
There was a very important support level at 0.8038, which was the most critical support for ARB, but during the sell-off, this level was broken. The price formed a new low at 0.4844, then made a pullback to 1.2115 before continuing its decline and reaching a new low at 0.2618.
The RSI oscillator during this downtrend remained below the 50 zone, except for when price pulled back to 1.2115 — indicating that the overall momentum has been bearish. For a trend reversal and bullish confirmation, if the RSI makes a higher high and higher low above the 50 level, we can take that as a momentum confirmation.
As for price confirmation, the 0.4844 zone is a good reference — the price is currently interacting with this level and ranging just below it. If this level is broken and price consolidates above it while forming a higher high and higher low, we will get confirmation of a trend reversal.
This can also be used as a trigger for spot buying. However, it’s better to wait for Bitcoin dominance to turn bearish and then look for a trigger on this chart.
📅 Daily Timeframe
In the daily timeframe, we can better observe the price movements. As shown, after rebounding from the 0.2618 bottom, price formed a higher low and higher high, and is currently building a base at the 0.3747 level after reaching the 0.4844 resistance.
For long positions or spot buying, given that the trend has turned bullish in the daily timeframe, we can enter if price reacts positively to the 0.3747 support. The main trigger remains the breakout of 0.4844.
RSI has been able to stabilize above the 50 level during this cycle. If this continues and RSI stays above 50, the likelihood of a sustained bullish trend significantly increases.
The main confirmation of ARB’s bullish reversal will come from breaking 0.4844. But if the price fails to break this level and instead prints a lower high, we could consider a short position with a break of 0.3747.
The key support level for ARB is 0.2618. For the broader trend to return to bearish, this level must be broken. If that happens, we’ll likely see some very sharp downward moves.
❌ Disclaimer ❌
Trading futures is highly risky and dangerous. If you're not an expert, these triggers may not be suitable for you. You should first learn risk and capital management. You can also use the educational content from this channel.
Finally, these triggers reflect my personal opinions on price action, and the market may move completely against this analysis. So, do your own research before opening any position.

US30 - At Resistance? Holds or not??#US30 #DOWJONES - market just reached near to his current resistance region.
And if market hold it in that case we can expect a drop from here.
So don't be lazy here and only short below that.
Note: we will go for cut n reverse above region on confirmation.
Good luck
Trade wisely

Skeptic | Silver (XAG/USD): Bullish Breakout Ready to Surge?Hey everyone, Skeptic here! Let’s dive into a quick Silver (XAG/USD) update—I’m catching some serious bullish vibes! 😎
On the 4-hour chart , Silver’s teasing a major resistance level right now. Keep your eyes locked on 33.68855 . If we break and hold above it, we could see a nice rally kick off. You can also use RSI hitting overbought to confirm that bullish momentum is heating up. Just stay patient and wait for that breakout confirmation to ride the wave! 👀 By the way, for you forex traders out there, what’s your go-to alternative to volume, which is super key in crypto? Drop your thoughts in the comments so we can learn together! 📝
💬 Let’s Chat!
If this sparks some trading ideas, give it a quick boost—it means a lot! 😊 Want me to dive into another pair or setup? Drop it in the comments. Thanks for hanging out—keep trading sharp! ✌️

Skeptic | USD/CHF Analysis: Short Setups Ready to Pop!Hey everyone, Skeptic here! Let’s kick off the week with a sharp USD/CHF analysis, a pair that’s flashing some juicy short opportunities! 📉 Stick around as I break down why this could be a prime setup. Let’s dive in with the Daily Timeframe. 📊
Daily Timeframe: The Big Picture
USD/CHF has been rocking a major bullish trend, but in recent weeks, it’s slipped into a secondary corrective trend, pulling back to the 0.382 Fibonacci retracement level. This tells us the bullish momentum is still alive and kicking. The last candle, closed on May 12, was a full bearish engulfing pattern, showing that despite the correction, buyer strength is weak, and sellers are taking over. Because of this, if our short triggers activate, we could ride the continuation of the major bullish trend (likely a typo in the original, as the context suggests a bearish move for shorts) and target levels at 0.81904 and 0.80865 . If 0.80865 breaks, per Dow Theory, the major bullish trend officially resumes, and we can open shorts with more confidence and higher risk. With this big-picture view, let’s zoom into the 4-Hour Timeframe to find our long and short triggers.
4-Hour Timeframe: Long & Short Setups
For our short setup, the main trigger is a break below the support at 0.83264 . As you can see, we’ve reacted to this support twice, but each time, we formed lower highs, signaling this support is getting weaker and weaker. This makes a break more likely. You could place a stop sell below this level, but personally, I wait for a breakout candle on the 15-minute timeframe to confirm. For a long setup, I’m not opening longs until we consolidate above 0.83902 and see uptrend momentum return. The risk of hitting a stop loss is too high otherwise, and since we’d be trading against the main trend, sudden reversals are likely, giving us a lower R/R. 😎
💬 Let’s Talk!
If this analysis helped you out, give it a quick boost—it means a lot! 😊 Got a pair or setup you want me to tackle next? Drop it in the comments, and I’ll get to it. Thanks for hanging out, and I’ll see you in the next one. Keep trading smart! ✌️

"BTC - Time to buy again!" (Update)As mentioned in the previous analysis, the price reached the top of the wedge and broke out with a price increase. Now that Bitcoin's price is above the wedge, it can be said that with a slight price correction, it could follow the pattern and make a measured move where AB = CD.
PREVIOUS ANALYSIS
Give me some energy !!
✨We spend hours finding potential opportunities and writing useful ideas, we would be happy if you support us.
Best regards CobraVanguard.💚
_ _ _ _ __ _ _ _ _ _ _ _ _ _ _ _ _ _ _ _ _ _ _ _ _ _ _ _ _ _ _ _
✅Thank you, and for more ideas, hit ❤️Like❤️ and 🌟Follow🌟!
⚠️Things can change...
The markets are always changing and even with all these signals, the market changes tend to be strong and fast!!

TradeCityPro | Bitcoin Daily Analysis #101👋 Welcome to TradeCity Pro!
Let’s dive into the analysis of Bitcoin and key crypto indices. As usual, I’ll go over the futures session triggers for the New York market.
⏳ 1-Hour Timeframe
As you can see on the 1-hour chart, after Bitcoin reached the top at 111,747, the market entered a corrective phase and BTC has pulled back to around 106,192.
🔍 For now, I’m not adjusting the 106,192 level because it remains a very strong support zone. If the price reaches this level and shows a solid reaction, we can look for entry triggers on lower timeframes.
💥 Currently, the trigger for a long position is at 109,229. This level previously caused the price to make a lower low, so breaking it could inject strong bullish momentum into the market.
📈 The main long trigger is at 111,747. However, this level is a strong supply zone and won’t be easy to break, so trading this level will be challenging.
📊 On the bearish side, we’re watching the RSI oscillator for a potential entry into the oversold zone. If RSI enters oversold territory, strong bearish momentum may follow and increase the chance of breaking below 106,192.
👑 BTC.D Analysis
After a retracement to the 63.50 level, BTC dominance has initiated a new bullish leg, reaching up to 64.32.
⭐ If 64.32 is broken, it confirms further upside toward 64.63. Conversely, if 63.97 breaks, we get confirmation of bearish momentum returning.
📅 Total2 Analysis
Total2 is currently forming a descending triangle after being rejected from 1.26T. Price is hovering around the 1.18T support.
⚡️ If 1.18T breaks, we could see a drop toward 1.15T. For a bullish breakout, we need to see a break of the trendline and activation of the 1.22T trigger.
📅 USDT.D Analysis
USDT.D is currently trading below 4.62. A break below this level would confirm further downside.
🎲 A break of 4.51 would further confirm a bearish trend in USDT dominance, signaling strength across crypto markets.
❌ Disclaimer ❌
Trading futures is highly risky and dangerous. If you're not an expert, these triggers may not be suitable for you. You should first learn risk and capital management. You can also use the educational content from this channel.
Finally, these triggers reflect my personal opinions on price action, and the market may move completely against this analysis. So, do your own research before opening any position.

TradeCityPro | HNT: Testing Resistance in DePIN Uptrend Structur👋 Welcome to TradeCity Pro!
In this analysis, I’ll review the HNT coin. The Helium project is a U.S.-based Web3 and DePIN initiative.
✔️ This coin has a market cap of $9.26 million and is ranked 97th on CoinMarketCap.
⏳ 4-Hour Timeframe
On the 4-hour chart, HNT has an ascending trendline with a resistance zone near 4.372.
💥 If this resistance is broken, the main upward move may begin, and a breakout above this level confirms a bullish trend for HNT.
📈 So for a long position, you can enter on the breakout or a pullback to this zone. The next resistance level is 5.333.
🔽 For a bearish scenario, the ascending trendline must be broken first to signal a potential reversal. A break below 3.971 would be the first confirmation of that trendline break and can be used as a short trigger.
⚡️ The main short trigger would be a break of 3.642, which could push the price down toward 3.245.
🧩 The RSI oscillator is currently sitting on the 42.91 support; a breakdown here would confirm bearish momentum for a short setup.
📝 Final Thoughts
This analysis reflects our opinions and is not financial advice.
Share your thoughts in the comments, and don’t forget to share this analysis with your friends! ❤️

USDJPY: Smart Money Reloads at Demand ZoneThis pair is showing some next-level institutional behavior right now, and the play is looking ripe for a long position — here's why:
📉 Previous Sell-Off = Liquidity Engineering
USDJPY had a strong downward leg creating a perfect internal liquidity pool, then took out that internal high (marked by triple liquidity tags 💵💵💵) just above a descending channel. That was your classic fakeout / inducement trap.
🎯 Price Tapped Into a Fresh Bullish Order Block
Price dipped deep into a refined OB (purple zone) aligned with the lower channel and then wicked hard out of it. That move created a bullish rejection wick, confirming buyer interest from smart money.
You can see price forming a micro HL structure at the edge of the demand zone — premium setup for continuation.
📍 Key Confluences:
✅ OB sits right around the mid-channel EQ
✅ Demand zone is built on top of a strong low (142.680 area)
✅ Strong risk-to-reward setup aiming for weak high and buy-side liquidity
✅ Rejection aligns with a bullish change of character (ChoCh) from lower timeframes
💥 Targets:
🔹 TP1 - Weak High at 144.400
🔹 TP2 - Buy Side Liquidity sweep at 145.514
🔹 Extended Target - Ride it to channel top / HTF imbalance fill above 146.000
📈 Trade Idea Summary:
Entry Zone: Anywhere in the OB range from 143.554 to 143.189
Stop Loss: Below 143.000 or the strong low
Risk-Reward: Easily 1:5+ if targeting full range move
🚨 Why It Matters:
This chart screams smart money accumulation at the bottom of a channel. Retail traders might still be shorting the retracement — but smart money is loading longs while price consolidates at demand.
If price clears the weak high, it could ignite a bullish rally into the upper supply zones where liquidity lies.
💬 Comment "UJ MOVE" if you're entering this sniper long!
🔁 Repost this if you’re tracking it with your team!

TradeCityPro | CFXUSDT A Wild Week of Volatility Ahead?👋 Welcome to TradeCityPro Channel!
Let’s dive in and analyze another altcoin in the market, CFX, which is likely to experience a highly volatile week ahead, offering great trading opportunities.
🌐 Overview Bitcoin
Before starting the analysis, I want to remind you again that we moved the Bitcoin analysis section from the analysis section to a separate analysis at your request, so that we can discuss the status of Bitcoin in more detail every day and analyze its charts and dominances together.
This is the general analysis of Bitcoin dominance, which we promised you in the analysis to analyze separately and analyze it for you in longer time frames.
🕒 Weekly Time Frame
CFX stands out as an older coin with prior bull-run experience. It’s trading above last year’s lows and hasn’t experienced steep declines.
Yesterday, we analyzed this coin briefly, but today, we’ll go into more detail. Unlike most altcoins that began their bullish moves from their lowest levels, CFX has already started its upward trajectory from 0.1219.
Fibonacci analysis shows that 0.1219 aligns with the 50% retracement level—a significant support both in Fibonacci terms and Dow Theory. After forming a range around this level and breaking the 0.1810 trigger, the coin moved toward its first target at 0.2596.
However, we were rejected at 0.2596 and even lost the critical support at 0.1087, dropping to the next support at 0.0647. Currently, it appears we’re pulling back to the key 0.1087 level.
📊 Daily Time Frame
On the daily chart, CFX was in a ranging box, forming higher lows. A breakout above 0.1851 was accompanied by a strong entry candle with buyer momentum, an RSI entry signal, and volume confirmation. Stop-loss was set at the daily low of 0.14.
If you followed this trigger, you’re likely in profit despite the current red daily candle. This correction is healthy, as an uptrend without pullbacks or red candles is often unsustainable.
After breaking the daily box between 0.1046 and 0.1230 and losing its support with an engulfing candle, we experienced a downward move to 0.0647. From there, sellers effectively exited the market, and buyers showed strength. After breaking 0.0823, we formed higher highs and lows. Now, after breaking 0.1046, we can consider buying for spot, with the main trigger being a break of 0.1230.
✍️ Final Thoughts
Stay level headed, trade with precision, and let’s capitalize on the market’s top opportunities!
This is our analysis, not financial advice always do your own research.
What do you think? Share your ideas below and pass this along to friends! ❤️

Maybe your biggest risk is your biggest chance !!!The price, after this potential increase, needs some correction to the Fibonacci lines.
Give me some energy !!
✨We spend hours finding potential opportunities and writing useful ideas, we would be happy if you support us.
Best regards CobraVanguard.💚
_ _ _ _ __ _ _ _ _ _ _ _ _ _ _ _ _ _ _ _ _ _ _ _ _ _ _ _ _ _ _ _
✅Thank you, and for more ideas, hit ❤️Like❤️ and 🌟Follow🌟!
⚠️Things can change...
The markets are always changing and even with all these signals, the market changes tend to be strong and fast!!
