TradeCityPro | Bitcoin Daily Analysis #99👋 Welcome to TradeCity Pro!
Let’s go over the Bitcoin and major crypto index analysis. As usual, I’ll cover the key futures session triggers for New York.
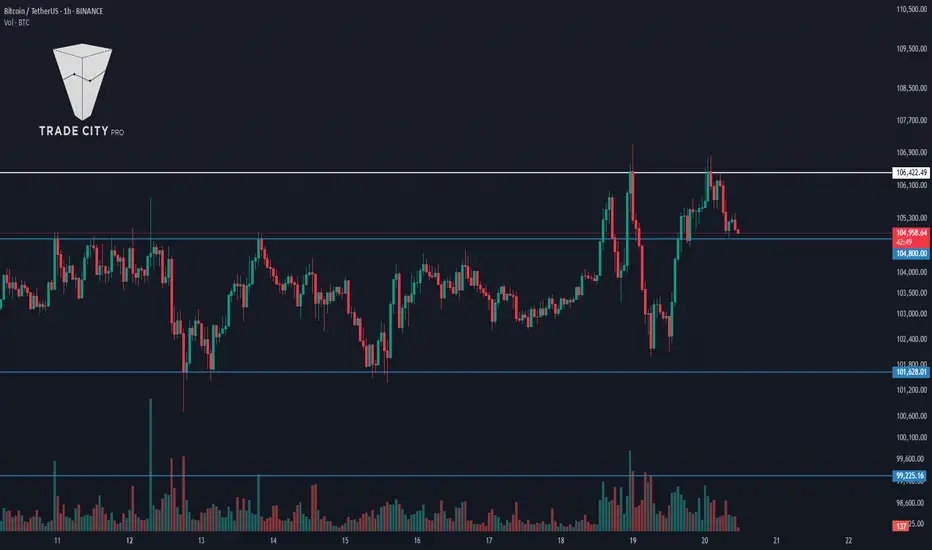
⏳ 1-Hour Timeframe
As you can see on the 1-hour chart, Bitcoin is still trading below the 111817 level and has formed a support at 110455 after multiple rejections from that resistance.
✔️ If this 110455 level breaks, we could see a deeper pullback toward 109195, and potentially even down to 106422.
✨ The RSI oscillator is currently sitting at the 50 support level again. If RSI breaks below 50, it would indicate a weakening bullish momentum and increase the likelihood of a bearish scenario.
💥 However, if RSI holds above 50, it would confirm that buyers are still in control, and the probability of the uptrend continuing increases.
⚡️ The 111817 level remains a very clean and strong trigger for a long position. If price breaks this level, the market could make another leg up.
📊 Make sure to watch the volume closely. If buy volume starts to increase, a breakout above 111817 could offer a strong entry for those not already in a position.
👑 BTC.D Analysis
Bitcoin dominance broke below 63.76 yesterday, which helped altcoins rally, but it has since recovered and moved back above that level.
📈 For now, dominance is ranging between 63.76 and 64.30. A breakout from either side would confirm the direction of the next move.
📅 Total2 Analysis
Total2 was rejected from the 1.26 resistance and has now fallen below 1.23. If this downward move continues, the next support levels are at 1.18 and 1.15.
🔑 If price finds support here and moves back up to retest 1.26, a breakout from that level would be a fresh long trigger.
📅 USDT.D Analysis
Tether dominance found support at 4.38 and is now moving upward.
🧩 As long as it remains below 4.51, the overall market momentum is still considered bullish. But if it manages to stabilize above 4.51, the likelihood of a broader market correction increases.
❌ Disclaimer ❌
Trading futures is highly risky and dangerous. If you're not an expert, these triggers may not be suitable for you. You should first learn risk and capital management. You can also use the educational content from this channel.
Finally, these triggers reflect my personal opinions on price action, and the market may move completely against this analysis. So, do your own research before opening any position.
Tradingview

Skeptic |Ethereum (ETH) Analysis: Altcoin Rally Ready to ExplodeHey everyone, Skeptic here! Did you see Bitcoin finally smash through the $107K resistance? Now, with BTC.D dropping, liquidity’s flowing back into altcoins like ETH , which could be gearing up for some wild rallies! 😊 Stick with me for a deep dive into Ethereum’s charts. Let’s start with the Daily Timeframe. 📊
Daily Timeframe: The Big Picture
After breaking the downward curve trendline, ETH has started a sustainable uptrend. Rising volume and Bitcoin’s rally confirm this move, so we can cautiously say the weekly major uptrend is regaining steam. This gets confirmed if we hold above the daily resistance at 2886.63 . Our spot trigger is a consolidation above 2886.63 , backed by increasing volume and momentum, plus a key condition: ETH/BTC needs to be in an uptrend.
Let’s take a quick peek at the ETH/BTC chart.
For a long time, ETH/BTC was in a sharp downtrend on the daily, but recently, it’s kicked off an uptrend momentum. A break above the 0.02588 resistance would confirm ETH/BTC’s uptrend, signaling it’s time to buy spot ETH. Until that break, I don’t recommend jumping in. Always confirm with ETH/BTC—otherwise, Bitcoin is the safer buy since, if ETH/BTC stays bearish, Bitcoin will likely outperform ETH.
4-Hour Timeframe: Long & Short Setups
Let’s zoom into the 4-hour timeframe for long and short triggers. For my long setup, I’ve already opened a position after the break of 2701.33 .
On the 15-minute timeframe, rising volume and RSI hitting overbought during the breakout gave solid confirmation. It looks like it’s pulling back to this level now, but there’s a chance it could be a fakeout. I’m letting it play out—if it hits my stop loss, no big deal; I’ve got risk management in place, and one stop won’t blow up my account :) For a short setup, a break below 2381.51 , coinciding with a break below ETH/BTC support at 0.02289 , could be your short trigger. But I don’t recommend it—the major uptrend is bullish, so shorting means going against the trend, which is risky.
💬 Let’s Talk!
If this analysis sparked some ideas, give it a quick boost—it really helps! 😊 Got a pair or setup you want me to dive into next? Drop it in the comments, and I’ll tackle it. Thanks for joining me—see you in the next one. Let's grow together! 🤍

LUNC Bullish Inverted Head and Shoulders – Testing Neckline Agai🚀 SEED_DONKEYDAN_MARKET_CAP:LUNC Bullish Inverted Head and Shoulders – Testing Neckline Again 📈
SEED_DONKEYDAN_MARKET_CAP:LUNC has formed a bullish inverted head and shoulders pattern and is now testing the neckline in red once again. This could be the final breakout we’ve been waiting for! 🔥

TradeCityPro | Bitcoin Daily Analysis #98👋 Welcome to TradeCity Pro!
Let’s dive into the Bitcoin and major crypto indices analysis. As usual, I’ll walk you through the New York futures session triggers.
⏳ 1-Hour Timeframe
As you can see, the price has finally broken above the 106422 resistance, and after some pullbacks to that level, it continued its bullish move up to 111817. It is now consolidating just below this level.
💥 The RSI oscillator is clearly reflecting price movements. Each time it reaches the Overbought zone, it gets rejected, leading to a price correction. These RSI corrections typically reach the 50 level, which has been acting as a bottom signal.
📈 For today’s long position, if RSI can stabilize above Overbought and a higher low forms above the 50 line, you can enter on a breakout of 111817. This would be a momentum-based trigger.
✨ The reason I’m emphasizing RSI today is that all the primary price-based triggers we’ve talked about—like 106422, 104800, and even levels down near 85000—have already been activated. So, if you’re not already in a position, you’ll need to rely on momentum indicators.
🧩 Another momentum trigger is a pullback to the SMA25 followed by a confirmation candle. However, I still believe breaking above 111817 is the stronger signal.
📊 As for short positions, I think by now it’s clear why I’m not recommending any. My strategy focuses on trading with the trend, and that keeps me from opening unnecessary trades. Like in recent weeks, we’ll wait for a trend reversal before considering shorts.
👑 BTC.D Analysis
Bitcoin dominance has been rising alongside price, hitting the 64.30 resistance. If Bitcoin consolidates or corrects slightly, BTC.D could break below 63.76, signaling a potential altcoin rally.
✔️ The 63.76 level is a key trigger—breaking it confirms continuation of BTC.D’s downtrend. On the flip side, a break above 64.30 would resume BTC.D’s long-term uptrend.
📅 Total2 Analysis
Total2 has resumed its upward move, and after breaking 1.23, it’s heading toward 1.26.
🔼 If BTC.D starts dropping, breaking 1.26 will be a strong long trigger for altcoins.
📅 USDT.D Analysis
Tether dominance has dropped sharply in sync with market gains. After losing the critical 4.51 support, it’s now heading toward 4.37.
⚡️ There’s still some space left before reaching that level. But if 4.37 breaks, it would be another strong long trigger for altcoins.
❌ Disclaimer ❌
Trading futures is highly risky and dangerous. If you're not an expert, these triggers may not be suitable for you. You should first learn risk and capital management. You can also use the educational content from this channel.
Finally, these triggers reflect my personal opinions on price action, and the market may move completely against this analysis. So, do your own research before opening any position.

DOGE Ready for PUMP or what ?I might be wrong , but it might come true From a technical perspective!!!
Give me some energy !!
✨We spend hours finding potential opportunities and writing useful ideas, we would be happy if you support us.
Best regards CobraVanguard.💚
_ _ _ _ __ _ _ _ _ _ _ _ _ _ _ _ _ _ _ _ _ _ _ _ _ _ _ _ _ _ _ _
✅Thank you, and for more ideas, hit ❤️Like❤️ and 🌟Follow🌟!
⚠️Things can change...
The markets are always changing and even with all these signals, the market changes tend to be strong and fast!!

BITCOIN - Time to buy again!Bitcoin will reach $130k with a slight price correction.
previous analysis
Best regards CobraVanguard.💚

BITCOIN - Time to buy again!If the price can break this downward channel, it could reach $100k again. In my opinion, the bearish cycle of the crypto market has ended, and from now on, prices will be bullish.
Give me some energy !!
✨We spend hours finding potential opportunities and writing useful ideas, we would be happy if you support us.
Best regards CobraVanguard.💚
_ _ _ _ __ _ _ _ _ _ _ _ _ _ _ _ _ _ _ _ _ _ _ _ _ _ _ _ _ _ _ _
✅Thank you, and for more ideas, hit ❤️Like❤️ and 🌟Follow🌟!
⚠️Things can change...
The markets are always changing and even with all these signals, the market changes tend to be strong and fast!!

Say hello to the $110k Bitcoin !The BTC will increase $15K and reach to the top of the wedge in the coming weeks .
Give me some energy !!
✨We spend hours finding potential opportunities and writing useful ideas, we would be happy if you support us.
Best regards CobraVanguard.💚
_ _ _ _ __ _ _ _ _ _ _ _ _ _ _ _ _ _ _ _ _ _ _ _ _ _ _ _ _ _ _ _
✅Thank you, and for more ideas, hit ❤️Like❤️ and 🌟Follow🌟!
⚠️Things can change...
The markets are always changing and even with all these signals, the market changes tend to be strong and fast!!

BITCOIN - Time to buy again!Currently, BTC is forming an ascending triangle, indicating a potential price increase. It is anticipated that the price could rise, aligning with the projected price movement (AB=CD).
However, it is crucial to wait for the triangle to break before taking any action.
Stay Awesome , CobraVanguard

TradeCityPro | BCHUSDT Bitcoin Fork Ready to Hit New Highs?👋 Welcome to TradeCityPro Channel!
Let’s dive in and analyze the Bitcoin fork, BCH, to understand why this altcoin is performing much better than the broader market and is being supported at higher levels.
🌐 Overview Bitcoin
Before starting the analysis, I want to remind you again that we moved the Bitcoin analysis section from the analysis section to a separate analysis at your request, so that we can discuss the status of Bitcoin in more detail every day and analyze its charts and dominances together.
This is the general analysis of Bitcoin dominance, which we promised you in the analysis to analyze separately and analyze it for you in longer time frames.
📊 Weekly Time Frame
In the weekly time frame, we see that BCH is in a much better position compared to other altcoins and continues to form higher highs and higher lows!
After hitting the 707 resistance and getting rejected, we’ve been ranging in a large box. However, it’s fair to say that buyers have the upper hand in this box because, after touching the critical 268 support, we engulfed the previous three weekly candles and experienced a sharp move up to 424.
Currently, we’re at a critical point: we could either form a lower high relative to the previous resistance or undergo a mid-term correction and re-enter after breaking 424!
📉 Daily Time Frame
In the daily time frame, the situation is similarly favorable, and BCH is continuing its trend with good momentum. The formation of higher highs and higher lows provides a sense of calm to the uptrend.
After the heavy decline in February, it was natural for us to enter a ranging period before forming a new structure. This happened, and after retesting the 268 support, we started forming higher highs and lows, with our first entry at the 345 level.
Currently, after a rejection from 435, we’ve corrected to 386, which was a low-volume move, technically considered a pullback. If we see a supportive candle at this level, it’s a trigger for a buy, and breaking 435 will be the next trigger!
✍️ Final Thoughts
Stay level headed, trade with precision, and let’s capitalize on the market’s top opportunities!
This is our analysis, not financial advice always do your own research.
What do you think? Share your ideas below and pass this along to friends! ❤️

Gold Futures Analysis: Trade Plan COMEX:GC1!
Gold remains in a strong uptrend on the higher time frames, having recently broken above the $3000 level. This move sets the stage for further upside potential. The chart below highlights a Megaphone chart pattern, signaling volatility and broad price swings.
On the 4-hour chart, a pennant pattern is emerging within the uptrend, marked by a downtrend line from the recent highs. Additionally, an inverse head and shoulders pattern has formed, with a decisive breakout higher towards the 2025 CVAH. This level coincides with a high-volume node (HVN) and the edge of the value area distribution for 2025, suggesting it’s a key point of interest. Some consolidation is expected here before we either continue higher or see a rejection that could pull price back toward the uptrend line.
Scenario 1: Continuation Higher, Capped by 3400 Level
In this scenario, we anticipate further consolidation within the pennant on the 4-hour timeframe. After a brief pause, gold could continue higher, testing the 3400 resistance level. If momentum remains strong, we expect to see price consolidate within the pennant pattern to build energy for the next leg higher.
Scenario 2: Rejection at CVAH
In this scenario, gold struggles to sustain the move higher after breaking out from the inverse head and shoulders pattern. A failure to maintain the rally above the CVAH could lead to a rejection, followed by a retracement within the pennant structure. This would likely set up further consolidation towards the 3200 level before the next move up, possibly testing the uptrend line for support.
Our thoughts:
Gold is currently navigating an important juncture, with key levels at 2025 CVAH, 3400 and 3200 in focus. The near-term direction will depend on how price behaves within the pennant, as well as how it reacts to potential resistance or support levels. Traders should stay alert for volatility, as the consolidation phase could resolve in either a continuation of the uptrend or a pullback towards the trendline. Flight to safety, rising yields and geopolitical tensions will play a key role in shaping sentiment and trend in the Gold market.

USDJPY - New Impulse Soon!Hello TradingView Family / Fellow Traders. This is Richard, also known as theSignalyst.
📈USDJPY has been overall bullish trading within the rising broadening wedge pattern marked in blue and it is currently hovering around the lower bound of it.
Moreover, the orange zone is a strong structure and support.
🏹 Thus, the highlighted blue circle is a strong area to look for buy setups as it is the intersection of structure and lower blue trendline acting as a non-horizontal support.
📚 As per my trading style:
As #USDJPY is around the blue circle zone, I will be looking for bullish reversal setups (like a double bottom pattern, trendline break , and so on...)
📈The bullish impulse will begin after a break above the last minor high and upper red trendline.
📚 Always follow your trading plan regarding entry, risk management, and trade management.
Good luck!
All Strategies Are Good; If Managed Properly!
~Rich
Disclosure: I am part of Trade Nation's Influencer program and receive a monthly fee for using their TradingView charts in my analysis.

TradeCityPro | Bitcoin Daily Analysis #97👋 Welcome to TradeCity Pro!
Let’s go over the Bitcoin analysis and key crypto indices. As usual, I’ll be reviewing the triggers for the New York futures session.
⏳ 1-Hour Timeframe
As you can see, a Double Bottom pattern activated yesterday, and the price has returned to the 106422 zone.
✔️ We previously had a support at 102882, but since the price wasn’t respecting it consistently, I’ve removed it. If price shows solid support there again, I’ll reintroduce the level.
🔍 Currently, the first trigger for a long position is 106422. This is a highly critical level and represents the main resistance for Bitcoin. If it breaks, there’s a strong chance for a sharp upward move.
✨ The first support in the way is 104800, which isn’t very strong. If a correction occurs, this level is likely to break. The main support remains at 101628.
📈 A break below 101628 would confirm a bearish reversal, and we could even consider opening a short position. The next support below that would be at 99225.
📊 Market volume has significantly increased over the past few days. This spike in volume suggests that a sharp move is likely. Using our trigger levels, we’ll be able to determine whether it’s an upward or downward breakout.
👑 BTC.D Analysis
Bitcoin dominance is still below the 64.04 zone and appears to be consolidating.
💥 The 64.04 level is highly sensitive. A breakout would signal a bullish shift in dominance, while a rejection would suggest the downtrend will resume.
⚡️ We’ll get confirmation of further downside if 63.71 breaks. Below that, the next support levels are at 63.30 and 62.65.
📅 Total2 Analysis
Yesterday, Total2 reacted to the 1.16 support and moved upward to 1.20.
💫 A break above 1.20 today would confirm bullish continuation. A drop below 1.16, however, would confirm the continuation of a broader correction.
📅 USDT.D Analysis
Yesterday, the 4.70 level was faked out, and the chart fell back into the range box.
🎲 I believe the chances of breaking below the range bottom have increased. Key bearish triggers are at 4.57 and 4.51. On the flip side, another break above 4.70 would confirm renewed bullish momentum for USDT dominance.
❌ Disclaimer ❌
Trading futures is highly risky and dangerous. If you're not an expert, these triggers may not be suitable for you. You should first learn risk and capital management. You can also use the educational content from this channel.
Finally, these triggers reflect my personal opinions on price action, and the market may move completely against this analysis. So, do your own research before opening any position.
TradeCityPro | S: Trendline Break Signals Key Support Retest👋 Welcome to TradeCity Pro!
In this analysis, I’m going to review the S coin—one of the Layer 1 coins for the Sonic network.
💥 This coin currently holds a market cap of $1.43 billion and ranks 58th on CoinMarketCap.
⏳ 1-Hour Timeframe
On the 4-hour chart, as you can see, there’s a large range box between the 0.3939 and 0.6147 levels where price has been moving sideways.
🔍 A key support zone also exists between 0.45 and 0.46, which has received strong bullish reactions, pushing the price upward toward the 0.6147 top via a trendline.
✔️ Currently, this trendline has been broken, and a new support level has formed at 0.4888, which has been tested several times.
✨ If this 0.4888 level breaks, a short position targeting the 0.45 zone and 0.3939 becomes viable.
📈 For a long position, the first trigger is the 0.5266 level. A breakout here would confirm support at 0.4888 and open the path toward the 0.6147 resistance.
🎲 The RSI oscillator is hovering near the 50 level. A sustained move above this could increase the likelihood of the bullish scenario playing out.
📝 Final Thoughts
This analysis reflects our opinions and is not financial advice.
Share your thoughts in the comments, and don’t forget to share this analysis with your friends! ❤️

Gold (XAU/USD) Analysis: Short Setups Shine in a Tight Market! Hey everyone, Skeptic here! After checking out the market today, I’m zeroing in on XAU/USD (Gold) for some prime short opportunities. 😊 Let’s dive into the charts and unpack why this could be a sweet setup. We’ll start with the Daily Timeframe to get the big picture. 📊
Daily Timeframe: The Big Picture
Gold’s been riding a strong major uptrend, but we’re now in a corrective phase. Here’s what’s going on:
Trend Context: We’ve had a robust bullish trend, with weak corrections and sharp, high-momentum rallies.
Double Top Formation: A double top formed, and after breaking its neckline, we’ve entered a secondary corrective trend.
Key Levels:
Bullish Continuation: A break above the ceiling at 3416.19 confirms the major uptrend’s continuation.
Deeper Correction: A break below support at 3126.75 could push us down to 3019.98.
Recent Candles: They’re getting smaller and tighter, signaling market indecision. The next few days could define Gold’s direction—up or down.
This compression means we need to be ready for a breakout in either direction. Let’s zoom into the 4-Hour Timeframe to find our long and short triggers and understand why this tightness matters.
4-Hour Timeframe: Long & Short Setups
After the first corrective wave hit the 3126.75 support, we’ve entered a continuation triangle pattern. Here’s the plan:
Short Setup:
Trigger: A break below the triangle’s floor at 3206.32 is a solid short opportunity.
Why It Works: This is a continuation pattern, so no extra confirmation is needed—price action leads the way.
Outlook: Red candles have shown more strength than green ones, and the pattern supports bearish momentum from the prior wave, making a downward break more likely.
Long Setup:
Trigger: Wait for a break above the resistance at 3249.68 .
Confirmation: Look for support from RSI or SMA to boost confidence.
Risk Management: Keep position risk low, as the bearish momentum is stronger right now.
My Take: I’m leaning toward a bearish move due to stronger red candles and the pattern’s bearish bias. For shorts, use reasonable risk, but for longs, tighten your risk to stay safe. 😎
💬 Let’s Talk!
If this analysis sparked some ideas, give it a quick boost—it really helps! 😊 Got a pair or setup you want me to dive into next? Drop it in the comments, and I’ll tackle it. Thanks for joining me—see you in the next one. Keep trading smart! ✌️

GOLD - at CUT n REVERSE area ? What's next??#GOLD... perfect move below our upside breakout level.
Now market have single key level that is around 3212-13
Keep close that area and keep in mind that is game changer area
Don't be lazy and don't float your buying below 3212-13
Good luck
Trade wisely

TradeCityPro | INJUSDT Best Position Among Altcoins! 👋 Welcome to TradeCityPro Channel!
Let’s dive in and analyze one of my favorite coins in the cryptocurrency space, INJ, which is showing strong potential. We’ll check the new entry triggers together.
🌐 Overview Bitcoin
Before starting the analysis, I want to remind you again that we moved the Bitcoin analysis section from the analysis section to a separate analysis at your request, so that we can discuss the status of Bitcoin in more detail every day and analyze its charts and dominances together.
This is the general analysis of Bitcoin dominance, which we promised you in the analysis to analyze separately and analyze it for you in longer time frames.
📊 Weekly Time Frame
On the weekly time frame, I see that the seventh period is stable, INJ, and compared to the majority of altcoins that have their own low price levels, it is in a better space and is engaged in its own supports!
After breaking the primary trend ceiling, namely 9.28, we experienced a sharp upward movement and formed a historical ceiling at $53, and after forming a distribution box and breaking the important floor of 16.20 and pulling back to it, we experienced a continued decline.
Currently, we’ve bounced from the key support at 6.54 and experienced a 90% move, which highlights the importance of this resistance. If we form a higher low above 6.54, the 13.54 trigger will be excellent for a spot buy, and I’ll personally add another buy position at that level.
📉 Daily Time Frame
On the daily time frame, our trend is completely bearish as you can see, and the events are completely accompanied by the formation of a downward bottom and top, but we are likely to suffer for a while.
After getting rejected from 34.16 and forming a box between 20.16 and 25.93 and losing the bottom, it made a move and then while pulling back with low volume and the next conversion to red, it became an inverted Sharpe, we experienced a decline!
After breaking the daily trendline and activating its trigger at 8.54, we saw a move and got stuck at the 10.32 resistance. After forming a higher low, we moved up to 13.76. Currently, the 13.76 trigger, and even better, 16.25, can serve as our futures long and spot long triggers, respectively. We’re still holding the position opened at 10.32.
✍️ Final Thoughts
Stay level headed, trade with precision, and let’s capitalize on the market’s top opportunities!
This is our analysis, not financial advice always do your own research.
What do you think? Share your ideas below and pass this along to friends! ❤️

Be careful with EOS !!!The EOS will increase 30 cents and reach to the top of the wedge in the coming weeks .
Give me some energy !!
✨We spend hours finding potential opportunities and writing useful ideas, we would be happy if you support us.
Best regards CobraVanguard.💚

Yearly Open in Play — Is This the Real Bull or Just a Bounce?CME_MINI:ES1!
Macro Recap
Late Friday, Moody’s lowered the US’s sovereign rating from AAA to Aa1. This reflects a unanimous downgrade of the US, joining S&P and Fitch in stripping the US of its AAA status.
Would this result in a sell-off?
In our analysis, and consensus from the Street, is that it will be contained since the downgrade puts Moody’s in the same camp as S&P and Fitch.
There are talks of renegotiating UK–EU trade deals, which has boosted cable.
On the geopolitical side, not much has changed. Ceasefire talks are ongoing but stuck in neutral. No new catalysts—yet.
The spotlight, however, is firmly on the Fed. Over the weekend, President Trump called on Chair Powell to cut rates “before it’s too late,” echoing a post from April 17th where he labeled Powell’s speech “a complete mess” and added, “Powell’s termination cannot come fast enough.”
With a packed schedule of Fed speakers this week, the real question is whether they’ll double down on the Fed’s independence—or bend toward political gravity, especially with Trump reportedly eyeing the top job.
Economic data is light. That puts full attention on the Fed and headline risk. Traders should stay nimble and alert. Momentum could shift fast.
Markets are now pricing in two cuts of 25 bps each for September and December 2025.
This is very different from market pricing one month ago, when reciprocal tariffs were announced.
Monitoring rate cut expectations is another key theme this week, with multiple Fed speakers scheduled.
ES Futures
ES Futures have been one-time framing up — i.e., creating higher lows — on the weekly timeframe.
ES Futures have also created higher highs.
Key Levels:
• March 2025 High: 6052.50
• 2025 Yearly Open: 6001.25
• Previous Week High: 5977.50
• Previous Week Mid: 5856
Bull Market—or Just a Bear Bounce?
That’s the question traders are asking.
From our perspective, this looks like a recovery from a trade policy shock. The market took the hit, recalibrated, and bounced back.
But let’s not get ahead of ourselves. After a move this strong, some pause is natural. We’re watching for potential consolidation or profit-taking, especially with price action still holding below the yearly open.
Caution is warranted here—momentum’s in play, but the structure hasn’t fully confirmed the shift.
Scenario 1: Another Up Week, Capped by Yearly Open
In this scenario, the rally will be contained as the yearly open remains a strong pivot and resistance zone.
The LIS (Line in the Sand) for short trade opportunities is the yearly open pivot.
Scenario 2: Range-Bound Week
In this scenario, we expect markets to consolidate, remaining above last week’s low and finding support at the prior week’s mid-range.
We will look to initiate longs from the previous week’s mid-range, looking for level-to-level scalping opportunities in a range-bound market.

TradeCityPro | Bitcoin Daily Analysis #96👋 Welcome to TradeCity Pro!
Let’s move on to the Bitcoin and major crypto index analysis. As usual, I’m going to review the triggers for the New York futures session.
⏳ 1-Hour Timeframe
As you can see on the 1-hour chart, yesterday we had a bullish move that extended up to the 106247 level.
🔍 However, as I previously mentioned, this is a very sensitive zone for price action, and we might see sharp reactions from it. That’s exactly what happened—price faced a strong rejection after reaching this level and dropped down to 102882.
📊 Market volatility is currently very high, and the risk of getting stopped out in either direction is significant. So we need to be cautious and avoid getting caught in fake moves.
💥 Personally, I recommend avoiding trades right after such volatility and waiting for a new structure to form. But if you’re planning to take a position, keep the risk very low.
⚡️ For a short position, our first trigger is a break below 101628. Alternatively, we could also enter based on how the price reacts to 102882.
📈 For a long position, we currently have no clear setup until price structure forms. The only long triggers I can give for now are the breakouts of 104800 and 106247.
👑 BTC.D Analysis
Bitcoin dominance has started a new uptrend and has even closed above 63.71. Given the healthy structure of this trend, if 64.04 breaks, we can confirm a full bullish breakout for BTC.D.
💫 If BTC dominance continues rising while the market moves up, Bitcoin will likely outperform most altcoins.
📅 Total2 Analysis
Looking at Total2, the 1.17 support broke yesterday, and now this index is set up for further downside correction. For now, it seems the market is in a decision-making phase.
🧲 If we get a lower low and lower high below 1.17, the chance of a move toward 1.1 increases significantly.
📅 USDT.D Analysis
Now for USDT dominance—yesterday it faked out the 4.60 level twice and is currently holding above 4.70, heading toward 4.82.
🧩 If this move turns out to be a fake and price stabilizes below 4.70 again, it would give us a strong signal for a bullish market and a bearish turn for USDT dominance.
❌ Disclaimer ❌
Trading futures is highly risky and dangerous. If you're not an expert, these triggers may not be suitable for you. You should first learn risk and capital management. You can also use the educational content from this channel.
Finally, these triggers reflect my personal opinions on price action, and the market may move completely against this analysis. So, do your own research before opening any position.

GOLD - Near CUT N REVERSE area? What's next??#GOLD.. market perfectly bounced back from a noisy region around 3120
Now market just near to his current major area that is 3251-52
Keep close that area , market holds multiple times in history.
Note: that is our cut n reverse area and we will go for cut n reverse above that on confirmation.
Good luck
Trade wisely

GOLD - bottom out here? What's next??#GOLD.. .market placed a very reasonable low for now and now if market holds 3175 in hour chart then we can expect a bounce from here.
Note: we will go for cut n reverse below 3173 - 74
Good luck
Trade wisely

ETH's situation+ Target PredictionThe COINBASE:ETHUSD is in a Bullish phase by a Falling Wedge Pattern.
A falling wedge indicates the potential for price to reach to $2750.
Note if the Wedge Pattern is broken downwards with the strength of Bearish candles , this analysis of ours will be failed.
Give me some energy !!
✨We spend hours finding potential opportunities and writing useful ideas, we would be happy if you support us.
Best regards CobraVanguard.💚
_ _ _ _ __ _ _ _ _ _ _ _ _ _ _ _ _ _ _ _ _ _ _ _ _ _ _ _ _ _ _ _
✅Thank you, and for more ideas, hit ❤️Like❤️ and 🌟Follow🌟!
⚠️Things can change...
The markets are always changing and even with all these signals, the market changes tend to be strong and fast!!
