The TradingView Show with TradeStation: Bull Market or Fake Out?Join us for a timely TradingView live stream with David Russell, Head of Global Market Strategy at TradeStation, as we break down the latest rebound in the markets and what it could mean for traders and investors. In this session, we’ll dive into:
What the recent bounce off the lows might signal about a potential bull market return
How global trade dynamics and tariff news are shaping asset prices
Key charts, indicators, and technical patterns to watch for signs of sustained momentum
Essential strategies for navigating market recoveries, corrections, and upcoming Federal Reserve decisions
Bonus: Discover our latest broker integration update with TradeStation—now supporting equity options trading directly on TradingView. This upgrade brings advanced tools like the strategy builder, options chain sheet, and volatility analysis to your fingertips, making it easier to trade through uncertain market conditions.
This session is sponsored by TradeStation, whose vision is to provide the ultimate online trading platform for self-directed traders and investors across equities, equity index options, futures, and futures options markets. Equities, equity options, and commodity futures services are offered by TradeStation Securities Inc., member NYSE, FINRA, CME, and SIPC.
Disclosures from TradeStation:
www.tradestation.com
www.tradestation.com
Tradingview

SPY WEEKLY 19TH-23RD MAY 2025Welcome to Spy weekly. I have tried to explain the price action & all-important levels in the best possible way but still if you have doubts then feel free to leave a comment below.
NOTE: WE ARE IN BULL RUN

TradeCityPro | Deep Search: In-Depth Of ATOM👋 Welcome to TradeCity Pro!
Today we have a deep research analysis of the ATOM project, and in this report, I’m going to review the project completely. Let’s first go over the project’s fundamentals and then analyze the ATOM chart technically.
🌌 What Is Cosmos?
Cosmos is a blockchain ecosystem designed to solve major challenges in the blockchain industry, such as low speed, high cost, lack of scalability, and the environmental impact of proof-of-work algorithms like Bitcoin. Cosmos enables cross-chain interaction (interoperability) by connecting independent blockchains through a protocol called Inter-Blockchain Communication (IBC).
Cosmos aims to simplify the development of blockchains and decentralized applications (dApps) using a modular framework known as Cosmos SDK, which makes it easier for developers to build blockchain networks.
🛠 How Does Cosmos Work?
The Cosmos network is composed of three main layers:
Application Layer: Handles transaction processing and updates the network state
Networking Layer: Manages communication between blockchains and their transactions
Consensus Layer: Establishes the final state of the blockchain using a consensus algorithm
At the core of this structure is the Tendermint BFT engine, which enables developers to build custom proof-of-stake (PoS) blockchains without coding from scratch.
🔗 Cosmos Hub and Zones
Cosmos Hub was the first blockchain created within the Cosmos network and serves as a central hub for other blockchains—called zones.
These zones are independent blockchains that can interact through Cosmos Hub.
Validators on Cosmos Hub are responsible for maintaining consensus across all zones and are compensated with transaction fees.
The native token of the network, ATOM, is used for transaction fees, governance participation, and staking.
🎯 Key Features of Cosmos
Interoperability: IBC allows blockchains to interact directly
High Scalability: Blockchains run in parallel without overloading a single chain
Ease of Blockchain Development: Cosmos SDK lets developers build customized networks
Decentralized Governance: Users participate in governance by staking ATOM
💡 Interchain Accounts Upgrade
In February 2022, the Interchain Foundation introduced the Interchain Accounts upgrade, allowing blockchains to control accounts on other chains. This enables remote actions like staking, voting, token swapping, and more—without needing full network upgrades.
This significantly enhances interoperability and composability within the IBC ecosystem.
👥 Founders of Cosmos
Jae Kwon
Zarko Milosevic
Ethan Buchman
Cosmos was initially developed by Tendermint Inc. In 2020, Jae Kwon stepped down as CEO and was replaced by Peng Zhong.
🔐 Network Security
Cosmos uses a proof-of-stake consensus algorithm with Byzantine Fault Tolerance (Tendermint BFT):
Validators are selected based on staked ATOM
Malicious behavior results in slashing (loss of tokens)
Rewards are distributed proportionally among validators and their delegators
📍 Where Can You Buy ATOM?
ATOM is available on most major exchanges, including:
Binance
Coinbase
OKX
Kraken
📈 ATOM Token Information
📊 Initial Token Distribution
In 2017, Cosmos raised approximately $16 million through public and private sales. The initial token distribution was as follows:
Public Fundraise:
Share: 44.1%
Unlocked: 35.6%
Block Rewards:
Share: 39.5%
Unlocked: 31.7%
Strategic Investors:
Share: 7.03%
Unlocked: Unknown (likely still locked)
All in Bits, Inc. (Tendermint):
Share: 6.53%
Unlocked: 5.26%
Interchain Foundation:
Share: 6.51%
Unlocked: 5.26%
Seed Investors:
Share: 3.31%
Unlocked: 2.67%
💰 Supply and Inflation
Initial supply: 236,198,958 ATOM
Current supply: ~292 million ATOM
Maximum supply: Unlimited
Inflation rate: Between 7% and 20%, targeting ~2/3 of total supply to be staked
The inflation rate is dynamically adjusted to incentivize staking. If the staking ratio drops below the target, inflation increases, and vice versa.
🔐 Staking and Rewards
Unbonding period: 21 days
Annual reward rate (APR): Between 14% and 20%, depending on network conditions and staking service provider
By staking ATOM, users help secure the network and earn rewards funded through inflation and transaction fees.
🧾 Economic Mechanisms
Burning: If a governance proposal is vetoed, the deposited tokens are burned
Slashing: Validators engaging in malicious or negligent behavior lose part of their staked tokens
🧠 ATOM Tokenomics Models: 1.0 vs 2.0
Recent analysis reveals different impacts of tokenomics models on network sustainability:
ATOM 1.0 with a 10% inflation cap has shown a 10% improvement in token price and treasury health
ATOM 2.0 suffers from stability issues and is often replaced by ATOM 1.0 to maintain network security
Community Treasury in ATOM 1.0: May face depletion within ~24 months due to limited token supply
🔚 Conclusion
Cosmos represents a significant advancement in blockchain infrastructure by addressing some of the core limitations of earlier networks—most notably, interoperability, scalability, and developer accessibility. Through its modular architecture, innovative Tendermint consensus engine, and the IBC protocol, Cosmos has laid the foundation for a truly interconnected web of blockchains.
The network’s native token, ATOM, not only fuels this ecosystem through staking and governance but also underpins its dynamic economic model. While challenges remain—especially around inflation control and treasury sustainability—Cosmos continues to evolve as a leading force in the multichain future of decentralized technologies.
Now that we’ve reviewed the project, let’s move on to the chart for a technical analysis.
📅 Weekly Timeframe
In the weekly timeframe, as you can see, the price has formed a support bottom at the 3.812 level and has tested it multiple times.
✨ This support is very important because if it’s lost, the price could move down toward the 1.863 bottom.
💥 On the other hand, if the price is supported at this level, a bullish cycle could begin. The resistance levels ahead are 6.602 and 10.135.
🔍 The 6.602 zone isn’t very strong, and if the price gets rejected there, it signals that sellers are much stronger than buyers.
✔️ But if the price breaks through this level and moves upward, the 10.135 zone becomes very significant, because if that level is broken, a Double Bottom pattern will be activated and we can get confirmation of a trend reversal.
💫 If this pattern is confirmed, the first target will be 15.704.
📊 Right now, it’s better to pay attention to oscillators like volume and RSI. Volume is currently decreasing, and we need to wait for volume confirmation alongside price movement. If the price starts to move with volume convergence, the likelihood of continuation increases.
🔔 The RSI oscillator also has a small bullish divergence with price. The reason it’s considered small is that the price made an equal low while the RSI made a higher low. If RSI makes a new higher low again, we may start to see the effect of the divergence in the chart.
🎲 A breakout above the 50 level on RSI could also be a confirmation of bullish momentum.
📅 Daily Timeframe
In the daily timeframe, we can see more details of the price action.
🧩 As observed, the price has formed a range box between 3.989 and 5.380, and within this range, RSI has shown a strong divergence.
📈 I think if RSI doesn’t stabilize below the 50 level, and if the price sets a new higher low above 4.588, the chance of breaking the 5.380 resistance on the next test will be much higher.
🔑 If 5.380 is broken, the price could rally to 7.514. The next target after that would be 10.135, a level I also emphasized in the weekly timeframe.
🔽 For a bearish scenario and short positions, the first trigger is a break below 4.588, which can act as a lead-in to a possible break of 3.989. The main short trigger will be the confirmed break of 3.989.
❌ Disclaimer ❌
Trading futures is highly risky and dangerous. If you're not an expert, these triggers may not be suitable for you. You should first learn risk and capital management. You can also use the educational content from this channel.
Finally, these triggers reflect my personal opinions on price action, and the market may move completely against this analysis. So, do your own research before opening any position.

TradeCityPro | Bitcoin Daily Analysis #95👋 Welcome to TradeCity Pro!
Let’s dive into the Bitcoin analysis and key crypto market indicators. As usual, I’ll break down the triggers for the New York futures session.
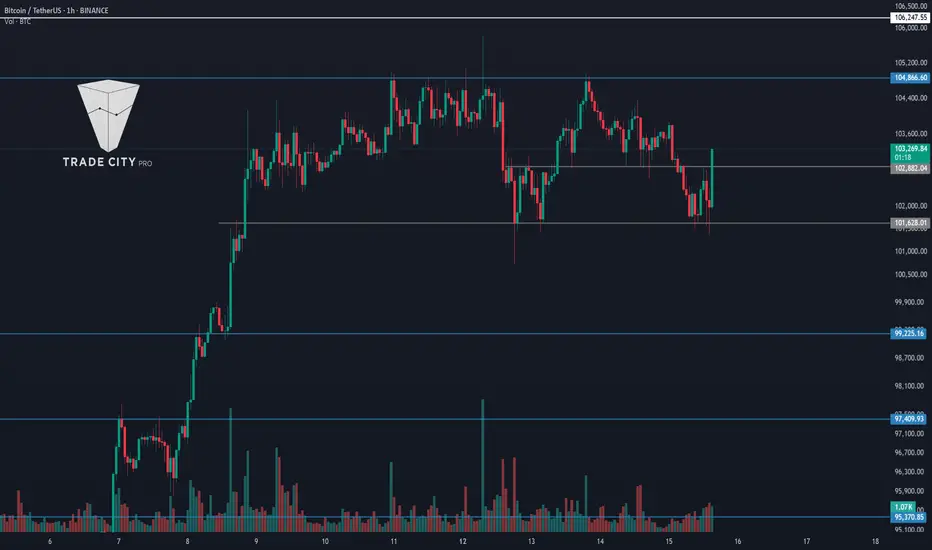
⏳ 1-Hour Timeframe
As you can see on the 1-hour chart, yesterday the price bounced from the 102882 level and is now moving toward 104204.
🔍 I mentioned yesterday that if the price prints a higher low above 101628, we could open a position on a breakout of 104204. That scenario played out, and now that the price has risen from 102882, we’re approaching 104204. So, a breakout above 104204 is a long trigger.
📈 The next long trigger is at 104800, and breaking that level could push the price toward the main resistance at 106247.
💥 For a short position and bearish confirmation, ideally, we’d want to see a lower high below 104204. If that happens, a break below 102882 becomes a valid short trigger.
🔽 The main short trigger and confirmation of a bearish reversal would come with a break of 101628.
📊 Keep an eye on volume—if volume increases as the price approaches any of these levels, the chances of a breakout increase significantly.
👑 BTC.D Analysis
Bitcoin Dominance moved slightly higher yesterday but got rejected from 63.71 and failed to reach 63.95.
✨ Currently, BTC.D is heading toward 63.30. If this level breaks, it could trigger a new bearish leg down toward 62.65 and 62.07.
📅 Total2 Analysis
Looking at Total2, this index couldn’t hold below 1.17 yesterday and bounced, currently reaching 1.19.
✔️ If the price holds above 1.19, that would be the first confirmation of bullish momentum. However, this move might also just be a pullback to 1.19—so if price gets rejected here, a break of 1.17 becomes the next short entry.
📅 USDT.D Analysis
Tether Dominance was rejected from 4.70 and may be heading back toward the 4.51 support.
🧩 A break below 4.60 could give us an early bearish signal. The main short trigger remains the 4.51 level.
❌ Disclaimer ❌
Trading futures is highly risky and dangerous. If you're not an expert, these triggers may not be suitable for you. You should first learn risk and capital management. You can also use the educational content from this channel.
Finally, these triggers reflect my personal opinions on price action, and the market may move completely against this analysis. So, do your own research before opening any position.

"DOGE - Time to buy again!" (Update)So if you pay attention to the doge chart you can see that the price has formed a Ascending FLAG or wedge which means it is expected to price move as equal as the measured price movement.( AB=CD )
NOTE: wait for break of the FLAG .
Give me some energy !!
✨We spend hours finding potential opportunities and writing useful ideas, we would be happy if you support us.
Best regards CobraVanguard.💚
_ _ _ _ __ _ _ _ _ _ _ _ _ _ _ _ _ _ _ _ _ _ _ _ _ _ _ _ _ _ _ _
✅Thank you, and for more ideas, hit ❤️Like❤️ and 🌟Follow🌟!
⚠️Things can change...
The markets are always changing and even with all these signals, the market changes tend to be strong and fast!!

DOGE Ready for PUMP or what ?What I see now is that the price could correct to the PRZ and then pump again, and currently, there is no specific bullish pattern in the chart. which could cause the price to drop below 20 cents.

TradeCityPro | Bitcoin Daily Analysis #94👋 Welcome to TradeCity Pro!
Let’s go over the Bitcoin analysis and major crypto indexes. As usual, I’ll cover the New York futures session triggers for you.
⏳ 1-Hour Timeframe
As you can see, yesterday the price was rejected from the 104204 level and formed a lower high compared to 104800. Currently, there's a strong chance the short trigger will activate, so let’s review those triggers.
🔽 For a short position, the area where the price is currently consolidating—102882—is a suitable trigger. If this level breaks, the price could drop to 101628.
📊 One note about this trigger: the zone between 102882 and 101628 is a major support range. Every time the price has entered it, it’s formed long wicks and exited with strong bullish candles.
✨ So, if we enter a position based on this trigger, the volatility of the candles increases the chance of getting stopped out. On the other hand, using a large stop loss isn’t ideal either, since these trades go against the main trend and work better with a tight stop to hit the target faster.
💥 The next trigger is the break of 101628, which seems more reasonable. Breaking this level confirms a deeper correction and opens the path toward levels like 99225.
✔️ For a long position, if the price prints a higher low above 101628, we can confirm a bullish bias with the break of 104204. A higher low indicates strong bullish momentum, allowing us to use a slightly riskier trigger.
⚡️ However, if the price falls to the bottom of the box and then returns to the top, the main long trigger becomes a breakout above 104800.
🔍 Today, most of the market volume is on the sell side, and red candles are getting solid volume, so a correction to the box bottom seems likely. Either way, we have to wait for the triggers to activate.
👑 BTC.D Analysis
Bitcoin Dominance continues its bullish move after breaking the descending trendline. Yesterday, it printed a higher low and broke 63.30, reaching 63.61, and is now consolidating below that level.
🔔 If this level is broken too, we’ll have the first confirmation of a trend reversal in dominance. Full confirmation will come after BTC.D holds above 63.95.
📅 Total2 Analysis
Let’s move to Total2. Yesterday, the 1.19 trigger activated, and the price dropped to 1.17. The reaction to 1.18 wasn’t strong or clean, so I’ve adjusted the support level to 1.17.
📉 Today, we can open a short position if 1.17 is broken. For a long, if the price moves above 1.19, we can go long on altcoins that trigger accordingly.
📅 USDT.D Analysis
Now looking at Tether Dominance. Yesterday, it reacted to 4.70 and is now forming a higher low, heading back toward that level.
☘️ I see strong bullish momentum on the chart, and I believe the probability of breaking 4.70 is high. If it breaks, USDT.D could move up to 4.82.
❌ Disclaimer ❌
Trading futures is highly risky and dangerous. If you're not an expert, these triggers may not be suitable for you. You should first learn risk and capital management. You can also use the educational content from this channel.
Finally, these triggers reflect my personal opinions on price action, and the market may move completely against this analysis. So, do your own research before opening any position.

TradeCityPro | SOL: Key Retest at Support Before Next Breakout👋 Welcome to TradeCity Pro!
In this analysis, I’m going to review the SOL coin—one of the most requested assets and a very popular project in the crypto space.
✔️ This coin holds a market cap of $3.61 billion and is ranked 6th on CoinMarketCap.
⏳ 4-Hour Timeframe
As you can see, a bullish leg started from the 142.25 support and extended up to the 177.51 resistance.
🔍 Currently, after a fake breakout of 177.51 and a rejection from 183.86, the price has dropped back below 177.51 and formed a support level around 166.82.
📈 So far, the price has tested the 166.82 level twice and shown a strong bullish reaction. Recently, a powerful support candle has formed at this level, suggesting it’s being defended.
💥 If the price can move back toward the upper levels, a breakout of either 177.51 or 183.86 would provide a long entry trigger. If a higher low and higher high form before the breakout of 177.51, the trigger becomes even more reliable.
📊 Market volume has declined since the upward move ended. If volume increases as price rises again, it would provide a volume confirmation.
🔽 For a short position, the 166.82 level serves as a valid trigger. In my view, it’s a strong enough level to justify opening a short. The next major support below lies at 142.25.
❌ Disclaimer ❌
Trading futures is highly risky and dangerous. If you're not an expert, these triggers may not be suitable for you. You should first learn risk and capital management. You can also use the educational content from this channel.
Finally, these triggers reflect my personal opinions on price action, and the market may move completely against this analysis. So, do your own research before opening any position.

"ADA - Time to buy again!" (Update)So if you pay attention to the ADA chart you can see that the price has formed a Ascending FLAG or wedge which means it is expected to price move as equal as the measured price movement.( AB=CD )
NOTE: wait for break of the FLAG .
Give me some energy !!
✨We spend hours finding potential opportunities and writing useful ideas, we would be happy if you support us.
Best regards CobraVanguard.💚
_ _ _ _ __ _ _ _ _ _ _ _ _ _ _ _ _ _ _ _ _ _ _ _ _ _ _ _ _ _ _ _
✅Thank you, and for more ideas, hit ❤️Like❤️ and 🌟Follow🌟!
⚠️Things can change...
The markets are always changing and even with all these signals, the market changes tend to be strong and fast!!

Skeptic | Solana’s Uptrend Ignites: Big Moves Ahead?Hey everyone, Skeptic here! Let’s kick off this Friday morning with a deep dive into Solana , one of my favorite coins! 😊 In this analysis, I’m breaking down the charts, spotting spot and futures triggers, and exploring what’s next for SOL. Stick with me to the end, and we’ll grow together! <3 Let’s start with the Daily Timeframe. 📊
Daily Timeframe: The Big Picture
We’re riding a solid upward channel on Solana’s daily chart. The price has reacted beautifully to the ceiling, floor, and especially the midline, which gives this channel a ton of credibility—we can trust it. After a strong price surge starting October 20 and running through January 25 , we entered a price correction. I expected a pullback to 80.78 , but we corrected to 95.15 instead. Now, we’ve formed a head and shoulders pattern, and the neckline has broken, activating the pattern. This pattern, at the end of a correction, signals a trend reversal and a continuation of the major uptrend. The target for this pattern is the height from the head to the neckline, which takes us to 202.82 —coincidentally, a key resistance level ahead. I expect we might range around that level or, if we break it, it’ll likely be a sharp and messy move. So, plan ahead to avoid FOMO or making rash moves. Our spot entry was at 151.78 , but a break above 202.82 could be another solid trigger, with a stop loss below the support at 147.97 . Don’t FOMO —wait for confirmations from SOL/BTC and Bitcoin’s action. Volume is your friend for spotting momentum, so keep a close eye on it. Let’s zoom into the 4-Hour Timeframe for long and short triggers.
4-Hour Timeframe: Long & Short Setups
After breaking the 153.29 resistance, we saw a nice rally, but then we hit some turbulence. If you look closely, the market seems to have formed a symmetrical triangle—the worst pattern for breakout and momentum-based strategies. Why? The market doesn’t care about support or resistance here, making it tough to tell if moves are fake or real. So, what’s the plan?
Let’s drop to the 1-Hour Timeframe.
The last level we got rejected from was 174.51 . If we revisit this level with rising volume and candles showing buyer strength—think good lower shadows and strong green bodies with high closes—it means sellers pushed the price down, but buyers stepped in and drove it back up. If you see this setup and we break the 174.51 resistance, you can open a long position. For shorts, since the major and secondary trends are uptrends, I’m not giving any short triggers—it’s completely against the trend, and the risk of hitting a stop loss is way too high. Be patient. Wait for this uptrend to fake out and drop below 149.07 —then we’ll hunt for shorts. 🙂 Let’s also take a quick look at SOL/BTC.
SOL/BTC Analysis
On the daily timeframe, we’ve got a clean head and shoulders pattern for SOL/BTC, with the neckline broken and a pullback to it now. This could lead to a strong rally moving forward, provided it’s not a fakeout and we don’t fall back below the support at 0.0015043. What does this mean? If the market stays in an uptrend, Solana could outperform Bitcoin. And if BTC.D is dropping during a market rally, Solana could see some serious growth. That’s the Solana breakdown! If you’ve got your own technical or fundamental analysis on this coin, I’d love to hear it—drop it in the comments so we can grow together! 😄
💬 Let’s Talk!
If this analysis helped you out, give it a quick boost —it means a lot! 😊 Got a pair or setup you want me to tackle next? Drop it in the comments, and I’ll get to it. Thanks for hanging out, and I’ll see you in the next one. Keep trading smart! ✌️

TradeCityPro | Bitcoin Daily Analysis #93👋 Welcome to TradeCity Pro!
Let’s dive into the analysis of Bitcoin and key crypto indices. As usual, in this analysis, I’ll go over the triggers for the New York futures session.
⏳ 1-Hour Timeframe
Yesterday I mentioned the 102882 trigger for opening a position. The price made a bullish leg upward but failed to reach the 104866 resistance and is now moving back down.
🔍 If a lower high is formed compared to 104866 and the price approaches the 101628 support, we can open a position upon a breakdown of that level.
✨ The RSI oscillator is moving below the 50 zone, and with the selling volume coming into the market, the likelihood of forming a lower high than 104866 increases.
💥 Confirmation for a short position on the 101628 break could come from RSI entering the Oversold zone. Volume must also rise significantly, as the overall trend is still bullish, making short positions very risky. If you open one, make sure to secure profits quickly.
📈 For a long position, our trigger is still the 104866 breakout—no major change from previous days. The main resistance remains at 106247.
👑 BTC.D Analysis
Bitcoin dominance continued its upward movement to 63.30 yesterday and is now moving downward again. A breakdown of 62.65 would confirm the continuation of the downtrend in dominance.
🔼 For BTC.D to turn bullish again, it needs to break above 63.30 and could start another bullish leg if that happens.
📅 Total2 Analysis
This index didn’t move much higher yesterday due to the rise in Bitcoin dominance. It failed to reach its previous highs and is now near the 1.19 support.
📊 We can define a key support zone between 1.18 and 1.19. A breakdown of this zone could signal the start of a deeper correction.
📅 USDT.D Analysis
A range has formed between 4.51 and 4.69, and this index is consolidating within it.
🔑 A breakout in either direction could give us a trade setup. Breaking above 4.69 confirms a bullish move, while breaking below 4.51 signals a bearish trend and potential market rally.
❌ Disclaimer ❌
Trading futures is highly risky and dangerous. If you're not an expert, these triggers may not be suitable for you. You should first learn risk and capital management. You can also use the educational content from this channel.
Finally, these triggers reflect my personal opinions on price action, and the market may move completely against this analysis. So, do your own research before opening any position.

GOLD - At CUT N REVERSE area? holds or not??#GOLD... perfect bounced from bottom and market constant showing buying scenarios.
Buy now market at his one of the most important n expensive area that is 3237
Keep close 3237
We will go for cut n reverse below that on confirmation.
Don't holds buying below 3237
Good luck
Trade wisely

TradeCityPro | CAKE: Triangle Squeeze Nears Breakout Decision👋 Welcome to TradeCity Pro!
In this analysis, I want to review the CAKE coin for you. This project is one of the crypto DEXs that operates on the BNB network and is among the most popular projects on that chain.
💫 This project’s token, CAKE, has a market cap of $747 million and ranks 95th on CoinMarketCap.
📅 Daily Timeframe
As you can see in the daily timeframe, a symmetrical triangle has formed, and the price is moving near the end of this triangle.
💥 Personally, I don’t trade when the price is in this area of the triangle and prefer to wait for the triangle to break, because there’s a high chance of random volatility that can cause missed opportunities due to incorrect entries.
✅ I recommend that you also wait for a breakout from this triangle and open a position only after it breaks—whether to the upside or downside.
✨ For a long position, you can enter after a breakout above 2.5. The main trigger will be the 2.847 zone. An RSI move into the Overbuy zone would also be a great confirmation for this position.
🔽 For a short position, our first trigger is the 1.909 level. If this level is broken, the price could start a downtrend toward 1.461. The main confirmation of a bearish trend will be a breakdown below 1.461.
📊 In any case, whichever trigger gets activated, I believe volume confirmation is essential. If volume increases along with price movement, the likelihood of that move being a fakeout decreases.
📝 Final Thoughts
This analysis reflects our opinions and is not financial advice.
Share your thoughts in the comments, and don’t forget to share this analysis with your friends! ❤️

Nothing !!!The SOL will increase $150 and reach to the top of the wedge in the coming weeks .
Give me some energy !!
✨We spend hours finding potential opportunities and writing useful ideas, we would be happy if you support us.
Best regards CobraVanguard.💚

Be careful with DOGE !!!So if you pay attention to the DOGE chart you can see that the price has formed a Ascending FLAG or DOGE which means it is expected to price move as equal as the measured price movement.( AB=CD )
NOTE: wait for break of the FLAG .
Give me some energy !!
✨We spend hours finding potential opportunities and writing useful ideas, we would be happy if you support us.
Best regards CobraVanguard.💚
_ _ _ _ __ _ _ _ _ _ _ _ _ _ _ _ _ _ _ _ _ _ _ _ _ _ _ _ _ _ _ _
✅Thank you, and for more ideas, hit ❤️Like❤️ and 🌟Follow🌟!
⚠️Things can change...
The markets are always changing and even with all these signals, the market changes tend to be strong and fast!!

TradeCityPro | Bitcoin Daily Analysis #92👋 Welcome to TradeCity Pro!
Let’s dive into today’s analysis of Bitcoin and key crypto indices. As usual, I’ll walk you through the futures session triggers for the New York session.
⌛️ 1-Hour Timeframe
As you can see in the 1-hour timeframe, the price has broken below the 102886 support and dropped to 101628, where it found support and is now making its way back toward the 102886 level.
✨ If the 102886 level is broken again, we could open a long position targeting the main recent high of the market at 104886.
🌩 The 104886 zone is a very significant level, and breaking it could initiate the next bullish leg for Bitcoin. However, the all-time high resistance at 106247 remains a solid barrier, forming a key supply zone between 104886 and 106247.
✔️ Since this zone is a major area of supply, it’s best to already be in a position before price reaches it. There’s a strong chance of a sharp move, and the breakout may not provide a clear confirmation candle, making it difficult to catch an entry in real time.
🔽 For short positions, our current trigger is the 101628 level. A breakdown here could begin a deeper correction. Key support levels to watch are 99225 and 97409.
👑 BTC.D Analysis
Moving on to Bitcoin dominance—yesterday, the trendline we had drawn was broken, and now dominance is heading toward 63.12.
🧩 The break of this trendline doesn’t indicate a trend reversal just yet. The bearish momentum in this current leg has been strong, and for a full reversal, we would need to see a higher high and higher low form on higher timeframes.
🔔 For now, the next corrective zones for dominance are at 63.61 and 64.10.
📅 Total2 Analysis
Let’s look at the Total2 index. Like Bitcoin, it has undergone a correction and has reached the 1.18 support level.
🎲 The current short trigger is the 1.18 level, and a breakdown here would confirm a deeper correction.
🔼 For long positions, the 1.24 and 1.26 levels are suitable triggers.
📅 USDT.D Analysis
Now let’s analyze Tether dominance. The index has corrected to the 4.69 level.
☘️ If 4.69 is broken, the market could undergo a deeper correction toward 4.82. On the other hand, if the price gets rejected from this level, the likelihood of a move back down to 4.51 increases.
❌ Disclaimer ❌
Trading futures is highly risky and dangerous. If you're not an expert, these triggers may not be suitable for you. You should first learn risk and capital management. You can also use the educational content from this channel.
Finally, these triggers reflect my personal opinions on price action, and the market may move completely against this analysis. So, do your own research before opening any position.
GOLD - at resistance? holds or not??#GOLD - perfect bounce from multi weeks bottom and now marekt near to his current resistance area that is around 3179 80 keep close it and if market hold it in that case we can expect a drop from here.
keep close and dont be lazy here.
good luck
trade wisely

GOLD - where is current resistance? Holds or not??#GOLD.. in yesterday market placed a low around 3167-68 and bounced back.
Now market just near to his current resistance area that is around 3184-85
Keep close that area and if market hold it in that case we can expect a further drop..
NOTE: we will go for cut n reverse above 3184-85 on confirmation ..
Good luck
Trade wisely

TradeCityPro | QNT: Range Top Test in RWA Uptrend Structure👋 Welcome to TradeCity Pro!
In this analysis, I’m going to review the QNT coin — one of the RWA projects currently ranked 71 on CoinMarketCap with a market cap of $1.19 billion.
⏳ 4-Hour Timeframe
As you can see, there’s a clear uptrend along with a trendline that has pushed the price up to the 100.7 level.
💥 At the moment, the price has formed a range box between 93.1 and 100.7, with multiple touches on both ends. Currently, the price is testing the top of this range at 100.7 once again.
🔍 If the 100.7 resistance is broken, we can consider entering a long position. This trigger is valid for a long, and if confirmed, the price could potentially move toward the next target at 121.8.
✨ For a short position, we first need to see the trendline break and the 93.1 level get triggered. That would serve as our first confirmation of a possible trend reversal.
📉 A breakdown below the 50 level on the RSI would be the first momentum-based sign of this reversal. If selling volume also increases at the same time, we’ll have confirmation of a volume divergence.
⚡️ On the other hand, a break of the trendline itself might act as an early trigger, but I personally wouldn’t open a position on that alone — it’s too risky. As long as the price holds above 93.1, the overall uptrend remains intact.
📝 Final Thoughts
This analysis reflects our opinions and is not financial advice.
Share your thoughts in the comments, and don’t forget to share this analysis with your friends! ❤️

SILVER - ultimate area, short only below that..#SILVER.. market placed a very reasonable low in yesterday tha tis around 32.08 and bounced back.
Keep close that area because that is our ultimate area in today and if market break that level then we will go for short means ....!
That is our cut n reverse area if you are convinced in long.
Good luck
Trade wisely

TradeCityPro | VETUSDT The Best Entry Opportunity Awaits👋 Welcome to TradeCityPro Channel!
Let’s dive in and analyze one of the veteran coins in the cryptocurrency space, VET, which has a high potential for movement. Together, we’ll identify its entry triggers.
🌐 Overview Bitcoin
Before starting the analysis, I want to remind you again that we moved the Bitcoin analysis section from the analysis section to a separate analysis at your request, so that we can discuss the status of Bitcoin in more detail every day and analyze its charts and dominances together.
This is the general analysis of Bitcoin dominance, which we promised you in the analysis to analyze separately and analyze it for you in longer time frames.
📊 Weekly Time Frame
In the weekly time frame, VET is one of the coins that’s in a relatively good position compared to other altcoins. While most altcoins have recorded new lows, VET has never lost the 0.01430 level!
After being supported at 0.01922 and closing a green weekly candle, we experienced an upward move. Currently, we’re stuck at the resistance of 0.03176, and it seems we’re pulling back to this resistance.
📉 Daily Time Frame
In the daily time frame, after an upward wave that didn’t quite reach the 0.09 resistance, a fake candle occurred, and we entered a box between 0.04197 and 0.05253. Seller presence and a rejection from the middle of the box led to losing the 0.04197 support.
After breaking this support, we experienced a sharp decline. When we reached the 0.01925 support, the bearish momentum hit its lowest point, and we saw reactions from buyers, leading to an upward move.
Currently, we’re below the key resistance at **0.03233**. After breaking this level, we can expect a sharp upward move. You can take a position in both **futures and spot**, with the safest stop loss for your buy at 0.01925
✍️ Final Thoughts
Stay level headed, trade with precision, and let’s capitalize on the market’s top opportunities!
This is our analysis, not financial advice always do your own research.
What do you think? Share your ideas below and pass this along to friends! ❤️

XRPUSDT - On the verge of historic Rally!- On the 3-day chart, XRP displays a breakout from the bullish pennant pattern, with a target implying nearly 200% upside from the breakout point — which aligns perfectly with the Fibonacci level 2.
- Additionally, price has broken above the neckline of the inverse Head and Shoulders pattern, further confirming bullish momentum.
-From an Elliott Wave perspective, the first four waves of the impulse sequence are complete, and we are now likely entering the fifth and final wave, which is estimated to be shorter than Wave 3. When applying this projection, Wave 5 also ends near the Fibonacci level 2.
Everything on the chart is aligned with impressive precision — there's no room for luck or coincidence here.
The Fibonacci 2 level is around $7. Try to accumulate XRP now, as no major corrections are expected in the coming days.
Best Regards Ceciliones🎯

FARTCOIN Bearish Head and Shoulders – Testing Blue Support🚨 $FARTCOIN Bearish Head and Shoulders – Testing Blue Support 📉
$FARTCOIN has formed a bearish head and shoulders pattern and is now testing the blue support. There’s potential for a breakout, so we need to watch closely for any signs of further movement! 📊
Let’s monitor this closely! 💼💸
