BNB Ready for PUMP or what ?Currently, BINANCE:BNBUSDC is forming an ascending triangle, indicating a potential price increase. It is anticipated that the price could rise, aligning with the projected price movement (AB=CD).
However, it is crucial to wait for the triangle to break before taking any action.
Give me some energy !!
Stay Awesome , CobraVanguard
Tradingview

Skeptic |EUR/USD : Bearish Breakout Unlocks Deep Corrections!Hey everyone, Skeptic here! Let’s start this Friday morning with a fresh EUR/USD analysis—some juicy setups are waiting! 😊 Our previous long position after the 1.13485 resistance break turned out to be a fake breakout, hitting our stop loss. But the short trigger I mentioned below 1.12676 activated, hitting a 2:1 R/R with a safe stop loss. Now, we’ve seen a pullback to that broken level, and if the trend continues, we can find more solid triggers. Stick with me to break it all down! Let’s start with the Daily Timeframe. 📊
📅 Daily Timeframe: The Big Picture
The upward channel on the daily chart has finally broken , and when we talk about a channel break, we don’t mean a weak one—this was confirmed by two strong bearish candles. We might see a pullback to the channel, but if not, a break below the 1.12006 support could send us into a deeper correction toward 1.08454 . To confirm a full trend reversal, we’d need to see lower highs and lower lows on the daily.
So, with this in mind, it’s smarter to take positions in lower timeframes (like 4H or below) in the direction of the current bearish momentum to boost your win rate and R/R. Let’s zoom into the 4-Hour Timeframe for the actionable setups.
⏰ 4-Hour Timeframe: Long & Short Setups
After a prolonged box range and a fake breakout above the box’s ceiling, the price has now broken lower and is pulling back. For our short setup, we already have a position open from above at 1.12676 . But after a break of 1.12012 (which aligns with daily support), we can add to our position—with proper capital and risk management, of course.
Another confirmation for the short? The RSI entering oversold territory can be a solid signal. Why oversold? We need tools to gauge momentum, like SMA, RSI, or volume (though volume only works well in crypto since forex volume isn’t transparent due to bank transactions, etc. In crypto, every transaction is recorded, so volume is reliable). RSI is one of my go-to tools for spotting momentum shifts, and it’s been a profit machine for me. But remember: oscillators and indicators aren’t entry signals —they’re confirmations for the setups we’re trading. Want to learn more? I could drop a few YouTube videos on RSI alone—it’s worth the deep dive! 📚
For a long setup , we’d need a return to the box range and a break above resistance at 1.13740 to open a long. I’m not giving any long triggers before that because, as we said, the daily momentum has shifted to a downtrend, and we don’t want to trade against the higher timeframe flow.
💬 Let’s Talk!
If this analysis helped you out, give it a quick boost—it means a lot! 😊 Got a pair or setup you want me to tackle next? Drop it in the comments, and I’ll get to it. Thanks for hanging out, and I’ll see you in the next one. Keep trading smart! ✌️

GOLD - single supporting area, holds or not ??#GOLD.. well guys market moved perfect as per our analysis in perveious ideas.
Now market just reached at his single supporting area 3290-91
That is market current supporting area so keep close and keep in mind that we will go for cut n reverse below that.
Good luck
Trade wisely

Testing Red Resistance – Breakout Potential!🚀 $PNUT Testing Red Resistance – Breakout Potential! 📈
$PNUT is currently testing the red resistance zone. If the price breaks through, the first target could be the green line level! 📊
Let’s catch this breakout together! 💼💸

Breakout Potential! 🚀 CSECY:PENGU Testing Red Resistance – Breakout Potential! 📈
CSECY:PENGU is currently testing the red resistance zone. If the price breaks through, the first target could be the green line level! 📊
Let’s catch this potential breakout together! 💼💸

MERL Forming Ascending Pattern – Breakout Ahead?🚀 AQUISUK:MERL Forming Ascending Pattern – Breakout Ahead? 📈
AQUISUK:MERL is currently forming an ascending pattern! 📊 If the price continues to rise, we could see a strong breakout soon. Keep an eye on this potential setup! 🔥
Let’s ride this breakout together! 💼💸

GOLD - reached at final support? What's next??#GOLD.. well guys market perfectly moved as per our analysis and now market job at reached at his final supporting area that is 3350-51 around
Keep close it n only short below that.
Good luck
Trade wisely

MOG Coin Testing Key Resistance – Breakout Ahead?🚀 TSXV:MOG Coin Testing Key Resistance – Breakout Ahead? 📈
TSXV:MOG Coin is currently testing the black resistance line. If the price breaks through, the first target could be the green line level. A clean breakout here could signal strong upward momentum. 📊
Let’s capitalize on this potential move! 💼💸

TradeCityPro | Bitcoin Daily Analysis #85👋 Welcome to TradeCity Pro!
Let’s move on to the analysis of Bitcoin and key crypto indices. As usual in this analysis, I’ll review the futures triggers for the New York session.
📰 Yesterday, the U.S. interest rate decision came out, which remained unchanged and didn’t have much impact on the market—this was expected for some time. Now that the news had no real effect, the market can continue its previous trend.
⏳ 1-Hour Timeframe
As you can see in the 1-hour timeframe, after the news came out yesterday, the price ranged a bit and then moved upward, triggering the 97409 level. I hope you entered a position with that trigger because I had emphasized it strongly.
✔️ Currently, the price has reached the 99337 zone and is stabilizing above it. If this holds, the next resistance level is 101965.
💥 The RSI oscillator is also in the Overbuy zone, which is helping the price maintain its bullish momentum. There’s a resistance at 75.77 on the RSI, and if that breaks as well, we could see a very sharp move in the chart.
📊 Buy volume has been strong in this leg and aligns with the trend. If volume starts decreasing, divergence will appear, and we’ll get the first sign of trend weakness. Just remember—weakness doesn’t mean trend reversal.
📉 As for short positions, I think by now you know my trading style. In a market like this, where momentum is strongly bullish and price is breaking resistance one after another, I don’t think opening a short position makes sense. We should wait for proper structure to form before considering a short.
👑 BTC.D Analysis
Moving on to Bitcoin dominance—yesterday the 65.28 zone was broken and price moved up near the top of the channel, but then reversed and has now dropped to the midline of the channel.
🔑 Currently, the dominant trend is still bullish, but short-term momentum is bearish, and there’s a good chance it drops further to 64.91.
⚡️ Since the higher timeframes are still bullish, we could see bullish momentum return at any time. Technically, the 64.91 zone is the next major support.
📅 Total2 Analysis
Let’s look at Total2—finally, the 1.05 trigger was activated, and Total2 started moving upward. I had strongly emphasized this trigger as well, and I hope you took advantage of it.
🧩 Price has now reached the 1.07 level, and if that breaks, it could move up to 1.1.
🔼 If this bullish move turns out to be a fakeout, the next valid triggers for short positions are a break of 1.03 and then 1.01.
📅 USDT.D Analysis
Now to Tether dominance—this index also broke the 4.99 level and is now trending downward.
🔍 If this move continues, we could see a drop to around 4.82. That would allow the market to continue its upward movement even further.
❌ Disclaimer ❌
Trading futures is highly risky and dangerous. If you're not an expert, these triggers may not be suitable for you. You should first learn risk and capital management. You can also use the educational content from this channel.
Finally, these triggers reflect my personal opinions on price action, and the market may move completely against this analysis. So, do your own research before opening any position.

TradeCityPro | HYPE: Bullish Momentum Builds Near Resistance👋 Welcome to TradeCity Pro!
In this analysis, I’m going to review the HYPE coin for you. The Hyperliquid project is one of the DEX projects in the crypto space that also functions as a Derivatives platform, and it currently holds the highest 24-hour volume among all DEXs.
🔍 The token for this project, with the symbol HYPE, has a market cap of $7.23 billion and is ranked 20th on CoinMarketCap.
⏳ 4-Hour Timeframe
In the 4-hour timeframe, as you can see, this coin is in an uptrend with an ascending trendline, and it’s currently encountering resistance at 21.48.
📈 If the price stabilizes above this zone, a new bullish wave can begin, with the next resistance being at 22.799.
✔️ You can enter a long position using the 21.48 breakout trigger. Buying volume has increased significantly, which raises the chances of this level breaking.
📊 For short positions and a potential bearish trend in this coin, the first trigger would be a rejection from the 21.48 resistance. If the price gets rejected at this level, the likelihood of breaking the trendline increases.
⭐ A break of the trendline itself can also serve as a trigger. Breaking this trendline would eliminate bullish momentum in the market, and a breakdown below the 39.29 level on the RSI would further support bearish momentum.
🔽 The main short position can be opened upon breaking the 19.552 level. This is a very strong support, and if the price closes below it, it could drop further to 17.88.
👀 Overall, the long setup on this coin looks quite logical, and if the 4-hour candle closes as is and doesn’t turn out to be a fakeout, it could be a great entry opportunity.
📝 Final Thoughts
This analysis reflects our opinions and is not financial advice.
Share your thoughts in the comments, and don’t forget to share this analysis with your friends! ❤️

"Bitcoin Analysis" (Update)The price has reached the 0.78 Fibonacci level, and as you can see, there is a low probability that this level will be broken. I expect that, from a technical perspective, the price will form a double top here and then decline to the Fibonacci levels. After reaching the support levels, I anticipate a strong push to GETTEX:98K . Additionally, the tensions from the India-Pakistan conflict could drive the price downward.
Stay Awesome , CobraVanguard

APT Coin Forming an Inverted Bullish Head and Shoulders! 🔥 APT Coin Forming an Inverted Bullish Head and Shoulders! 🚀
APT Coin is currently forming an inverted bullish head and shoulders pattern! 🧠 If the price breaks the red resistance line (neckline), this could trigger a strong bullish move! 📈
Keep an eye on this breakout – it's setting up for some exciting action! 🔥
Let’s catch this move together! 🌊💸

GOLD - at recent support? Short below ..#GOLD.. well guys market perfectly moved as per our recent ideas and now market just above his supporting area that is around 3321
Keep close that because below that market drop towards 3323
Stay sharp.
Good luck
Trade wisely

TradeCityPro | Bitcoin Daily Analysis #84👋 Welcome to TradeCity Pro!
Let’s dive into the analysis of Bitcoin and major crypto indices. As usual, I’m going to review the New York futures session triggers for you.
⏳ 1-Hour Timeframe
As you can see in the 1-hour timeframe, yesterday after news of tensions between India and Pakistan, Bitcoin moved upward and made a sharp rally to the 97409 zone, returning once again to this high.
📰 This news created fear in the market, and the buying that occurred was driven by fear and news impact. In my opinion, this bullish leg won’t be sustainable in the long term unless the price stabilizes above the 97409 level and starts a new upward leg.
✨ If the 97409 level is broken, we can enter a long position since it aligns with the current bullish trend, and we can position ourselves for the breakout with a wide stop-loss.
✔️ But make sure your stop-loss is wide and placed below the market’s main support because a significant resistance is being broken, and there's a high chance of volatility before the market actually moves upward. A tight stop-loss may get triggered before the actual rally begins.
💥 A momentum confirmation for today’s long position could be RSI entering the Overbuy zone, and if that happens, the chances of breaking 97409 increase significantly.
📉 For a short position, we should wait and see how the news impact plays out in the market. If it turns out to be driven by FOMO, naturally in the next few days, the price may move back down, and we could enter short positions on breaks of levels like 95370 or 93626.
👑 BTC.D Analysis
Let’s move to Bitcoin Dominance. Yesterday, dominance stabilized above the 64.91 level and managed to move up to 65.25.
🎲 Currently, Bitcoin is a much better option for long positions since dominance is rising, and even breaking 65.28 would confirm another bullish leg in dominance, potentially pushing it toward the top of the channel.
📅 Total2 Analysis
Let’s analyze Total2. Yesterday, this index faked a breakdown below 1.01 and simultaneously moved upward with the news, now reaching the 1.03 zone. A break of this zone could confirm a bullish move toward 1.05.
⭐ The main trigger for a long position remains the break of 1.05, and I strongly recommend being positioned if that level is broken.
🔽 For a short position, you can still enter on a break of 1.01 — I still think it’s a valid trigger.
📅 USDT.D Analysis
Now for USDT Dominance: yesterday, this index also faked a move above the 5.20 level and has since dropped to 5.04.
💫 Activation of the 5.04 trigger could be confirmation for a long position and a sign of USDT dominance starting to decline. The main trigger remains the break of the 4.99 bottom.
❌ Disclaimer ❌
Trading futures is highly risky and dangerous. If you're not an expert, these triggers may not be suitable for you. You should first learn risk and capital management. You can also use the educational content from this channel.
Finally, these triggers reflect my personal opinions on price action, and the market may move completely against this analysis. So, do your own research before opening any position.

TradeCityPro | SUI: Bullish Push Faces Key Resistance Test👋 Welcome to TradeCity Pro!
In this analysis, I want to review the SUI coin for you. It's one of the DeFi layer-1 projects that was highly hyped in 2024 and has recently gained renewed attention due to some news from the project.
🔍 This project's coin, with the symbol SUI, has reached a market cap of $11.3 billion, ranking it 11th on CoinMarketCap.
📅 Daily Timeframe
As you can see in the daily timeframe, since the last analysis I shared in this channel, the price has rebounded from the support zone I highlighted and, after breaking the trendline, made a bullish leg up to 3.6402.
📊 A significant amount of buying volume has entered the market, and the RSI has entered Overbuy territory. These two factors drove the bullish move, and the 3.6402 resistance is a key level that has temporarily held off further price increases.
✔️ Currently, we’re seeing a few corrective candles that caused the price to reject from this resistance, but it's holding up well and still looks poised to move back toward this level.
🛒 For spot buying, if the price moves back toward this area, you can enter a position on a break of 3.6402. The next trigger is the break of 4.0866, and the main resistance ahead is 5.2689.
🔽 If a correction occurs, support levels are 2.7830 and 2.2495. If price retraces, these can serve either as short targets or long entry zones depending on the price reaction.
📉 Confirmation of trend reversal would come if the price fails to make a higher high above 3.6402 and breaks the current low. After that, we can consider opening a short position.
📝 Final Thoughts
This analysis reflects our opinions and is not financial advice.
Share your thoughts in the comments, and don’t forget to share this analysis with your friends! ❤️

GOLD - again at CUT N REVERSE region, what's next??#GOLD.. market perfectly holds in first go as we discussed in our perveious idea.
And now market again at his cur n reverse region that is around 3381-87
Keep close that region and if market hold it in that case we can expect a bounce from here otherwise not.
NOTE: we will go for cut n reverse below 3381
Good luck
Trade wisely

GOLD - Near to CUT n REVERSE Area? what's next??#GOLD. market perfectly bounced from our area and now market just above his current suportinga area that is around 3382-87
keep close if market holds then further bounce on table.
NOTE: we will go for cut n reverse below our region.
good luck
trade wisely

"Nifty 50 Eyes Breakout from Key Support Zone"**Support Zone (Red Rectangle)**:
* Strong support between ₹24,290 – ₹24,340.
* Multiple price bounces have occurred here, indicating demand presence.
**Resistance Levels**:
* **Immediate resistance**: ₹24,409.65 (horizontal red line)
* **Next resistance**: ₹24,494.45
**Support Levels**:
* **Immediate support**: ₹24,290
* **Next support**: ₹24,240.65
**RSI (Relative Strength Index) – 14 Period**
* RSI is at **36.25**, near the oversold region.
* Indicates the index may be poised for a short-term bounce.
* Positive RSI divergence is not yet confirmed but should be monitored.
---
**Bullish Scenario**:
* A breakout above the black descending trendline (\~₹24,360) with volume can lead to:
* First target: ₹24,409.65
* Second target: ₹24,494.45
* Supported by wedge breakout and RSI recovery.
**Bearish Scenario**:
* Breakdown below ₹24,290 zone can trigger a fall to:
* First target: ₹24,240.65
* Second target: Lower bound of ascending channel (\~₹24,060)

Trade Setup Alert : BNB Levels to Watch 👀 Welcome to my Trading View Analysis and Trading Channel Here , we share the latest market analysis, trading signals, and key insights together .
Ready for smarter trades ? ⭐️
📊 BNB Technical Analysis – Key Zone in Focus for the Next Move
The BNB coin recently broke above the critical $584 resistance level and has successfully consolidated above it. This marks the second time the price has touched this zone, and in response, a strong bullish candle has formed — indicating a clear respect for this important area.
📍 Key Levels & Potential Trade Setups
Currently, the $584–$618 range acts as a decision zone, and price action here will likely determine the next major move.
🟢 If the price breaks above $618:
✅ A long position trigger is confirmed
🎯 Bullish targets:
First target: $732
Second target: $793
🔴 If the price drops below $584:
✅ A short position trigger is activated
🎯 Bearish target: $531
🧠 Additional Insights:
The 3 SMA indicator is currently positioned above the consolidation zone, potentially acting as dynamic resistance.
This area holds strategic importance for the Binance Smart Chain (BSC) ecosystem, making price behavior here highly significant.
⚠️ Final Notes:
We are at a crucial inflection point in the market. So:
Watch candlestick behavior closely
Maintain proper risk management
Wait for clear breakout confirmation before entering any trade
I love you all so much . 👀
don't forget about capital management and risk management .
Be careful with your positions . 🥇

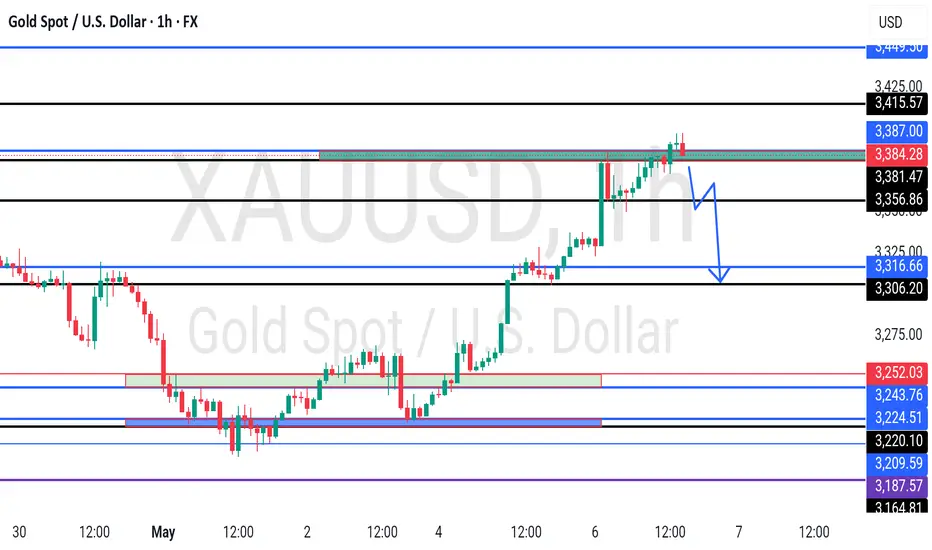
GOLD- alternate scnerios, what's next??#GOLD.. market behave volume drop above 3387
So again our area is 3381-87
And we will go for CUT n reverse below
Good luck
Trade wisely
INJ Breakdown in 1H | Bears in Control👀 Welcome to my Trading View Analysis and Trading Channel Here , we share the latest market analysis, trading signals, and key insights together .
Ready for smarter trades ? ⭐️
⚡️Today , we're going to analyze the INJ ( Injective) coin together on the daily timeframe and find triggers for our positions .
📉 INJ 1H Technical Breakdown
The INJ coin is currently exhibiting signs of weakness on the 1-hour timeframe, having broken below the key support level at $9.18 and continuing its downward trajectory. This movement indicates a shift in market sentiment towards bearishness.
Binance
🧭 Trend & Indicators:
Downtrend Formation: A clear downtrend is forming, characterized by lower lows and lower highs, suggesting sustained selling pressure.
Increasing Selling Volume: There's a noticeable increase in selling volume, reinforcing the bearish momentum.
Binance
RSI Approaching Oversold: The Relative Strength Index (RSI) is nearing the oversold zone, indicating potential for further downside but also cautioning traders of possible short-term reversals.
Price Below SMAs: The price is closing below all three Simple Moving Averages (SMAs), signaling a continuation of the bearish structure.
EMA 50 Rejection: A sharp rejection occurred after a retest of the EMA 50, followed by a strong red candle — a classic sign of bearish strength.
📰 Recent Developments:
Price Decline: Over the past week, INJ's price has declined by approximately 8.3%, reflecting broader market corrections.
CoinGecko
Market Activity: Despite the price drop, Injective's trading volume remains robust, indicating continued investor interest and market activity.
CoinCarp
+15
crypto.news
+15
Coinbase
+15
Technical Patterns: Analysts have observed that INJ has broken below the $10.25–$10.30 support zone, triggering a bearish continuation pattern.
Binance
📌 Trading Insight:
With proper risk management and a solid trading plan, this setup offers a potential short opportunity. The technical signals are aligned, and momentum appears to favor sellers for now.
🎯 Watch for continuation patterns or lower time frame triggers to enter with precision.
I love you all so much . 👀
don't forget about capital management and risk management .
Be careful with your positions . 🥇

TradeCityPro | Bitcoin Daily Analysis #83👋 Welcome to TradeCity Pro!
Let’s dive into the Bitcoin analysis and key crypto indices. As usual, I want to review the triggers for the New York futures session.
🔍 Today, I’ll provide the analysis in the 4-hour timeframe, since not much has changed on the 1-hour chart compared to yesterday, and it's better to take a slightly longer-term look at the chart.
⏳ 4-Hour Timeframe
As you can see in the 4-hour chart, we have an upward leg that started from the 84,000 zone and extended to 97,108. Currently, it's ranging between 93,626 and 95,370.
✔️ The main market top lies at 97,108, but the price has formed a range slightly lower, with 93,626 acting as support.
⚡️ There's a strong divergence visible in the RSI — while Bitcoin has formed three consecutive higher highs, RSI has printed lower highs. This divergence was activated when RSI broke below 50, and the price corrected to 93,626.
📊 In my opinion, the market has now digested the divergence, but the impact it had was a correction down to this level. If 93,626 breaks, deeper corrections could follow.
✨ The 93,626 zone overlaps with the 0.236 Fibonacci retracement and forms a PRZ. If this level breaks, we can open a short position. I open this kind of trade in lower timeframes as a scalp and take quick profits, since it’s counter-trend.
🔽 The maximum short-term target I expect for this trade is the 91,945 area. It's possible that the price corrects further or even reverses trend, but it's not logical in my strategy to hold these kinds of trades longer.
🔑 The key supports ahead are 91,945 (which overlaps with 0.382 Fibonacci), and further down are the 0.5 and 0.618 Fibonacci levels.
📈 For a long position, breaking 95,370 is currently the best trigger. You can also enter on a break of 97,139, but there's strong resistance at 98,828 that could halt the upward move.
🔼 If the price corrects and reaches 91,945, you can consider a long entry based on the price’s reaction to the supports I mentioned.
👑 BTC.D Analysis
Let’s move on to Bitcoin dominance. On the 4-hour chart, there’s an ascending channel where price is moving, with multiple touches. Right now, it’s testing resistance at 64.91.
☘️ If this level breaks, dominance could move up to the top of the channel. There’s also a very important static resistance at 65.59. If price reaches this area, we need to watch its reaction.
📅 Total2 Analysis
Now onto Total2. Similar to Bitcoin, it had a bullish leg, but corrected more deeply — down to the 0.382 Fibonacci retracement, and now it’s at the 1.01T support.
⭐ If this zone breaks, the next supports are at the 0.5 and 0.618 Fibonacci levels. There’s also a strong support at 980B, and the major bottom is at 932B.
📉 For a short position, breaking 1.01T is suitable. For a long position, a bullish reaction from this same area is a good trigger. The main long trigger is the break of 1.05T.
📅 USDT.D Analysis
Let’s move to Tether dominance. This indicator has reached a major top at 5.19. If this level breaks, it can move upward.
👀 If it breaks, the next resistance is 5.37. This move would coincide with a market correction or drop.
📊 To confirm a bearish Tether dominance (bullish market), rejection from 5.19 is a good trigger. The main trigger is still the break of 4.99.
❌ Disclaimer ❌
Trading futures is highly risky and dangerous. If you're not an expert, these triggers may not be suitable for you. You should first learn risk and capital management. You can also use the educational content from this channel.
Finally, these triggers reflect my personal opinions on price action, and the market may move completely against this analysis. So, do your own research before opening any position.

Skeptic | XAU/USD Analysis: Gold’s Next Big Move Is Brewing!Hey everyone, Skeptic here! Let’s kick off the morning with a deep dive into XAU/USD —gold’s serving up some exciting opportunities right now! 😊 Activating our triggers could spark a sharp move, potentially reigniting the major trend from before, so stick with me to the end of this analysis. As always, we’ll start with the Daily Timeframe to get the big picture. Let’s dive in! 📊
📅 Daily Timeframe: The Big Picture
It’s clear as day—the major trend is bullish . We’re seeing higher highs and higher lows, which, per Dow Theory, confirms a solid uptrend. After gold hit a peak at 3502.48 , it entered a secondary corrective trend, pulling back to the 50% Fibonacci retracement level. This correction was healthy, and the price action suggests the uptrend still has plenty of juice left. 💪
Post the sell-off candle on May 1, it looks like the correction might be done, and we’re now heading to test the resistance at 3425.31 . If that level breaks, we could see the major uptrend resume with some serious momentum. With this in mind, let’s zoom into the 1-Hour Timeframe to hunt for long and short triggers.
⏰ 1-Hour Timeframe: Long & Short Setups
The last trigger I used for a long position was at 3270.75 , and it’s been performing nicely so far. But if this growth is to continue—and the correction is truly over—we’re about to see some explosive moves. The long trigger I’m about to share is worth the risk. Plus, if we don’t enter longs around these levels, it’ll get trickier later. A break above 3494.51 could come with heavy shadows, hunting stop losses, or it might spike too fast, leaving us without a good entry. So, the smarter play is to enter now with lower risk and higher R/R. Here’s the plan:
Long Setup 📈
Open a long position after a break above resistance at 3383.61 .
Target? The previous ceiling is a good start, but don’t close too early. Enter with the mindset that if the ceiling breaks, you’re already in a position, sitting pretty. Personally, I’m keeping my earlier long from below open, letting those profits run for peace of mind later. 😎
Short Setup 📉
For shorts, patience is key. Wait for a rejection from these levels, followed by a break below support at 3270.75 . That’s when we open a short position. No rush to short just yet—gold’s not showing signs of a momentum shift. But if it does, we could see deeper corrections, so keep both triggers on your radar. 🐻
🧠 Why This Matters
Spotting these triggers in a multi-timeframe setup gives us an edge, aligning short-term moves with the bigger trend. It’s all about stacking the odds in our favor. Want more insights like this? Check out my latest article on multi-timeframe strategies —it’s a game-changer! 📚
💬 Let’s Talk!
If this analysis helped you out, give it a quick boost—it means a lot! 😊 Got a pair or setup you want me to tackle next? Drop it in the comments, and I’ll get to it. Thanks for hanging out, and I’ll see you in the next one. Keep trading smart! ✌️
