TradeCityPro | INJUSDT Ready for a Big Move?👋 Welcome to TradeCityPro Channel!
Let’s dive in and analyze one of the popular crypto projects, INJ, which has a high likelihood of movement, and check our entry triggers together.
🌐 Overview Bitcoin
Before starting the analysis, I want to remind you again that we moved the Bitcoin analysis section from the analysis section to a separate analysis at your request, so that we can discuss the status of Bitcoin in more detail every day and analyze its charts and dominances together.
This is the general analysis of Bitcoin dominance, which we promised you in the analysis to analyze separately and analyze it for you in longer time frames.
📊 Weekly Time Frame
On the weekly time frame, I see that the seventh period is stable, INJ, and compared to the majority of altcoins that have their own low price levels, it is in a better space and is engaged in its own supports!
After breaking the primary trend ceiling, namely 9.28, we experienced a sharp upward movement and formed a historical ceiling at $53, and after forming a distribution box and breaking the important floor of 16.20 and pulling back to it, we experienced a continued decline.
We have now reached support again, which was previously a very important resistance, and now, as a result, it is probably not lost, but the weekly candle is a very good and bearish candle! Don’t forget to save your profit, your strategy booklet, and your positions, otherwise, you will have made a 450% move without adding anything to your capital!
📉 Daily Time Frame
On the daily time frame, our trend is completely bearish as you can see, and the events are completely accompanied by the formation of a downward bottom and top, but we are likely to suffer for a while.
After getting rejected from 34.16 and forming a box between 20.16 and 25.93 and losing the bottom, it made a move and then while pulling back with low volume and the next conversion to red, it became an inverted Sharpe, we experienced a decline!
After breaking the daily trendline, which was also an important trendline, its trigger at 8.48 was broken, and we are currently engaged with the resistance at 10.47, and the next and most important trigger, so to speak, is after breaking 10.47, and you can even have a spot buy with this level!
🕓 4-Hour Timeframe
In the 4-hour time frame, we are also ranging between the box of 9.24 to 10.41, and practically, whichever side we break, we can say we can take its position and go along with it!
📈 For a long position, the trigger is completely clear, and after breaking 10.41, make sure to take a long position, and you can even open a position before this trigger breaks with the presence of momentum in lower time frames!
📉 For a short position, we have just formed the support at 9.24, and if we bounce from this support and hit a lower high, or better yet, get rejected before 10.41, we go for a short position and a break of 9.24!
✍️ Final Thoughts
Stay level headed, trade with precision, and let’s capitalize on the market’s top opportunities!
This is our analysis, not financial advice always do your own research.
What do you think? Share your ideas below and pass this along to friends! ❤️
Tradingview

ES Futures at a Crossroads: Fed Steady, Market ReadyCME_MINI:ES1!
Recent Market Performance
ES Futures experienced a significant decline of 22.30% from the February 19, 2025 high of 6218.50 to the recent low of 4832 on Monday, April 7th, 2025. This drawdown included a sharp 16.30% sell-off, triggered by the announcement of reciprocal tariffs, marking a decline from the April 2, 2025 high to the April 7th low.
Since forming that low, ES Futures have rebounded impressively—rallying 18.48% into the May 2nd high, retracing well over 50% of the losses. Notably, price action has closely respected Fibonacci retracement levels, as illustrated in the accompanying chart.
Macro Fundamentals
There are several macroeconomic considerations at play:
• Quarterly GDP data appears skewed due to front-loaded imports, evident in the January and February import numbers.
• This week’s March trade balance, imports, and exports data for both the U.S. and China will be crucial. These figures will shed light on how escalating tariff tensions have influenced Q1 business activity.
• The key event this week is the Federal Reserve interest rate decision and FOMC press conference. Of particular interest will be how the Fed’s risk outlook has evolved in light of Trade War 2.0, along with updates to growth and inflation forecasts.
While the Fed is expected to hold rates steady, there are increasing calls from President Trump to cut rates. Although recent soft data has shown signs of deterioration, this has not yet translated into hard data. In fact, April’s Non-Farm Payroll (NFP) report beat expectations, underscoring continued economic resilience.
Key Question: What Comes Next?
Will ES Futures continue to trend higher, reverse lower, or consolidate?
Key Technical Levels
• mCVAL: 5635
• Upper Neutral Zone : 5620 – 5585
• March 2025 Low: 5533.75
• Lower Neutral Zone : 5171.75 – 5150.75
Fibonacci Retracement Levels (2025 High to Low)
• 2025 High: 6218.50
• 0.786 Retracement: 5921.75
• 0.618 Retracement: 5688.75
• 0.5 Level (Mid-Range): 5525.25
• 2025 Low: 4832
Our View
We believe downside risks are currently minimized, barring a new market-moving development—such as a disruptive social media post. Q1 earnings have broadly reflected strength, reducing the probability of further downside in the near term.
Given the current backdrop:
• Positive news could act as a catalyst for higher prices.
• In the absence of significant newsflow, we expect consolidation, followed by a potential resumption of the upward trend.
Scenario 1
A pullback to either the blue support zone near the 0.618 Fibonacci retracement confluence, or a deeper pullback towards the confluence of the 2025 mid-range and March 2025 lows, followed by a continuation higher.
Scenario 2
Seasonality supports consolidation. Historical index behavior at this time of year further aligns with the potential for sideways movement before the next leg higher.

TradeCityPro | Bitcoin Daily Analysis #82👋 Welcome to TradeCity Pro!
Let’s dive into the analysis of Bitcoin and key crypto indicators. As usual, I’ll walk you through the futures triggers for the New York session.
⏳ 1-Hour Timeframe
As you can see, yesterday the price stabilized below 95370 and completed a downward leg to 93626, reacting exactly to the level I pointed out in the previous analysis.
✔️ I mentioned earlier that you could enter a short position after breaking 95370 — but remember, this position is against the higher timeframe trend, so the downward move will likely end once it hits the first support, since the market momentum remains bullish on larger timeframes.
💥 Currently, the price has reacted to 93626 and seems to be resting from the previous downward move. I believe a new range box may form between 95370 and 93626 — if that happens, I’ll go long on a break above 95370.
🔽 For short positions, given the bearish momentum in this timeframe, we can look to re-enter on a break below 93626 in the next retest.
📊 Watch volume and RSI today. The volume of red candles has been much higher than bullish ones, which increases the chance of a deeper correction. If you’re shorting, keep a tight stop-loss, take profits quickly, and treat it as a scalp trade.
📈 For long positions, since it’s against the short-term trend, you’ll need a wider stop — but if the correction ends and a new bullish leg begins, the trade may stay open longer.
🧩 As for RSI: as long as it stays below 50, market momentum is bearish. A break below 30 and entry into oversold increases the likelihood of more downside.
👑 BTC.D Analysis
Bitcoin dominance broke 64.77 yesterday and retraced to 64.60. If this downward move continues, we could see early signs of a trend shift.
✨ Important note: dominance has been in an uptrend on higher timeframes, so a break of 64.60 only confirms a short-term correction. Don’t take it as a trend reversal just yet.
💫 If dominance continues to drop and the market rises, altcoins could outperform Bitcoin. Conversely, if dominance rises again, Bitcoin will rally more than altcoins.
📅 Total2 Analysis
Total2 broke below 1.03 yesterday, retested it, and now looks set to continue downward. The next support is at 1.00 — if you’re already short, consider taking profits at that level.
☘️ We’ll get full trend reversal confirmation with a break below 1.00. For long positions, the 1.05 breakout is extremely important. I strongly recommend not missing that trigger if it happens.
📅 USDT.D Analysis
USDT dominance stabilized above 5.10 yesterday, moving further away from 4.99, and is now testing 5.19. A break above 5.19 would be a strong signal that a deeper market correction is starting.
🔑 On the flip side, a break below 4.99 is still the best and most important trigger to confirm the market’s return to a bullish trend.
❌ Disclaimer ❌
Trading futures is highly risky and dangerous. If you're not an expert, these triggers may not be suitable for you. You should first learn risk and capital management. You can also use the educational content from this channel.
Finally, these triggers reflect my personal opinions on price action, and the market may move completely against this analysis. So, do your own research before opening any position.

BTCUSDT - near to his resistance ? What's next??#BTCUSDT - market just placed his resistance area and now market trade below that.
Keep close that and if market holds current high then we can expect a drop from here.
Good luck
Trade wisely

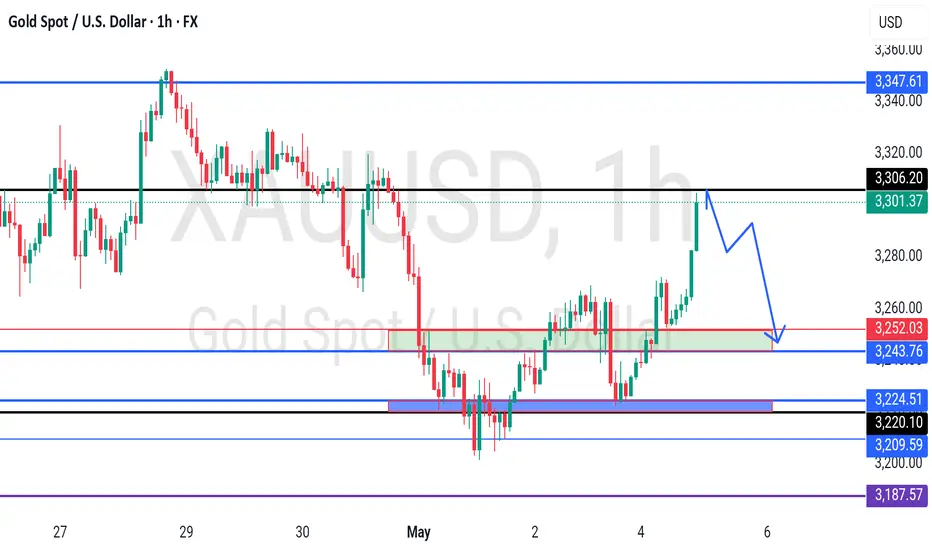
GOLD - reached at today resistance? What's next??#GOLD - perfect bounce above our area as we discussed in our video analysis.
Now market just reached at his today resistance area that is around 3302-05
Keep close it and if market holda then drop expected
Good luck
Trade wisely
TradeCityPro | TIA: Key Support Test in Cosmos-Based Token👋 Welcome to TradeCity Pro!
In this analysis, I want to review the TIA coin for you. This project is one of the protocols in the Cosmos ecosystem and currently ranks 53 on CoinMarketCap with a market cap of $1.51 billion.
📅 Daily Timeframe
As you can see on the daily chart, there's a descending trendline, and the price has been moving down along with it. Currently, the price has reached its main support zone at 2.274.
✨ This is the most critical support for this coin, and if it breaks, the price will move toward a new all-time low. So, buyers will do everything they can to protect this support.
💥 If the price gets supported at this level, the first trigger for opening a long position would be the breakout of the descending trendline. That trigger level is the break of 2.956.
🛒 You can also use this trigger for spot buying. The main trend reversal confirmation comes with a break above 4.324. However, in any case, if any of these triggers are activated, I personally will wait for Bitcoin dominance to show a trend reversal before buying altcoins on spot using the first solid trigger I find.
🔽 For short positions, the key point to remember is that the trend is already downward, so we don’t need a trend reversal confirmation to go short.
⭐ The short trigger is very clear and straightforward — if the 2.274 level breaks, you can enter a short position. Additionally, a pullback to the trendline can also be used as an entry point.
📝 Final Thoughts
This analysis reflects our opinions and is not financial advice.
Share your thoughts in the comments, and don’t forget to share this analysis with your friends! ❤️

"XRP Analysis" (Update)Here's what I can gather from the chart right now:
The Minor Resistance zone has been strongly broken to the upside; we haven't seen good pullbacks to this level yet.
On the other hand, below the broken zone, there's a price gap toward the FVG, as indicated by the arrow.
Also, the pullback to the breakout level at 0.382 has not been completed, and no patterns have formed in that area!
So? When we analyze all the breakout factors, we see a very high chance of a correction.
Now, this correction could start from the confirmation level at 2.11 OR 2.05, or with an overextension, it could happen from the 2.3 zone.
Stay Awesome , CobraVanguard

Skeptic |EUR/USD Analysis: Key Triggers and Setups for Big MovesHey everyone, Skeptic here! Welcome back to another analysis. Today, we’re diving into EUR/USD , a pair that’s super active and sitting at a critical spot. The triggers I’m about to break down could set us up for some solid risk/reward plays. Like always, let’s start with the Daily Timeframe to get the lay of the land. Here we go! 📊
📅 Daily Timeframe: The Big Picture
On the daily chart, we’ve got a clean upward channel that’s been rock-solid, with the price reacting nicely to the floor, ceiling, and midline. It’s hit the floor 4 times and the ceiling 4 times, so this channel is a reliable trigger we can work with. 💪
The 7-period SMA is hanging out above the candles, showing us the bullish momentum is still in play. Friday’s candle was a bullish indecision candle, which hints at a possible break of the channel’s floor. If that break happens, our first target could be 1.12006 . You can clone the channel and slide it lower to spot your next targets and support levels—check the chart below for a visual. Simple and effective! 🔍
⏰ 4-Hour Timeframe: Long & Short Setups
Let’s zoom into the 4-hour timeframe to find our long and short triggers. Here’s what we’re looking at:
Long Setup 📈
Wait for a solid break above the key resistance at 1.13485 . That’s our green light to jump into a long position.
Targets? We’re aiming for 1.14235 first, and potentially the channel’s midline if the move keeps going.
Quick tip: Take some profits at these levels, but don’t close out too soon—let’s milk those R/R ratios! 😉
Short Setup 📉
On the bearish side, watch for a break below support at 1.12676 , especially if the RSI dips into oversold. That could be a strong short trigger , as it’d also confirm a break of the upward channel, opening the door for a deeper pullback.
Since we’ve had a decent uptrend, this short setup could be extra reliable if the trigger hits. Let’s stay sharp! 🐻
🧠 Why Multi-Timeframe Analysis Matters
A multi-timeframe approach is like having a cheat code for trading. It helps us align the signals we find on lower timeframes with the bigger trends and cycles on higher ones. Want to dig deeper? I just wrote an article on this—definitely worth a read if you want to level up your game. 📚
💬 Let’s Talk!
If this analysis helped you out, give it a quick boost—it means a lot! 😊 Got a pair or setup you want me to tackle next? Drop it in the comments, and I’ll get to it. Thanks for hanging out, and I’ll see you in the next one. Keep trading smart! ✌️

BTCUSDT - Black Monday ? What's next??#BTCUSDT.. market perfect holds our resistance area as we discussed in our perveious idea regarding #btc
now market is going to close below our supporting area.
Keep close guys because eif market hold his current high then a drop expected below that.
Good luck
Trade wisely

formed a bearish head and shouldersXVS has formed a bearish head and shoulders pattern and has already broken below the blue neckline. This breakdown suggests a potential move down to the green line level.
📈 Technical Overview:
Pattern: Bearish Head and Shoulders
Neckline: Blue level, already broken.
🎯 Target: Green line level upon confirmation of the breakdown.

TradeCityPro | Bitcoin Daily Analysis #81👋 Welcome to TradeCity Pro!
Let’s get into the analysis of Bitcoin and the key crypto indices. As usual, I’ll review the futures triggers for the New York session.
⏳ 1-Hour Timeframe
As you can see, Bitcoin has continued its correction down to the 95370 level and is currently testing this zone.
✔️ If the price breaks below this level and moves further down, we will start to see signs of a trend reversal. However, for short positions, I personally prefer to wait for a confirmed trend reversal.
📈 For long positions today, if the price pulls back to the 95370 zone, you can consider entering. Confirmation of the pullback can be taken from lower timeframes through candlestick signals or structural breaks.
📊 Market volume increased during the last corrective leg, which could raise the probability of a break below 95370.
👑 BTC.D Analysis
Moving on to Bitcoin dominance — the range between 64.77 and 64.91 still holds, with price fluctuating within.
⚡️ A breakout above 64.91 would confirm the continuation of the uptrend. A break below 64.77 could suggest a deeper correction.
📅 Total2 Analysis
Looking at Total2, the 1.03 support has broken and price is now moving downward. If this trend continues, it could drop to lower support levels.
⭐ However, if the break below 1.03 turns out to be a fakeout, price could rebound and head back toward 1.05.
📅 USDT.D Analysis
Finally, USDT dominance has closed above 5.10 today and may be starting its bullish leg.
💥 If this upward move continues, the market could experience a broader sell-off. Should Bitcoin triggers activate, this would be a good context to consider short positions.
❌ Disclaimer ❌
Trading futures is highly risky and dangerous. If you're not an expert, these triggers may not be suitable for you. You should first learn risk and capital management. You can also use the educational content from this channel.
Finally, these triggers reflect my personal opinions on price action, and the market may move completely against this analysis. So, do your own research before opening any position.

"Bitcoin Analysis" (Update)Here's what I can gather from the chart right now:
The Minor Resistance zone has been strongly broken to the upside; we haven't seen good pullbacks to this level yet.
On the other hand, below the broken zone, there's a price gap toward the FVG, as indicated by the arrow.
Also, the pullback to the breakout level at 0.382 has not been completed, and no patterns have formed in that area!
So? When we analyze all the breakout factors, we see a very high chance of a correction.
Now, this correction could start from the confirmation level at 96,364, or with an overextension, it could happen from the 98k zone.
Stay Awesome , CobraVanguard

TradeCityPro | Bitcoin Daily Analysis #80👋 Welcome to TradeCity Pro!
Let’s dive into the Bitcoin analysis and key crypto market indicators. As usual, I’ll review the triggers for the New York futures session.
⏳ 1-Hour Timeframe
Yesterday, price made a bullish move and broke the 97139 zone, but later it turned out to be a fake breakout, and now it’s moving downward.
🔍 It’s likely that this downward move is just a pullback toward the SMA99 zone, and price may bounce back up afterward. If SMA99 breaks, deeper corrections down to 95370 are possible.
✔️ In my view, as long as price stays above the 95370 zone, Bitcoin remains in an uptrend. Only once price drops below this level can we start identifying potential bearish triggers.
📈 For now, we need to wait for more structure to develop before entering any positions. The 97139 level still remains a strong bullish trigger, but it’s best to wait for a reaction to it first so we can pinpoint the exact line, and then enter upon its breakout.
⚡️ Nothing more to add about Bitcoin for now — it’s Saturday, a weekend, and the chances of ranging price action are high.
👑 BTC.D Analysis
Looking at BTC dominance, yesterday it made a slight corrective move and pulled back to 64.77, where it seems to have found support.
📊 The next bullish trigger is the breakout of 64.91. Overall, the trend is still bullish, so if you're considering multi-day or swing positions, Bitcoin remains a better choice than altcoins.
📅 Total2 Analysis
Turning to the Total2 chart, this index was rejected from the 1.05 resistance once again yesterday and failed to hold above it. Until that changes, altcoins likely won’t see any significant upward momentum.
🔑 For downside movement in Total2, the trigger remains a break below 1.03.
📅 USDT.D Analysis
Now to Tether dominance — yesterday, this index finally closed a candle below the 4.99 level, but it was a fakeout, and it moved back above, once again preventing the broader market from turning bullish. This fakeout could inject bearish momentum into the market, potentially leading to deeper corrections.
⭐ For now, the 4.99 level still serves as a strong trigger for a bearish USDT dominance and thus a bullish signal for the market. A break above 5.10, however, would be a solid trigger for USDT dominance to trend higher.
❌ Disclaimer ❌
Trading futures is highly risky and dangerous. If you're not an expert, these triggers may not be suitable for you. You should first learn risk and capital management. You can also use the educational content from this channel.
Finally, these triggers reflect my personal opinions on price action, and the market may move completely against this analysis. So, do your own research before opening any position.

TradeCityPro | LDO: Watching for Breakout in DeFi Leader’s Range👋 Welcome to TradeCity Pro!
In this analysis, I’m going to review the LDO coin — one of the well-known DeFi projects within the Ethereum ecosystem with a significantly high TVL.
✔️ This project’s token currently has a market cap of $748 million, placing it at rank 86 on CoinMarketCap.
⏳ 4-Hour Timeframe
As you can see on the 4-hour chart, after a downtrend, LDO formed a bottom around the 0.676 zone and managed to rally up to 0.868.
🔍 Currently, the price is consolidating below that resistance in a ranging box. A breakout from either direction of the box could determine the next trend.
⭐ If the box breaks upward and the 0.868 level is breached, we can consider the prior downtrend over, and the price would be forming a new bullish structure. However, there is another resistance at 0.904 right above, and there’s a possibility of rejection from that level after the 0.868 breakout.
📈 For a long position, I personally plan to enter upon the breakout of 0.868. While it’s possible that the price might reverse from 0.904, I prefer having an earlier entry and using a more accessible trigger.
🔽 On the other hand, if the box breaks to the downside, the price might revisit the 0.676 support and potentially start a new bearish leg in line with the longer-term downtrend.
📉 The first short trigger is the break of 0.818 (the lower boundary of the box), but there’s another minor support at 0.795, which may cause a bounce.
👀 I personally prefer to wait for the 0.795 level to break for a short entry, given that market momentum is currently bullish, and I prefer a more reliable trigger for shorts.
📊 Volume within this range has been decreasing, which is normal in such consolidation phases. The longer the price stays in this range, the lower the volume tends to be — and typically, a breakout will lead to a sharper move.
The RSI oscillator also has a support zone at 43.17. If this level is broken, it could signal incoming bearish momentum and increase the probability of a downside breakout.
📝 Final Thoughts
This analysis reflects our opinions and is not financial advice.
Share your thoughts in the comments, and don’t forget to share this analysis with your friends! ❤️

SPY WEEKLY 2ND MAY 2025Welcome to Spy weekly. I have clearly discussed the price action. If you have any doubts, feel free to leave a comment or DM me.
NOTE:DO NOT SHORT

GOLD - reached at resistance zone ? What's next??#GOLD.. market perfectly bounced back from our supporting area as we discussed in our last idea.
Now market just reached at his r distance region.
From 3262 to 3269-70
Keep close the area and if market holds that in that case we can expect a drop from here.
Good luck
Trade wisely

Can we be optimistic that this will come true?( road to $1 )Perhaps this is a cup and handle pattern, and if that's the case, it could push the price up to around 90 cents.
Give me some energy !!
✨We spend hours finding potential opportunities and writing useful ideas, we would be happy if you support us.
Best regards CobraVanguard.💚
_ _ _ _ __ _ _ _ _ _ _ _ _ _ _ _ _ _ _ _ _ _ _ _ _ _ _ _ _ _ _ _
✅Thank you, and for more ideas, hit ❤️Like❤️ and 🌟Follow🌟!
⚠️Things can change...
The markets are always changing and even with all these signals, the market changes tend to be strong and fast!!

AI16Z Forming Cup and Handle Pattern🚨 $AI16Z Forming Cup and Handle Pattern 🚨
$AI16Z is forming a cup and handle pattern and is currently waiting for a breakout above the red resistance zone. If the breakout is confirmed, the target will be the green line level.
📈 Technical Overview:
Pattern: Cup and Handle
Resistance Zone: Red area currently being tested.
🎯 Breakout Target: Green line level upon confirmation.

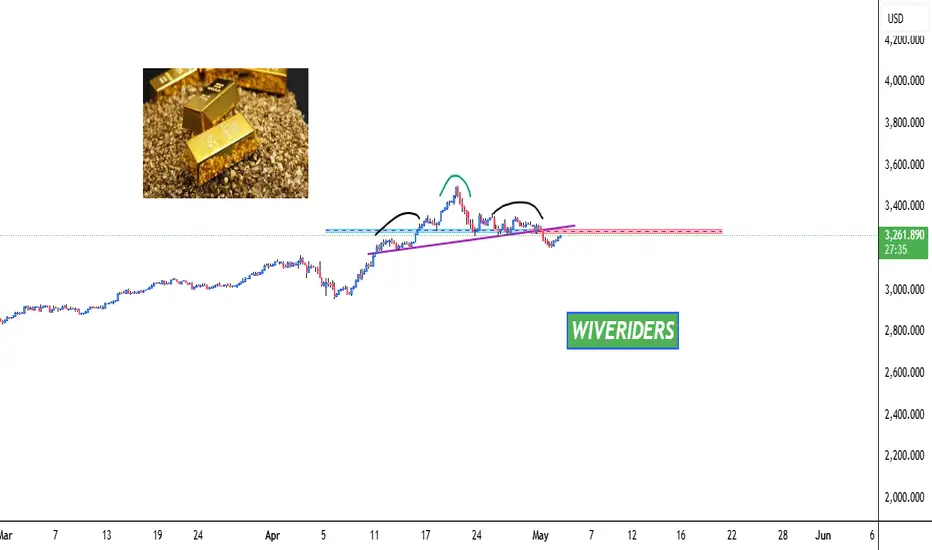
GOLD Formed Bearish Head and Shoulders Pattern🚨 TVC:GOLD Formed Bearish Head and Shoulders Pattern 🚨
TVC:GOLD has formed a bearish head and shoulders pattern and appears to be making a pullback to the neckline before a potential drop. However, if the price breaks out above the right shoulder, the bearish pattern could be invalidated.
📈 Technical Overview:
Pattern: Bearish Head and Shoulders
Neckline: Current pullback area.
Bearish Confirmation: A drop below the neckline could confirm the bearish move.
Invalidation: If the price breaks out above the right shoulder, the bearish pattern may be invalidated.
GOLD - Low placed ? What's next??#GOLD.. market placed a reasonable low sofar.
And if market holds that then we can expect a further bounce.
Good luck
Trade wisely

TradeCityPro | Bitcoin Daily Analysis #79👋 Welcome to TradeCity Pro!
Let’s dive into Bitcoin and key crypto index analysis. As usual, in this analysis, I’ll walk you through the futures session triggers for the New York session.
⏳ 1-Hour Timeframe
On the 1-hour timeframe, as you can see, yesterday the price stabilized above the 95370 zone and continued its movement up to 97139.
✔️ The reason the price couldn’t move higher is that the RSI failed to stay above the 70 level and didn’t enter the Overbuy zone — it got rejected there. As a result, the price also got rejected from the 97139 resistance and is currently in a corrective phase.
🧩 The SMA25 indicator has now caught up to the price, and this could bring upward momentum into the market. If that happens, the price might resume its upward move, and breaking the 97139 high could lead to a continuation toward the 98828 zone.
📊 Volume increased during the bullish candles, but after reaching the 97139 high, volume returned to previous levels, and the price has been ranging.
⚡️ Today, if RSI enters the Overbuy zone, a bullish move is very likely — in that case, I recommend definitely holding a long position.
🔽 As for short positions and bearish sentiment on Bitcoin, as I’ve been saying for a while, we should wait for a proper trend reversal before entering short trades.
📈 If the price doesn’t respond to the SMA25 and keeps ranging, the next parameter that could drive bullish momentum is the SMA99.
👑 BTC.D Analysis
Moving to Bitcoin Dominance — BTC.D is still trending upward. Yesterday, after breaking the 64.72 ceiling, it started a new bullish leg, and so far, there’s no sign of trend weakness.
🎲 I suggest waiting for a new structure to form. For now, it’s still rising, and if this continues, Bitcoin will likely outperform altcoins.
📅 Total2 Analysis
Looking at Total2, this index was rejected from the 1.05 resistance yesterday. The reason is that Bitcoin dominance surged, meaning not much money flowed into altcoins, and Total2 couldn’t break its ceiling.
🔼 If BTC.D reverses and pulls back, a lot of capital could move into altcoins — in that case, we can consider opening long positions on altcoins.
📅 USDT.D Analysis
Now to Tether Dominance — another reason Bitcoin couldn’t extend its bullish leg yesterday was this indicator. Support at 4.99 held, preventing money from entering the market, and causing the correction phase.
💫 Currently, the 4.99 level remains a crucial trigger. If it breaks, the main bullish trend in the market could begin. On the other hand, a break above 5.10 would likely push the market into a deeper correction.
❌ Disclaimer ❌
Trading futures is highly risky and dangerous. If you're not an expert, these triggers may not be suitable for you. You should first learn risk and capital management. You can also use the educational content from this channel.
Finally, these triggers reflect my personal opinions on price action, and the market may move completely against this analysis. So, do your own research before opening any position.

SUSDT - This opportunity might not come around again.!All tokens built on the Ethereum network pumped yesterday as ETH moved up by just 4%, and SONIC (S) stood out as the top performer among them, surging by around 22%.
Currently, the coin has formed a symmetrical triangle pattern, which has been broken to the upside with a massive green candle. It's now retesting the 0.382 Fibonacci level — a key zone to watch for continuation.
This is a massive investment opportunity to buy the token at around $0.55 only.
The long-term targets for S in 2026 are insane — the most conservative target for now is $1.20.
Best regards Cecilion🎯

TradeCityPro | ENA: Expansion Pattern Near Critical Break Levels👋 Welcome to TradeCity Pro!
In this analysis, I want to review the ENA coin for you. The Ethena project is one of the DeFi projects in crypto that has attracted a lot of hype in this category.
💥 ENA coin, with a market cap of $1.7 billion, ranks 50th on CoinMarketCap.
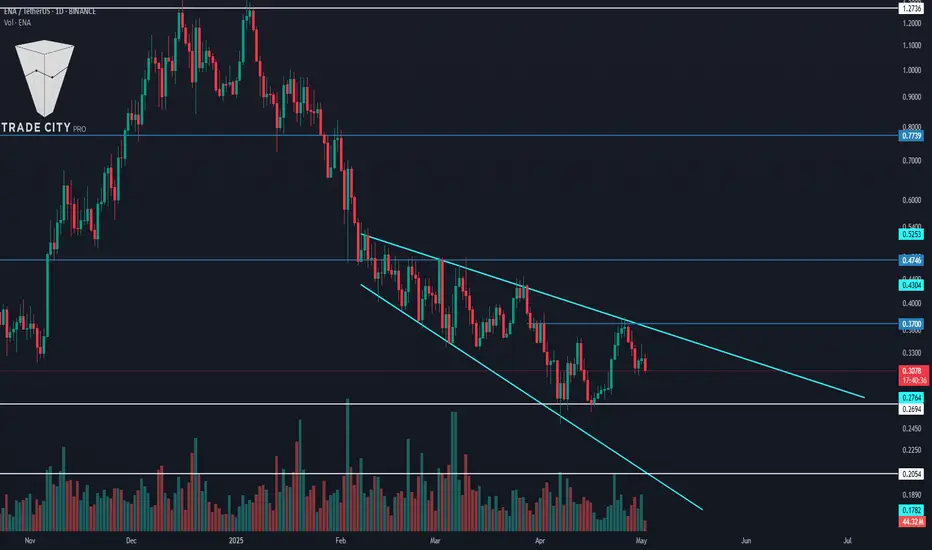
📅 Daily Timeframe
As you can see on the daily chart, there is an Expanding Triangle, and the price is fluctuating within this pattern.
📚 One key characteristic of an Expanding Triangle is that while the price is within the triangle, it tends not to respect static levels such as supports and resistances. Currently, the price is within the triangle and, as you can see, it doesn’t respond significantly to static zones.
📈 For this coin to become bullish, the triangle must break to the upside and the triangle trigger at 0.37 should be activated. In that case, the price can move upward and begin a bullish trend. Full confirmation of the bullish reversal will come with price stabilization above 0.4746.
✔️ For continued downward movement, the first trigger is the break of 0.2694. If you already hold this coin, you can use this level as a stop-loss — and once the price closes below it, you can trigger your stop-loss.
📊 For short positions, the break of 0.2694 is a valid trigger, but the issue is that it activates before the triangle breaks, and I personally prefer not to open a position within an Expanding Triangle — I’d rather wait and enter after it breaks.
🔽 Another trigger for a bearish move is the break of 0.2054. This is the main support for ENA, and if it breaks, the price will register a new All-Time Low.
📝 Final Thoughts
This analysis reflects our opinions and is not financial advice.
Share your thoughts in the comments, and don’t forget to share this analysis with your friends! ❤️