SUSDT - This opportunity might not come around again.!All tokens built on the Ethereum network pumped yesterday as ETH moved up by just 4%, and SONIC (S) stood out as the top performer among them, surging by around 22%.
Currently, the coin has formed a symmetrical triangle pattern, which has been broken to the upside with a massive green candle. It's now retesting the 0.382 Fibonacci level — a key zone to watch for continuation.
This is a massive investment opportunity to buy the token at around $0.55 only.
The long-term targets for S in 2026 are insane — the most conservative target for now is $1.20.
Best regards Cecilion🎯
Tradingview

TradeCityPro | ENA: Expansion Pattern Near Critical Break Levels👋 Welcome to TradeCity Pro!
In this analysis, I want to review the ENA coin for you. The Ethena project is one of the DeFi projects in crypto that has attracted a lot of hype in this category.
💥 ENA coin, with a market cap of $1.7 billion, ranks 50th on CoinMarketCap.
📅 Daily Timeframe
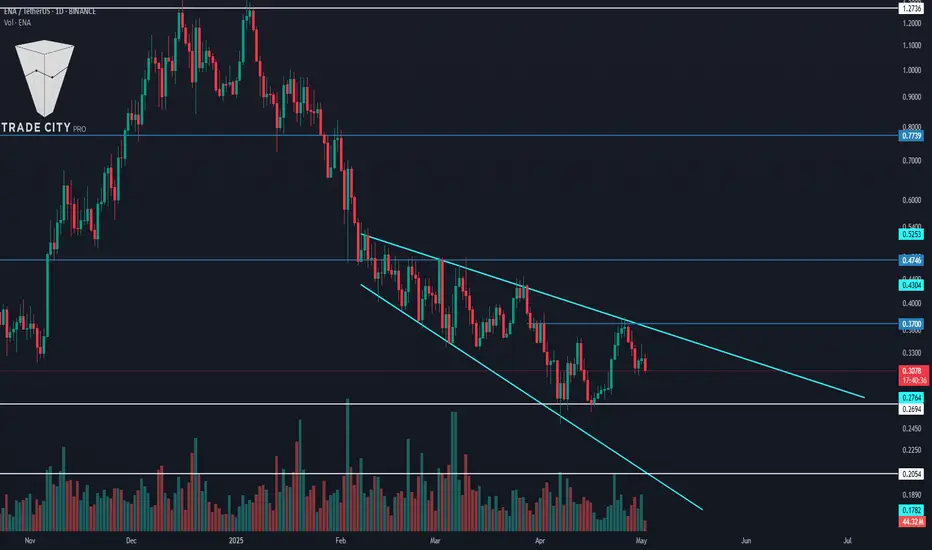
As you can see on the daily chart, there is an Expanding Triangle, and the price is fluctuating within this pattern.
📚 One key characteristic of an Expanding Triangle is that while the price is within the triangle, it tends not to respect static levels such as supports and resistances. Currently, the price is within the triangle and, as you can see, it doesn’t respond significantly to static zones.
📈 For this coin to become bullish, the triangle must break to the upside and the triangle trigger at 0.37 should be activated. In that case, the price can move upward and begin a bullish trend. Full confirmation of the bullish reversal will come with price stabilization above 0.4746.
✔️ For continued downward movement, the first trigger is the break of 0.2694. If you already hold this coin, you can use this level as a stop-loss — and once the price closes below it, you can trigger your stop-loss.
📊 For short positions, the break of 0.2694 is a valid trigger, but the issue is that it activates before the triangle breaks, and I personally prefer not to open a position within an Expanding Triangle — I’d rather wait and enter after it breaks.
🔽 Another trigger for a bearish move is the break of 0.2054. This is the main support for ENA, and if it breaks, the price will register a new All-Time Low.
📝 Final Thoughts
This analysis reflects our opinions and is not financial advice.
Share your thoughts in the comments, and don’t forget to share this analysis with your friends! ❤️
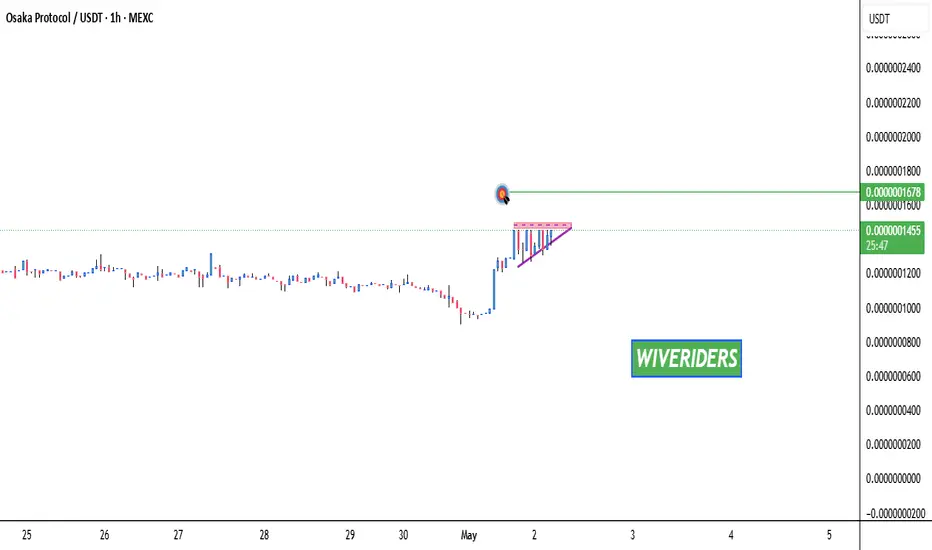
OSAK Testing Red Resistance Zone🚨 $OSAK Testing Red Resistance Zone 🚨
$OSAK is currently testing a significant red resistance zone. If the price successfully breaks out above this level, the target will be the green line level.
📈 Technical Overview:
Resistance Zone: Red area currently being tested.
🎯 Breakout Target: Green line level upon confirmation.
ascending triangle patternSEED_DONKEYDAN_MARKET_CAP:ILV is forming an ascending triangle pattern and is approaching a key red resistance zone. If the price breaks out above this level with confirmation, the target will be the green line level.
📈 Technical Overview:
Pattern: Ascending Triangle
Resistance Zone: Red area currently being tested.
🎯 Breakout Target: Green line level upon confirmation.

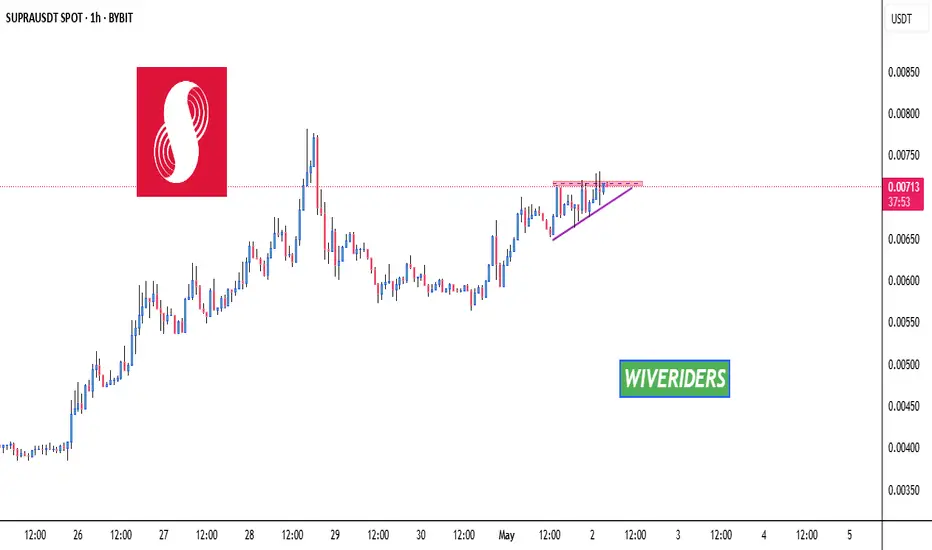
SUPRA is forming an ascending triangle patternSUPRA is forming an ascending triangle pattern and is approaching a key red resistance zone. A breakout above this level could confirm the bullish pattern and signal a strong upward move.
📈 Technical Overview:
Pattern: Ascending Triangle
Resistance Zone: Red area currently being tested.
🎯 Breakout Target: To be determined upon confirmation of the breakout.
NAVX has formed a cup and handle pattern NAVX has formed a cup and handle pattern and is now waiting for a breakout above the red resistance zone. If the price successfully breaks out, the target will be the green line level.
📈 Technical Overview:
Pattern: Cup and Handle
Resistance Zone: Red area currently being tested.
🎯 Breakout Target: Green line level upon confirmation.

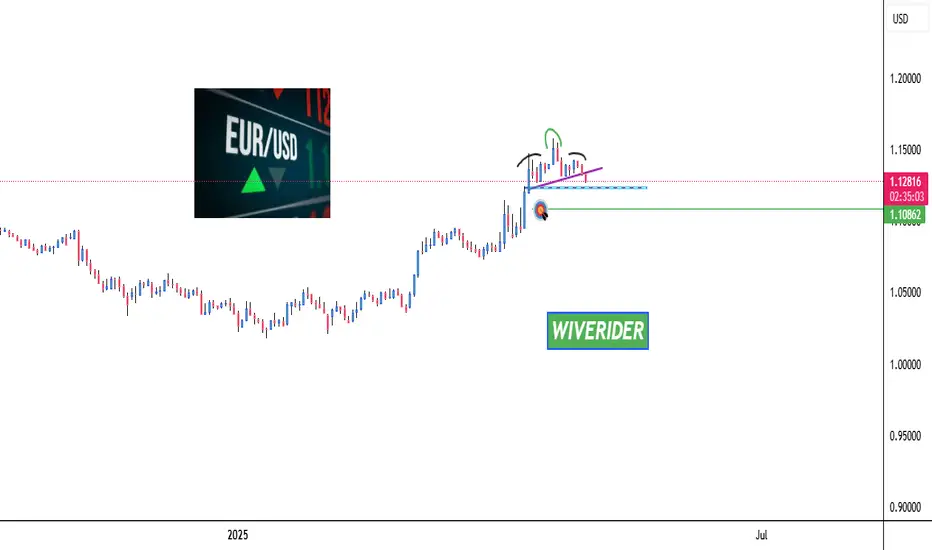
head and shoulders pattern EURUSD has formed a head and shoulders pattern and is now approaching the blue support zone. If the price breaks below this support level, it could signal a bearish move with the target set at the green line level.
📈 Technical Overview:
Pattern: Head and Shoulders
Support Zone: Blue area currently being approached.
🎯 Breakdown Target: Green line level upon confirmation of the breakdown
TradeCityPro | Bitcoin Daily Analysis #78👋 Welcome to TradeCity Pro!
Let’s get into the analysis of Bitcoin and key crypto indices. As usual, in this analysis I’ll review the triggers for the New York futures session.
⏳ 1-Hour Timeframe
As you can see in the 1-hour timeframe, Bitcoin is finally stabilizing above the 95,370 level. If this movement continues and the price stays above this level, the likelihood of a move up to 98,828 increases.
✔️ Over the past few days, I’ve strongly emphasized that you should open a position once 95,370 breaks. I hope you did, because that entry point was very significant, and breaking it could mark the beginning of Bitcoin’s next bullish leg.
💥 Currently, RSI is entering the Overbought zone, and if that happens, the chances of a sharp upward move increase. Buying volume is also rising, which is expected when a resistance level is broken.
📊 At the moment, opening new positions doesn't make much sense. If you already have an open position, I recommend riding the market momentum and taking profits whenever you notice momentum fading.
👑 BTC.D Analysis
Bitcoin dominance dropped slightly yesterday and returned below the 64.60 level. If this level is broken again, we can reconfirm the bullish sentiment.
🧩 If dominance gets rejected from the 64.60 ceiling, it’s likely to drop back down to the 64.22 support level.
📅 Total2 Analysis
Let’s look at Total2. Yesterday we saw a downward correction that extended to the 1.00 level. If you recall, I previously said I wouldn’t consider a trend reversal confirmed just from the 1.03 break — I’d wait for a break of the 1.00 support.
🔑 That’s why I didn’t close any of my positions at 1.03 and instead waited to see how the price would react at 1.00. As shown, the price reacted strongly at that level and quickly returned above 1.03.
✨ If the 1.05 level breaks, altcoins — just like Bitcoin — could begin a new bullish leg.
📅 USDT.D Analysis
Now let’s look at USDT dominance. Yesterday, it made a bullish move and broke above the 5.10 level, but the entire move turned out to be a fakeout, and the price dropped back below 5.10.
⭐ Currently, dominance is heading toward the 4.99 support. The main trigger for a bullish market shift is the break of this 4.99 level in Tether dominance. If this happens, altcoins will likely begin their bullish moves.
❌ Disclaimer ❌
Trading futures is highly risky and dangerous. If you're not an expert, these triggers may not be suitable for you. You should first learn risk and capital management. You can also use the educational content from this channel.
Finally, these triggers reflect my personal opinions on price action, and the market may move completely against this analysis. So, do your own research before opening any position.

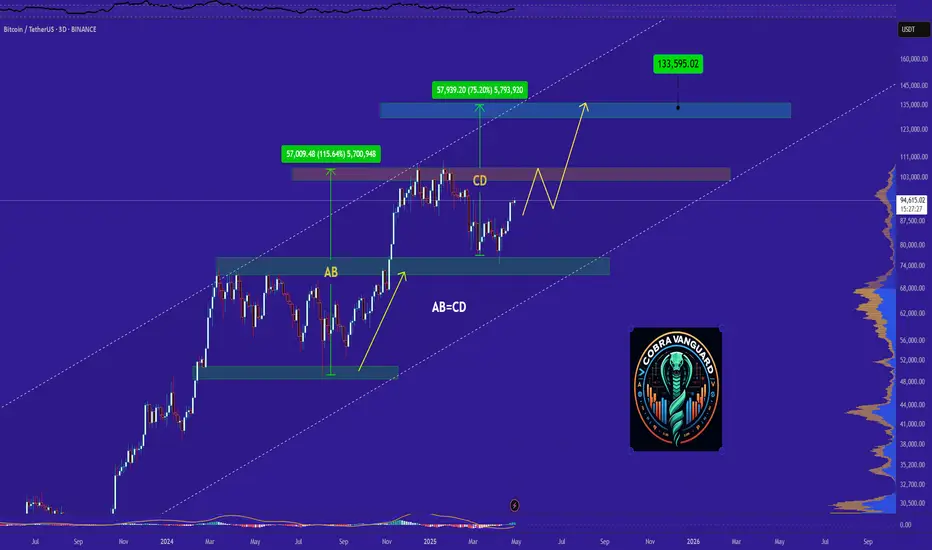
BNB Ready for PUMP or what ?Currently, BNB is forming an ascending triangle, indicating a potential price increase. It is anticipated that the price could rise, aligning with the projected price movement (AB=CD).
However, it is crucial to wait for the triangle to break before taking any action.
Give me some energy !!
✨We spend hours finding potential opportunities and writing useful ideas, we would be happy if you support us.
Best regards CobraVanguard.💚
_ _ _ _ __ _ _ _ _ _ _ _ _ _ _ _ _ _ _ _ _ _ _ _ _ _ _ _ _ _ _ _
✅Thank you, and for more ideas, hit ❤️Like❤️ and 🌟Follow🌟!
⚠️Things can change...
The markets are always changing and even with all these signals, the market changes tend to be strong and fast!!

Nobody appreciates it !!!As you can see, the price is likely forming a Rounded bottom or cup and handle pattern. If our assumption is correct, we should wait for this patterns to break out to see a price increase.
Give me some energy !!
✨We spend hours finding potential opportunities and writing useful ideas, we would be happy if you support us.
Best regards CobraVanguard.💚
_ _ _ _ __ _ _ _ _ _ _ _ _ _ _ _ _ _ _ _ _ _ _ _ _ _ _ _ _ _ _ _
✅Thank you, and for more ideas, hit ❤️Like❤️ and 🌟Follow🌟!
⚠️Things can change...
The markets are always changing and even with all these signals, the market changes tend to be strong and fast!!

TradeCityPro | FET: AI Token Eyes Breakout After Sharp Rebound👋 Welcome to TradeCity Pro!
In this analysis, I’m going to review the FET coin for you. This project is one of the top AI-related projects in the crypto category.
💫 With a market cap of $1.8 billion, it currently ranks 48th on CoinMarketCap.
📅 Weekly Timeframe
In the previous analysis, I mentioned that if the ascending trendline in this timeframe is broken, the price would make a higher high beyond 3.099, and with the activation of the trendline trigger, we could confirm a trend reversal in this timeframe.
✔️ As you can see, that scenario has played out. After breaking the trendline and the 0.382 Fibonacci level, the price dropped sharply down to the 0.786 level.
✨ The price reaction at this level was very quick, and after hitting this zone, it gained bullish momentum again with a bullish engulfing candle and has now reached the 0.797 area.
📈 If the 0.797 level breaks, the price could experience another sharp upward move. The next resistance levels are 1.095, 2.068, and 3.099 — with 1.095 overlapping with the 0.382 Fibonacci level.
📊 The main confirmation of trend reversal will be given by forming a higher high and higher low above the 0.797 level — confirming Dow Theory.
🔽 For a bearish continuation, the confirmation comes with a break of the 0.786 Fibonacci level. The main support levels are 0.185 and 0.058.
📅 Daily Timeframe
In the daily timeframe, we can better see the details of this bullish move. As observed, the price has had a sharp leg up from the 0.379 bottom to 0.791 without any real correction.
🧩 Given the strength of the 0.791 resistance, a correction is more likely here. If the price moves upward without correction, it’s usually not a good sign for trend sustainability. A healthy trend includes corrections.
🎲 However, if 0.791 breaks and RSI enters the Overbought zone, the price could continue rising toward the 1.128 resistance. While this might not be ideal for trend health, the risk-to-reward ratio makes opening a position worthwhile.
🛒 In my opinion, a correction followed by a new bullish wave would be a more ideal setup, increasing the chances of a breakout. Breaking this level could be a strong trigger for both spot buying and futures positions.
📉 For a bearish scenario, we need to wait for the price reaction to 0.791 and then enter after confirmation of trend reversal. Lower-level triggers would be the breaks of 0.567, 0.455, and 0.379.
📝 Final Thoughts
This analysis reflects our opinions and is not financial advice.
Share your thoughts in the comments, and don’t forget to share this analysis with your friends! ❤️

GOLD - at his final support, holds or not??#GOLD. market just reached at his final supporting area of the week and month that is around 3265-70 with a pervious week low of 3259
keep close the region because if market break that region then we can see a further drop towards downside next supporting areas.
good luck
trade wisely

TradeCityPro | ENSUSDT Huge Breakout Coming? 👋 Welcome to TradeCityPro Channel!
Let’s dive in and analyze one of the DeFi coins, ENS, together. It’s been performing well recently and has some exciting news!
🌐 Bitcoin Overview
Before starting the analysis, I want to remind you that, as per your request, we’ve moved the Bitcoin analysis from the main section to a separate daily analysis. This allows us to discuss Bitcoin’s status in more detail and analyze its charts and dominance together.
This is the general analysis of Bitcoin dominance, which we promised to cover separately and analyze in longer timeframes.
📊 Weekly Timeframe
In the weekly timeframe, ENS is one of the bullish coins in the market with a promising outlook. It began its main upward movement before the start of 2025, back in late 2023.
After breaking the 9.99 level, we entered the main uptrend, and we can say that we broke the market cap ceiling, achieving a new ATH market cap.
We’re also riding a bullish curved line that acts as support. If this line is broken, it signals a weakening of the main uptrend. A drop below 15.90 would indicate a trend change in the MWC (Market Wide Correction).
Currently, our key weekly support has shifted. We were supported at 13.15, easily moving past this level. Our spot exit trigger is now 13.15, whereas last week it was 15.90.
📈 Daily Timeframe
In the daily timeframe, after a rejection from the ATH at 47.68, we entered a range box between 30.75 and 37.77. After some weak movements toward resistance, we saw a corrective wave.
Following a daily engulfing candle that covered the previous three candles, we experienced a sharp downward wave to 13.49. After that, seller pressure seemed to fade, and buyers stepped in. After a fake breakout at 13.49, we saw a move up to 18.41.
Additionally, the trendline formed during the recent declines in this chart was broken after the support at 13.49. However, since the trigger hasn’t been activated yet, we’re not acting on this trendline for now. But if 18.41 is broken, you could consider a risky spot buy.
✍️ Final Thoughts
Stay level-headed, trade with precision, and let’s capitalize on the market’s top opportunities!
This is our analysis, not financial advice always do your own research.
What do you think? Share your ideas below and pass this along to friends! ❤️

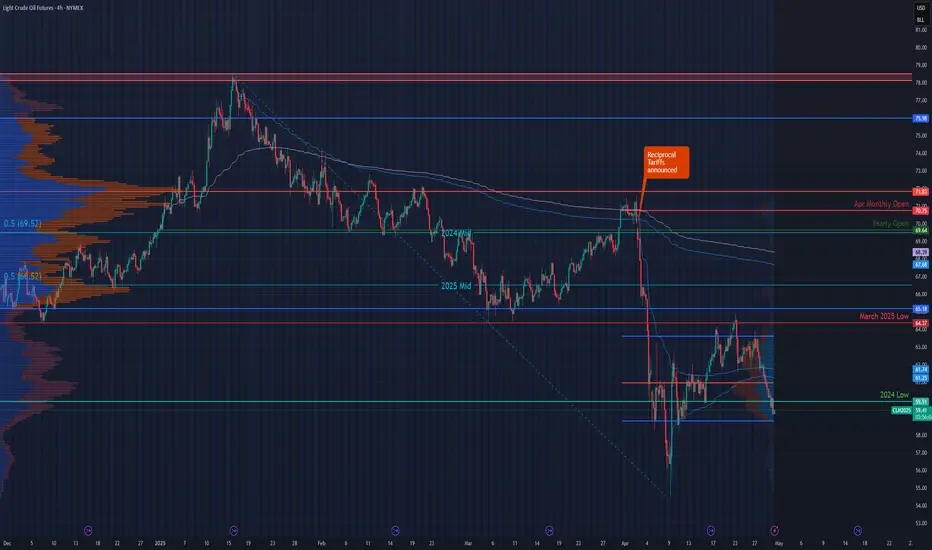
Planning for the Next Trade in Crude OilNYMEX:CL1!
Key Levels – Higher Timeframe:
• 2025 High: 78.56
• Yearly Open (2025): 69.64
• 2025 mCVPOC: 71.83
• Yearly VWAP: 68.41
• AVWAP from Yearly Highs: 67.71
• 2025 mCVAL: 65.28
• March 2025 Low: 64.37
• 2024 Low: 59.91
April 2025 Key Levels:
• April mCVAL: 58.79
• April mCVPOC: 60.94
• April AVWAP from Lows: 61.29
• April AVWAP from Highs: 61.76
• April mCVAH: 63.73
Our previous trade idea played out as expected. With updated levels now in place, we aim to reassess the market context without falling into recency or confirmation bias. These biases often lead to an overly bearish outlook at market lows, especially amid ongoing headlines around trade war tensions and supply concerns. While such fundamentals are important, maintaining objectivity is key.
This leads us to the central question: Is all this bearish sentiment already priced in? If so, why are sellers still dominant?
From a broader perspective, the overall context for crude remains bearish. However, this does not imply an immediate continuation to lower prices.
Currently, price is trading below both the midpoint of 2025 and that of 2024. Additionally, the recent price swing failed at the March 2025 low—an important technical rejection. The 2024 low at 59.91 now serves as key structural support. We anticipate further consolidation within the April 2025 value range, specifically between mCVAH (63.73) and mCVAL (58.79).
We define the area between April’s mCVPOC (60.94) and AVWAPs (61.29 / 61.76) as a "noise zone"—a region where price action is likely to be choppy and directionless. This zone is not favorable for directional trades.
Potential Trade Setup – Range-Bound Play
Example Trade 1: Long Crude Oil
• Entry: 59.91
• Stop: 59.20
• Target: 61.76
• Risk: 71 ticks
• Reward: 185 ticks
• Risk/Reward Ratio: 2.6R
Example Trade 2: Long Crude Oil
• Entry: 58.80
• Stop: 58.20
• Target: 61.76
• Risk: 60 ticks
• Reward: 296 ticks
• Risk/Reward Ratio: 4.93 R
Important Notes:
• These are example trade ideas and not financial advice or recommendations.
• Traders should conduct independent analysis and ensure proper risk management.
• Stop-loss orders are not guaranteed; slippage may occur, resulting in losses beyond predefined levels.
• AVWAP levels are accurate at the time of posting, they may vary as indicator further calculates prices with new volume and price information.
Glossary Index for all technical terms used:
ATH: All time high
VPOC: Volume Point of Control
VAL: Value Area Low
VAH: Value Area High
VP: Volume Profile
AVP: Anchored Volume Profile
C: Composite (prefix before VAL, VAH, VPOC, VP, AVP)
mC: micro-Composite (prefix before VAL, VAH, VPOC, VP, AVP)
AVWAP: Anchored Volume Weighted Average Price
Green Zones: Bull/ Buyers support zones
Red Zones: Bear/Seller resistance zones
TradeCityPro | Bitcoin Daily Analysis #77👋 Welcome to TradeCity Pro!
Let’s dive into the analysis of Bitcoin and key crypto indexes. As usual, I’ll walk you through the triggers for the New York futures session.
⏳ 1-Hour Timeframe
As you can see in the 1-hour timeframe, Bitcoin is still ranging, and volume has decreased compared to yesterday. In times like these when market volume is low, you need to pay closer attention.
✔️ Today, I’ve drawn an ascending trendline on the chart. When price performs very shallow corrections after an uptrend and each low is higher than the previous one, it indicates a very strong bullish trend. So if this trend continues, it can lead to some very attractive trade setups.
💥 As mentioned, volume is quite low today, and volatility is also lower than before. This means that most market participants are waiting to see what will happen before reacting. We should take the same approach and wait for our triggers to be activated.
📈 For a long position, it’s pretty clear that Bitcoin has a very important resistance at the 95370 level, which is currently the only long trigger. If you don’t have a position from lower levels, this is a very logical and attractive entry, and I suggest having a position ready if this level breaks.
📊 For a bearish scenario, we haven’t yet received confirmation, and we need to wait until at least the trendline is broken. After that, with the activation of a trendline trigger like the 93626 level, we can enter a short position.
👀 As I’ve said in previous analyses, I personally won’t open a short position unless Bitcoin reaches the 91945 level, as that’s my first confirmation for a trend reversal.
👑 BTC.D Analysis
Let’s check Bitcoin Dominance. The dominance range box continues, and yesterday it again moved upward from the 64.22 support and reached the range top at 64.60.
☘️ If you had opened a position on altcoins like ETH after their triggers activated yesterday, you probably hit stop-loss because of this dominance move. As dominance moved up after those triggers, capital flowed out of altcoins, causing many of them to fake out and fall back below their resistance.
📅 Total2 Analysis
Now for Total2. Just like Bitcoin, Total2 is forming a range box, but it has significantly less bullish momentum. While Bitcoin has some upward slope during its range, Total2 is completely flat and oscillating between 1.03 and 1.05.
⚡️ Triggers for Total2 remain unchanged: breakout of 1.05 for bullish confirmation and 1.03 for bearish. But just like I mentioned that I won’t act on Bitcoin’s 93626 break and will wait for 91945, here I also won’t act on a 1.03 break—I’ll wait for confirmation below 1.00.
📅 USDT.D Analysis
Let’s move to Tether Dominance. A new lower high has formed just below 5.14, and for now, I’ve adjusted the resistance level to 5.10, because as you can see, the price is reacting well to this area and we can use it as a trigger.
🧩 For a bearish USDT.D scenario (which would mean bullish for the market), breaking below 4.99 remains the key trigger. For a bullish USDT.D scenario, breaking above 5.10 would be the first confirmation of a shift in dominance upward.
❌ Disclaimer ❌
Trading futures is highly risky and dangerous. If you're not an expert, these triggers may not be suitable for you. You should first learn risk and capital management. You can also use the educational content from this channel.
Finally, these triggers reflect my personal opinions on price action, and the market may move completely against this analysis. So, do your own research before opening any position.

Bull Trap – The Real Drop May Just Be Starting! (Crash Ahead?)The market appears to be gaining bullish momentum, giving the impression that the bear market is over—but what if it’s just getting started?
On this CRYPTOCAP:TOTAL chart, the current price action seems to mirror the 2021–2022 bear market cycle: a rally to new highs, a sharp drop, a deceptive recovery (bull trap), followed by a deeper correction and eventual accumulation.
If this pattern plays out again, we could be in the bull trap phase—right before a significant and unexpected drop.
What do you think?
Will history repeat itself, or are we heading to new highs?
Drop your thoughts in the comments!
Please support this idea with a LIKE👍 if you find it useful🥳
Happy Trading💰🥳🤗

Unlock Trading Success with Multi-Timeframe MasteryIn trading, particularly in the Forex market, a well-defined strategy is crucial for consistent profitability. One of the most effective techniques used by successful traders is multi-timeframe (MTF) analysis. By examining price action across different timeframes (e.g., daily, 4-hour, 1-hour), traders gain a clearer understanding of market structure, trend direction, and optimal entry/exit points. This article explores how MTF analysis works, its benefits, and practical steps to implement it in your trading.
🔍1. Analyzing a Pair Across Multiple Timeframes for Clearer Trend Direction
The foundation of MTF analysis lies in identifying the major and minor trends. By analyzing at least two timeframes, traders can align their strategies with the broader market direction while fine-tuning entries on shorter timeframes.
⚡The High Wave Cycle (HWC) Approach
To begin, determine your High Wave Cycle (HWC), which depends on your trading strategy and timeframe. For instance:
If you trade on the daily timeframe, your HWC might be the monthly chart.
If you trade on the 1-hour timeframe, your HWC could be the weekly chart.
The HWC helps you identify the major trend. For example, on the daily chart, you might analyze the trend using Dow Theory, pinpoint key support and resistance levels, and identify trendlines or patterns. This gives you a clear picture of the market’s broader direction.
Once the HWC is defined, give it significant weight when analyzing lower timeframes for trade setups. For instance, if the daily chart (HWC) shows a downtrend, you’d prioritize bearish setups on the 1-hour chart, even if a minor uptrend appears.
Example: SOLUSDT Trade Setup
Consider a scenario where the 1-hour chart shows a strong uptrend. The price breaks a key resistance level and a descending trendline, suggesting a potential long position.
However, checking the daily chart..
(HWC) reveals a clear downtrend. According to Dow Theory, a major trend reversal requires a confirmed break above the previous high (e.g., $150). Since this hasn’t occurred, the market remains bearish.
In this case, MTF analysis guides your strategy:
Reduce position size to lower risk, as you’re trading against the major trend.
Take profits early, as the price could reverse at any moment.
Avoid overtrading by limiting the number of positions until the trend change is confirmed.
This approach ensures your trades are aligned with the bigger picture, minimizing losses from false signals.
🎯2. Spotting Entries and Exits by Confirming Trends Across Timeframes
MTF analysis not only enhances risk management but also improves the precision of your entries and exits. By confirming signals across timeframes, you can filter out noise and focus on high-probability trades.
Example: Bitcoin (May 15, 2021)
Let’s rewind to May 15, 2021, during Bitcoin’s post-bull run correction. On the daily chart (HWC), the price formed lower highs and lows, breaking a key support level, signaling a bearish trend and a potential exit for long positions. This indicates that spot traders should sell, and swing traders on lower timeframes should focus exclusively on short positions.
On the 1-hour chart, you might spot a minor pullback, tempting a long trade. However, MTF analysis reminds you to align with the daily downtrend, so you’d only consider short setups. This disciplined approach prevents you from trading against the major trend, improving your win rate.
📊The Medium Wave Cycle (MWC) for Added Clarity
Between the HWC and lower timeframes lies the Medium Wave Cycle (MWC), which provides an intermediate perspective. For example, if your HWC is the daily chart, the MWC might be the 4-hour chart. The MWC helps confirm the major trend’s strength or detect early signs of reversals before zooming into lower timeframes for entries. By checking the MWC, you can filter out noise and ensure your trades align with both the major and intermediate trends.
💡Conclusion
Multi-timeframe analysis is a game-changer for traders seeking consistency and precision. By combining the major trend from your HWC, the intermediate perspective from your MWC, and minor trends on lower timeframes, you can make informed decisions, manage risk effectively, and time your trades with confidence.
Start by defining your HWC and MWC, analyzing the major trend, and aligning your entries and exits with multiple timeframes. Pick a pair, test this strategy on a demo account, and share your results in the comments below! With practice, MTF analysis will give you a tactical edge in navigating the markets.
🤍 btw im Skeptic :) & If you found this article helpful, don’t forget to like, share, and follow for more insights and trading strategies! <3

bitcoin road map !!!Chart is speaking itself...
Give me some energy !!
✨We spend hours finding potential opportunities and writing useful ideas, we would be happy if you support us.
Best regards CobraVanguard.💚
_ _ _ _ __ _ _ _ _ _ _ _ _ _ _ _ _ _ _ _ _ _ _ _ _ _ _ _ _ _ _ _
✅Thank you, and for more ideas, hit ❤️Like❤️ and 🌟Follow🌟!
⚠️Things can change...
The markets are always changing and even with all these signals, the market changes tend to be strong and fast!!

TradeCityPro | QNT: Ranging Near Key Resistance in RWA Favorite👋 Welcome to TradeCity Pro!
In this analysis, I want to review the QNT coin for you. This project is one of the RWA projects that has been heavily hyped in recent months.
✔️ Currently, this coin has a market cap of $908 million and ranks 72 on CoinMarketCap.
⏳ 4-Hour Timeframe
On the 4-hour timeframe, as you can see, there is an upward trend along with a curved trendline that has caused the price to move from the bottom of 59.9 to 76.8.
💫 After the price reached the resistance at 76.8, a ranging box has formed, and volume has also been decreasing. A temporary support bottom has formed at the 73.8 area, and the price is ranging between these levels.
📊 Now, with the ranging box that has formed, the price has reached the curved trendline, and this trendline can potentially lead to bullish momentum entering the market.
💥 On the other hand, the RSI oscillator is also on important support at the 50 level, and if the price is supported by this trendline, the RSI moves upward again, and volume increases, we can enter a long position with the breakout of 76.8.
🔍 An important point about this entry is that there is a very strong resistance at the 80.1 area, and if you enter a position on the breakout of 76.8, you probably won't see much profit until the price reaches 80.1.
🎲 So basically, the 76.8 trigger is a preliminary trigger for the breakout of 80.1, and if I open a position on the breakout of 76.8, I won’t close it at 80.1 and will wait to see if the price breaks through the 80.1 area or not. In my opinion, this position is worth the risk because if 80.1 breaks, a very large reward could result from this position.
🔽 But if you want to take less risk, you can wait and open your position with the breakout of 80.1 itself. Naturally, since this area is a major resistance and the entry point is higher than 76.8, opening a position at that level will be harder and the likelihood of getting a proper confirmation candle is lower than with 76.8.
📉 For a short position, if we want to get a trigger from the chart itself, considering the decreasing volume and price reaching the curved trendline, if this trendline breaks and the 73.8 trigger is activated, we can enter a position. RSI confirmation would also be the break of the 50 area, and with that break, we could also get momentum confirmation.
🔑 But the point is that we must also consider market conditions. For example, in the current market conditions, the overall trend of Bitcoin and indexes like Total and Total2 has been bullish in recent weeks, and we can’t get bearish confirmation from these indexes.
✨ So it's possible that with the break of 73.8, the price moves downward, but because the indexes I mentioned also affect altcoins, with the continuation of their bullish trend, the downtrend of QNT may come to an end and its trigger may become a fakeout. That's why it’s better to wait for Bitcoin and the indexes to confirm a trend reversal before looking for short triggers.
📝 Final Thoughts
This analysis reflects our opinions and is not financial advice.
Share your thoughts in the comments, and don’t forget to share this analysis with your friends! ❤️

Do you think I'm joking ???I might be wrong and this might never happen, but it might come true From a technical perspective!!!
Give me some energy !!
✨We spend hours finding potential opportunities and writing useful ideas, we would be happy if you support us.
Best regards CobraVanguard.💚
_ _ _ _ __ _ _ _ _ _ _ _ _ _ _ _ _ _ _ _ _ _ _ _ _ _ _ _ _ _ _ _
✅Thank you, and for more ideas, hit ❤️Like❤️ and 🌟Follow🌟!
⚠️Things can change...
The markets are always changing and even with all these signals, the market changes tend to be strong and fast!!
Rocket Booster + MACD System 20 .Min-DemoOne thing that i am good at is buying bitcoin.
It took me a year to master how to buy Bitcoin,
thanks to a trading competition.
This trading competition was on
Tradingview in 2024, and i ended up being
in the top 10% of traders worldwide
on tradingview.
The profits where calculated using
a simulation trading account.
The competition lasted for about
3 months. This means
you had to build your simulation
trading profit within 3 months.
The highest profitable trader won a prize.
Even though i did not win a prize i had profit
in that competition. This profit was
enough to put me in the top 10% of traders
worldwide, that use the tradigview platform.
It was from this simulation trading
competition that happened
in 2024 thats how i mastered
how to trade Bitcoin.
In this video i show you a system
called "Rocket Booster + MACD Strategy On 3 Time Frames"
In order to use this system effectively
or properly
you will need to subscribe to a
trading view monthly offer
that allows you to use time-frames
for quick and easy
screening of your favourite assets.
In this one we manually dive into.
SO to learn more just watch
this video demo for 20.Min.
Rocket boost this content to learn more.
Disclaimer:Trading is risky please
learn risk management
and profit taking strategies.
Also feel free to use a simulation trading
account before you trade with real money.

BTC Forming Bullish Pattern and Testing Red Resistance Zone 🚨 CRYPTOCAP:BTC Forming Bullish Pattern and Testing Red Resistance Zone 🚨
CRYPTOCAP:BTC has formed a bullish pattern and is currently testing a significant red resistance zone. A breakout above this level could confirm the bullish trend and signal further upward movement.
📈 Technical Overview:
Pattern: Bullish
Resistance Zone: Red area currently being tested.

XTZ Forming Ascending Pattern🚨 SEED_DONKEYDAN_MARKET_CAP:XTZ Forming Ascending Pattern 🚨
SEED_DONKEYDAN_MARKET_CAP:XTZ is forming an ascending pattern and is approaching a key red resistance zone. A breakout above this level could signal a strong bullish move.
📈 Technical Overview:
Pattern: Ascending
Resistance Zone: Red area currently being tested.
