TradeCityPro | MNT: Deep Dive into Mantle's Market Dynamics👋 Welcome to TradeCityPro!
In this analysis, I want to examine the coin MNT for you, which was requested in the comments. So, if you want a particular coin analyzed, feel free to mention it in the comments, and I will review and analyze it for you.
👀 Mantle project is one of the Ethereum Layer-2 projects, and its official coin is MNT. Like other Ethereum Layer-2s, its aim is to provide greater scalability, faster transactions, and lower fees. Let's proceed to technically analyze this coin.
📅 Weekly Timeframe
In the weekly timeframe, as you can see, there aren't many candles in the chart since the project is set for 2024, and it hasn’t been long since the coin was listed. As you can observe, the price is in a large range box from $0.5443 to $1.4049, hitting the bottom and top of this box several times in this timeframe.
📊 The market volume is ranging, and it seems that there hasn't been much difference in the inflows and outflows of money in this range box. The most critical trigger for buying spot right now is the breakout of $1.4049, which is the ATH resistance of this coin. If this resistance is broken, the price could move towards higher targets. If this resistance is breached, I will update the analysis for you and review the upcoming resistances and potential targets together.
✨ Besides these two important areas, there is also the $0.8946 area, which seems very important, and as you can see, the price has had many contacts with this area in the shadow in this timeframe. The main support, as mentioned, is at $0.5443, and if this area is broken, we could say that the trend of this coin will be bearish.
📉 The last support, which is also the main price floor and ATL, is $0.3197, which could be the first bearish target if this coin becomes bearish. Given the small number of weekly candles, I don't see any other specific data in this chart, so it's better to move on to the daily timeframe to see the market with more detail.
📅 Daily Timeframe
As you can see in the daily timeframe, we can examine the price movements with much more detail, and as you see, there was a box between the area of $0.5453 to $0.6533, where the ascending trend of this coin started after breaking the top of this area and continued up to the area of $1.3961.
🔍 After the price reached this area and completed its ascending leg, a new box was formed, with the bottom of this box at $0.9490 and the top, as mentioned, at $1.3961.
🔽 The price has tested the floor and ceiling of this box several times and is currently near the box's floor. Therefore, if the floor of the box breaks, we can expect further corrections, which might reach the 0.618 and 0.786 Fibonacci areas, where the 0.618 area corresponds to $0.7736, and the 0.786 area roughly overlaps with the $0.6533 support.
⚡️ In RSI, as you see, we have a very good area where the floor is 41.97, and the ceiling is 55.86. Breaking either of these areas could indicate the entry of momentum in that direction in the market.
💥 The market volume is decreasing after reaching the box's ceiling, indicating that a market movement is approaching. Therefore, you can enter a position if the ceiling or floor of the box breaks. I suggest you keep an eye on it to do so. An earlier trigger for a long would be 1.2341.
⏳ 4-Hour Timeframe
In this timeframe, I want to specify only the futures triggers for you because we have already performed the analysis in higher timeframes, and there is no need to repeat the same discussions.
🔑 For a short position, you can enter if 1.0062 breaks. I don't see a good area in RSI for a break and the entry of bearish momentum. However, the main short position, which would be if 0.9490 breaks, could overlap with a break of 30 in RSI.
📈For a long position, you can enter if 1.0685 breaks, but this position is very risky, and the main long positions would be if 1.2341 and 1.3961 break. A break of 55.86 in RSI could be a suitable confirmation for a risky long position and might overlap with the area of 1.0685.
💫 Market volume has decreased significantly in recent days. As I mentioned in the Bitcoin analyses, so be aware that, as I said, when the volume decreases and reaches its possible minimum, the market movement will be much easier, sharper, and faster.
📝 Final Thoughts
This analysis reflects our opinions and is not financial advice.
Share your thoughts in the comments, and don’t forget to share this analysis with your friends! ❤️
Tradingview
USDCAD Bearish Breakdown: Retest & Drop Incoming? USDCAD Daily Chart Analysis 📉🔥
1️⃣ Trend Breakdown:
The pair was in an uptrend but has now broken below the ascending trendline, signaling a potential bearish shift.
2️⃣ Resistance Zone (Supply Area) 🟦:
The 1.4350 - 1.4450 region acted as resistance, rejecting price strongly.
Multiple rejections in this area indicate strong selling pressure.
3️⃣ Bearish Confirmation 📉:
Price is now trading below the broken trendline.
The recent daily candle closed bearish, confirming sellers are in control.
4️⃣ Key Support Areas 🔍:
1.3957 (200 EMA) → A crucial dynamic support level.
1.3916 → Previous key level that may act as strong demand.
5️⃣ Projected Move ⬇️:
Price may retest the broken trendline (pullback).
If rejection occurs, further drop towards 1.3950 - 1.3910 is likely.
📌 Final Thought:
A bearish move is in play! Watch for a pullback to retest the broken structure before considering further shorts. If price breaks below 1.3950, expect further declines.
💭 What’s your bias? Bulls 🐂 or Bears 🐻?
TradeCityPro | Deep Search: In-Depth Of PENDLE👋 Welcome to TradeCityPro!
In this analysis, I want to fully analyze and review the Pendle project for you. First, we will read about the project's fundamentals and then perform a technical analysis.
◽️What is Pendle?
▪️Pendle is a decentralized finance (DeFi) protocol that enables the tokenization and trading of future yield. It introduces an innovative financial infrastructure that allows users to separate and trade the ownership of principal assets and their yield independently. This enables users to execute advanced yield strategies and provides more flexibility in managing yield-bearing assets.
🗝Key Components of Pendle
1. Yield Tokenization:
Pendle allows users to wrap yield-bearing tokens into SY (Standardized Yield Tokens), making them compatible with Pendle's AMM.
◽️These SY tokens are then split into two components:
▪️PT (Principal Token): Represents the principal value of the asset.
▪️YT (Yield Token): Represents the future yield generated by the asset.
This process allows for the separation of principal and yield, enabling users to trade them separately.
2. Pendle AMM (Automated Market Maker)
▪️Pendle's unique AMM is designed to support assets that experience time decay, allowing for efficient trading of PTs and YTs. Users do not need to fully understand the AMM mechanism to trade on Pendle.
3. vePENDLE Governance Model
▪️Pendle incorporates a vePENDLE model (vote-escrowed PENDLE), which enables users to participate in governance, directing incentives within the ecosystem and optimizing their yield strategies.
◽️Use Cases of Pendle
▪️Pendle's protocol enables a variety of financial strategies, including:
1) Fixed Yield Investments: Users can lock in fixed returns by selling their YT and holding PT.
2) Long Yield Positions: Users can buy YT, speculating that yields will increase.
3) Enhanced Yield Without Additional Risk: Providing liquidity in Pendle's pools can generate additional yield.
4) DeFi Yield Optimization: Combining different strategies to maximize yield opportunities.
◽️ Pendle Token Unlock and Allocation
▪️Unlocked Tokens: 283.33M PENDLE (92.14%)
▪️Locked Tokens: 24.17M PENDLE (7.86%)
◽️There are no large upcoming unlock events, but scheduled unlocks will occur gradually.
🔓Unlock Schedule
▪️From February 17, 2025, onward, small daily unlocks will take place, each unlocking around 9,750 - 9,980 PENDLE worth approximately $35,000 USD per batch.
◽️Token Allocation Breakdown
▪️Liquidity Incentives: 37%
▪️Team: 22%
▪️Private Round: 15%
▪️Ecosystem Fund (Allocated): 9%
▪️Ecosystem Fund (Unallocated): 9%
▪️Liquidity Bootstrapping Pool: 7%
▪️Advisors: 1%
▪️Vesting Schedule
◽️Team Tokens: 1-year cliff, then linear unlock over 1 year (50.98M PENDLE).
◽️Private Round: Linear unlock over 1 year after TGE (34.76M PENDLE).
◽️Ecosystem Fund: Unlocked in batches (20.86M PENDLE).
◽️Liquidity Bootstrapping Pool: 100% unlocked at TGE (16.22M PENDLE).
◽️Advisors: Linear unlock over 1 year (2.32M PENDLE).
◽️Untracked Tokens: 106.59M PENDLE (46%) – may be unlocked at any time.
◽️Pendle Wallet Compatibility
◾️Pendle is supported by various hardware, software, and extension wallets, including:
▪️Hardware Wallets: Ledger Nano X, Ledger Nano S, Trezor Model One, Trezor Model T, Ledger Stax.
▪️ Extensions: MetaMask, Enkrypt.
▪️ Software Wallets: GUARDIA, Atomic Wallet, Trust Wallet, MyCrypto.
▪️ Network Compatibility: ERC-20.
◽️Key Events & Developments
✅ Launch of Pendle Protocol – Established the foundation for yield tokenization and trading.
✅ Security Audits & Enhancements – Ongoing improvements for protocol security.
✅ Partnerships & Integrations – Expanding utility within the DeFi ecosystem.
✅ Exchange Listings – Increased accessibility and liquidity.
✅ New Pool Launches – Expanding yield opportunities.
✅ Community Growth & Governance – Active participation in decision-making.
◽️ Private Round (Ended on April 16, 2021)
▪️Funds Raised: $3.7 million
▪️Token Price: $0.1394 per PENDLE
▪️Pre-Valuation: $35 million
▪️Notable Investors: Alliance and 14 other investors
◽️Token Generation Event (TGE) & Public Listing (April 28, 2021)
▪️Price on Listing: $1.01 per PENDLE
◽️Reliable platforms for creating liquidity pools for Pendle:
▪️Uniswap
▪️Balancer
▪️Camelot
▪️LFJ
▪️Thena
▪️Pendle Finance
Reliable platforms for staking:
▪️Pendle Finance
▪️Magpiexyz
▪️Stake Dao
◽️Pendle TVL Analysis
▪️The Total Value Locked (TVL) in Pendle has shown significant growth over time, with notable fluctuations. Throughout 2024 and early 2025, the TVL followed an uptrend, peaking around mid-2024, experiencing a dip, and then recovering to new highs in early 2025.
📈 Current TVL & Percentage Change
▪️TVL on September 27, 2024: 801.26K ETH
▪️TVL on February 16, 2025: 1.91M ETH
◽️Pendle's TVL has more than doubled (+138.4%) in the last 5 months. after a temporary decline in late 2024, the platform has experienced a sharp rebound, reaching a new peak in early 2025. The TVL surge indicates higher participation and liquidity influx into Pendle, possibly driven by increased staking, new integrations, or higher user engagement in yield strategies.The TVL surge indicates higher participation and liquidity influx into Pendle, possibly driven by increased staking, new integrations, or higher user engagement in yield strategies.
◽️Analysis of On-Chain Data for Pendle
▪️The volume of Pendle tokens currently held at a loss within the price range of $3.61 to $3.71 is approximately 100 million PENDLE, indicating a significant resistance level. In contrast, the volume of tokens in profit is relatively low, suggesting that resistance is stronger than support at this stage.
▪️The volume of large transactions has exhibited a slight increase alongside price growth, signaling increased market activity. Additionally, network activity, including the number of active and new addresses, has also seen a minor uptick.
▪️Currently, 69% of all PENDLE tokens are held by whales, meaning that their movements have a substantial impact on market trends.
▪️Examining the wallet activity of large holders, we observe positive inflows, which is a bullish signal. However, network whales (addresses holding between 1 million and 100 million PENDLE) have started selling as prices increased, indicating some profit-taking behavior.
▪️Meanwhile, addresses holding less than 1 million PENDLE have increased their buying activity, contributing to sustained price growth. This suggests that retail investors and smaller holders are absorbing the supply offloaded by larger holders, helping to maintain upward momentum.
✅ Now that we have reviewed the project, let's move on to the technical analysis of this coin, which will be done in weekly, daily, and four-hour timeframes.
📅 Weekly Timeframe
In the weekly timeframe, we are observing an ascending trend that started from a base of $0.561 and continued up to a peak of $6.720, providing very good profits to its holders.
🔍 After the price reached this resistance, a ranging box formed between $2.385 and $6.720, where the bottom of the box coincides with the 0.382 Fibonacci area. This support has so far managed to support the price several times, each time sending the price back towards the top of the box.
✨ Currently, the price has hit this support with a very high volume and has formed a good supportive candle. Now we have to see if this support can again push the price upwards or if it will be broken. The RSI is also below 50, and if it sets lower highs and lows, it could continue its downward trend, bringing bearish momentum into the market.
🚀 On the other hand, if it can come back above this area 50 and stabilize, we can hope that the price will move upwards and bullish momentum will enter the market. If we want to use the Fibonacci tool for the target of this project for this move, you can see that the 1 Fibonacci area is at $31.90, which is almost 10 times more than the current market price.
📊 This means that Pendle would reach a market cap of $5 billion, making it a very successful project and placing it among the top 30 coins in the coin market cap. So if you think this project can be among the first 30 coins and have a $5 billion market cap, you can continue to hold until this target is reached.
💥 However, if the support at $2.385 breaks, the next important support areas are at the 0.618 and 0 Fibonacci levels, which overlap with $1.412 and $0.941, respectively.
📅 Daily Timeframe
In the daily timeframe, you can see the price range box with more details. As you see, in the last downward leg, the price reached $2.589 and was supported by a good candle from this area, and currently, it has reached $3.678, which is an important daily resistance. If the price can stabilize above this area, we can expect the price to move towards the top of the box again.
📈 But consider that during this upward movement that the price has had from $2.589, the volume has been decreasing, which indicates the weakness of the trend. Also, for a long position, the RSI has an important area at 52.16, which is a very important resistance, and if the break of this area overlaps with the break of $3.678, we can have a confirmation of the entry of momentum and a good position.
⚡️ the important thing is that buying volume must also enter the market, and the candle that breaks this resistance must be with good buying volume. For a short position, the situation is very clear; the support at $2.589 is a very good area, and if it overlaps with the break of 30 in the RSI, it turns into a very good trigger, and I suggest that you do not miss this position if the conditions are met.
⏳ 4-Hour Timeframe
In the four-hour timeframe, we can specify the futures trading triggers so that we can also perform futures trading with them.
🔼 For a long position, our situation is very clear. As you see in the daily timeframe, there is a very good ceiling above the price, which in the four-hour timeframe is at $3.763, and if this area breaks, we can open a risky long position. The main long position is if the break of $4.364 happens.
📉 But keep in mind that as I mentioned, the decreasing volume and the divergence with the upward trend can indicate the weakness of the upward trend. So, as a result, if the ascending trendline breaks and the trigger at $3.319 is activated, I personally try to have a short position on PENDLE.
🧩 Because the volume has a divergence with the upward trend, and if the selling volume increases after the break of this area and downward momentum enters, the price can move at least to the area of $2.2748, which is actually a very important support and will be the main trigger for short. The break of 45.48 in the RSI gives us a very good confirmation for the short position.
📝 Final Thoughts
This analysis reflects our opinions and is not financial advice.
Share your thoughts in the comments, and don’t forget to share this analysis with your friends! ❤️
XAU/USD 30-Min Analysis – Bullish Reversal & Breakout SetupGold (XAU/USD) - 30-Minute Chart Analysis 🏆📊
Key Observations:
Market Structure Shift (CHOCH - Change of Character) 🔄
The chart marks a CHOCH, signaling a potential shift from bearish to bullish momentum.
This suggests that the recent downtrend may have concluded, and buyers are stepping in.
Liquidity Grab & Stop Hunt 🎯
The price dipped below the SELL STOP level, likely triggering stop-loss orders.
A sharp rejection followed, indicating strong buying interest at lower levels.
200 EMA (Exponential Moving Average) as Dynamic Support 📈
The price tested the 200 EMA (2,885.011) and bounced off, reinforcing the bullish case.
This suggests that institutional traders might be accumulating positions near this zone.
Bullish Breakout Potential 🚀
The highlighted grey box represents a potential order block or accumulation zone.
A breakout above this area could confirm the bullish continuation towards the target level (2,942.963).
Trade Setup:
Entry Zone: Retest of the grey accumulation zone (around 2,894 - 2,899).
Stop-Loss: Below the recent low (around 2,880).
Target: 2,942.963 (previous resistance & psychological level).
Risk-Reward Ratio: ~2.5:1 (optimal for a trade execution).
Final Thoughts:
🔸 If price holds above the breakout zone, we could see a strong rally towards 2,942.
🔸 If it fails to hold and falls below 2,880, expect further downside retracement.
🔸 Bullish sentiment is favored, but confirmation is key! ✅
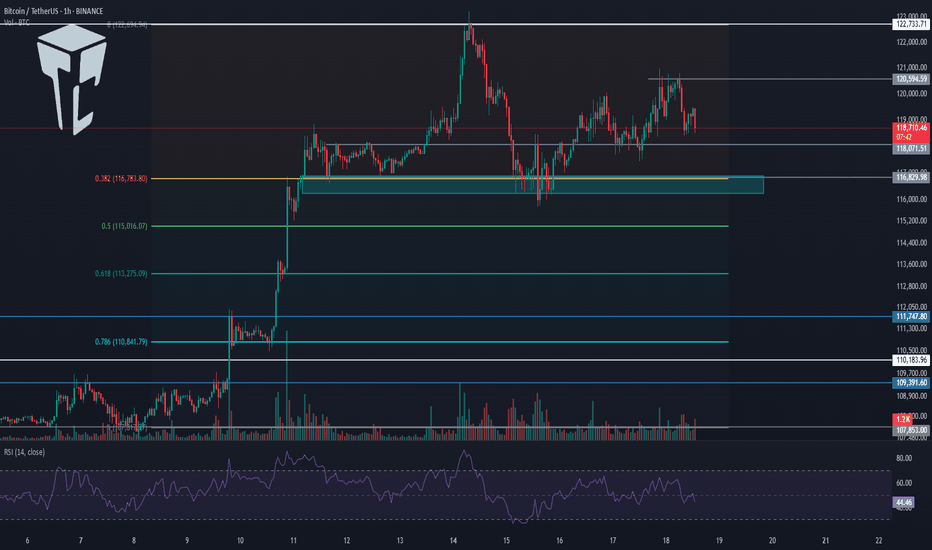
TradeCityPro | Bitcoin Daily Analysis #7👋 Welcome to TradeCityPro!
Today, we are going to review Bitcoin's futures triggers for the New York session. The market hasn't moved much since yesterday, but we have a risky trigger that might serve as a good opening for today's positions.
⏳ 1-Hour Timeframe
As mentioned, we're observing a long-term range box that started in early February, and currently, Bitcoin is oscillating within an expanding triangle. Yesterday, the price reacted strongly to this triangle, validating it as a critical zone for setting positions.
🔍 Because of this, I've added a risky long trigger at 97,816, which could precede the 98,482 trigger. This is risky because if the price is rejected at 98,482 after breaking 97,816, your stop-loss is likely to be hit. Enter this position with the understanding that you are anticipating the 98,482 break. If this resistance isn't broken, your position might not yield profits.
🔽 For shorts, the 97,110 trigger mentioned yesterday hasn't activated yet. This trigger is still valid for shorts but remember, like the long position at 97,816, it's risky and targets the range box bottom, so manage your risks carefully. The main triggers remain at 98,482 for longs and 95,108 for shorts.
📊 Market volume has decreased significantly, suggesting a sharp price movement is impending. Stay alert and ready to act on the triggers as the market will likely make a decisive move soon.
👑 BTC.D Analysis
As forecasted, if Bitcoin dominance managed to stabilize above 60.71, we expected a further upward correction and deeper pullback, which has occurred. The price broke through this area, pulling back up to 60.95 and forming a significant ceiling.
🧩 If this area is breached, we can take an early sign of a rising Bitcoin dominance, but the main trigger remains at 61.10. The best trigger for a continued downtrend is still 60.48; breaking this could herald the next bearish leg in Bitcoin dominance.
📅 Total2 Analysis
As stated yesterday, breaking 1.24 would have been a cue for a risky short position, but the price has not consolidated below this level and has twice rebounded off this support.
✨ Thus, this level has become a more critical threshold for shorts. Should this area break, it could be a good time to enter a short position, particularly if Bitcoin dominance is also rising, suggesting a potential downturn for altcoins as well.
📈 The main long position remains with the breakout at 1.28, and there are no other significant long triggers in the chart. For risky shorts, levels 1.2 and 1.19 are suitable, with the primary short trigger still at 1.16.
📅 USDT.D Analysis
As mentioned yesterday, a breakout at 4.47 could lead to increased Tether dominance, but I've adjusted this trigger to 4.48 today due to unclear price action around the former level.
🔑 This remains a high-risk trigger, and the potential for it being displaced again is considerable. Be ready to adjust this line yourself if the price near this area shows significant reaction.
⚡️ Still, a definitive bullish signal for Tether dominance will only be confirmed above 4.62, while a decisive bearish turn would be confirmed by breaking below 4.40, which has become a significant support following substantial price reactions. If this level is breached, the target will be 4.24.
❌ Disclaimer ❌
Trading futures is highly risky and dangerous. If you're not an expert, these triggers may not be suitable for you. You should first learn risk and capital management. You can also use the educational content from this channel.
Finally, these triggers reflect my personal opinions on price action, and the market may move completely against this analysis. So, do your own research before opening any position.
TradeCityPro | AVAXUSDT The Last Downtrend?👋 Welcome to TradeCityPro Channel!
Let's go together and analyze and review one of my favorite coins, which I trade a lot in futures and have a good win rate, and before that, let's remember an important point
🌐 Overview Bitcoin
Before starting the analysis, I want to remind you again that we moved the Bitcoin analysis section from the analysis section to a separate analysis at your request, so that we can discuss the status of Bitcoin in more detail every day and analyze its charts and dominances together.
This is the general analysis of Bitcoin dominance, which we promised you in the analysis to analyze separately and analyze it for you in longer time frames.
📊 Weekly Timeframe
On the weekly time frame, the avax chart is one of the best, smooth, and technical charts I've seen, and our support and resistance work beautifully. Events are somewhat recognizable.
After we were rejected from the important resistance of 53.62, which was a very important resistance from the past, the presence of sellers caused us to go into a deep correction, and on the other hand, the reason we didn't break it was because we were rejected and didn't enter the weekly overbuy.
For buying again, we are currently very bearish in the weekly and buying is not logical, but after breaking 53.82, our most reliable trigger will be to start an upward movement, and for cashing out and exiting, if we go below 21.02, I will exit myself, and if we return above this number again, I will buy again, this time with a smaller number of avax, but the same amount USDT.
📈 Daily Timeframe
In the daily timeframe, AX has had a deeper correction than other coins, and while coins like bnb, xrp, cake are at their upper support levels, AX has returned to the daily box it had previously formed
After the rejection we had from the level of 53.96, which was accompanied by a correction, it was likely that we would test this resistance again, and after the rejection we went again to break 44.21 and form a price range box.
This range box, which was in the form of a range in most altcoins, appeared in the form of a triangle in AX and caused the formation of lower lows and highs at the same level, and ultimately caused the important support of 35.02 to be broken and a pullback to it and another drop
For now, we need to form a structure to buy, and we can stay between the 22.71 to 29.10 boxes for the next few days and form a new structure for new trends. I also said sell, I will most likely exit below 19.70
⏱ 4-Hour Timeframe
We experienced a deep decline in the four-hour time frame, so much so that our RSI has reached 14, and after that and the re-entry, the price is forced and condemned to suffer, and now some of our triggers are clear
📈 Long Position Trigger
We have 2 triggers for long positions, which we can open after the 26.75 break and with the 28.47 break, and the difference between these two triggers is their riskiness, and the 28.47 level is likely to move sharply, and this 26.75 level may flatter you more!
📉 Short Position Trigger
you can open a short position when both resistance levels are faked and the trigger is 23.93. Since I feel that if we have a decline, it will be the end of the trend and we have been declining a lot so far, I suggest you save your profit quickly and exit!
📝 Final Thoughts
Stay calm, trade wisely, and let's capture the market's best opportunities!
This analysis reflects our opinions and is not financial advice.
Share your thoughts in the comments, and don’t forget to share this analysis with your friends! ❤️
TradeCityPro | Bitcoin Daily Analysis #6👋 Welcome to TradeCityPro!
Today, we're diving into Bitcoin's analysis, focusing on appropriate futures triggers for the New York session.
⏳ Hourly Time Frame
1-Hour Timeframe As mentioned in previous analyses, Bitcoin remains in a crucial range box. Yesterday, we saw a fake breakout of the expanding triangle's upper edge, but the trigger at 98,482 was not activated, and the price did not stabilize above this area but was rejected.
🔍 Currently, our long position triggers remain the same at 99,946 and 101,819. However, a new short trigger has been added. The first short trigger is at 97,110, which is considered very risky and should not hold high expectations.
🔽 If you initiate a short position upon breaking this area, your target could be 95,108. As previously discussed, the main short trigger remains at 95,108. If you open a position at this level, the target could be the bottom of the expanding triangle or the area around 92,702.
📊 The market volume continues to decrease, indicating that a sharper and more significant price movement is imminent.
👑 BTC.D Analysis
BTC.D Analysis Bitcoin dominance has broken the curve trendline, but currently, there is no significant upward momentum observed. If the price breaks and stabilizes above 60.71, we can take this as the first sign of a bullish trend. The main trigger remains at 61.10.
🧩 For a continued fall, an excellent trigger is at 60.48. If this trigger is broken, we can hope for dominance to reach 59.84.
📅 Total2 Analysis
Total2 Analysis As discussed yesterday, if the price pulls back to 1.24, we can open a long position. This scenario occurred, and many altcoins moved upward. However, as mentioned, the target for this position was relatively small because it was opened as a scalp position. The main long trigger remains at 1.28.
🔽 For those who are risk-takers, you can enter a short position if the price breaks 1.24. But be cautious, this trigger is very risky. Other risky triggers are at 1.2 and 1.19.
⚡️ The main short position remains at 1.16. Keep in mind, Bitcoin's dominance shows more signs of falling, so if you are considering opening a short position, Bitcoin might perform better than altcoins.
📅 USDT.D Analysis
USDT.D Analysis Let's look at the Tether dominance. We have an adjustment in the dominance support, which was previously at 4.44 but has been moved to 4.40 due to a strong price reaction yesterday. Currently, the main support for Tether dominance is at 4.40, and breaking this area could validate a long position.
💫 There is a very risky short trigger at 4.47, similar to the 1.24 trigger in Total2. If these two align, you might accept the risk and enter a short position with the minimum risk defined in your strategy. The target for this position is 4.62, while the target for a long position remains 4.24, which is also the main trigger for a trend change.
❌ Disclaimer ❌
Trading futures is highly risky and dangerous. If you're not an expert, these triggers may not be suitable for you. You should first learn risk and capital management. You can also use the educational content from this channel.
Finally, these triggers reflect my personal opinions on price action, and the market may move completely against this analysis. So, do your own research before opening any position.
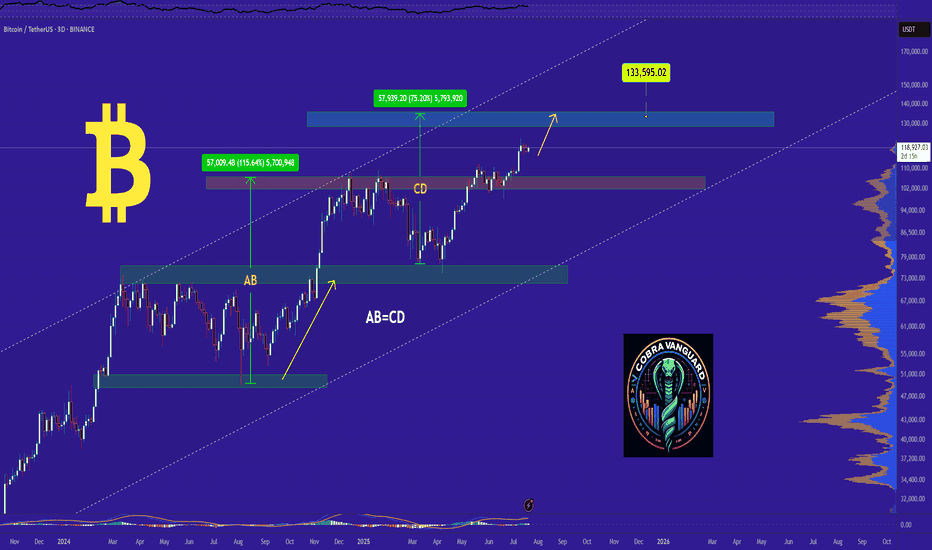
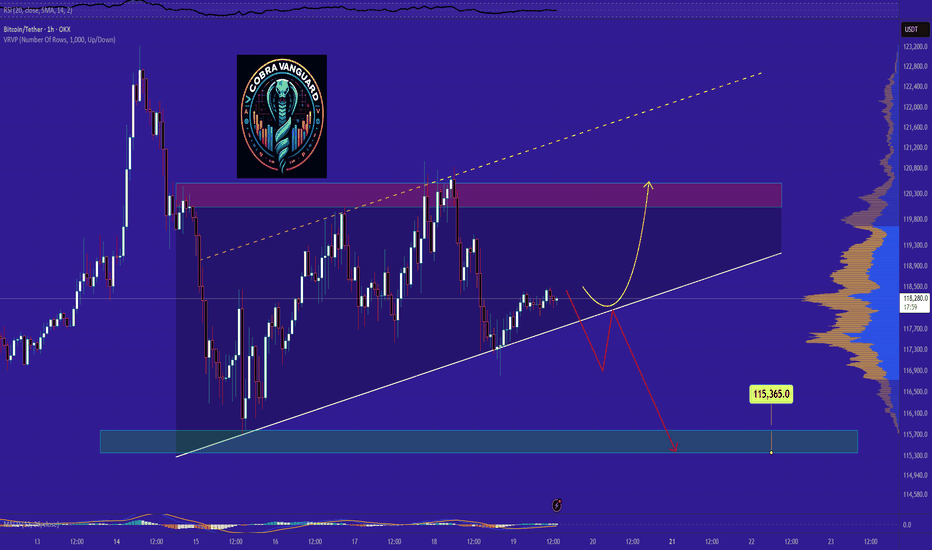
Be careful with bitcoin !!!Bitcoin is currently within a wedge, and after this pattern breaks,t can drive the price up to around $100k .
Give me some energy !!
✨We spend hours finding potential opportunities and writing useful ideas, we would be happy if you support us.
Best regards CobraVanguard.💚
_ _ _ _ __ _ _ _ _ _ _ _ _ _ _ _ _ _ _ _ _ _ _ _ _ _ _ _ _ _ _ _
✅Thank you, and for more ideas, hit ❤️Like❤️ and 🌟Follow🌟!
⚠️Things can change...
The markets are always changing and even with all these signals, the market changes tend to be strong and fast!!
TradeCityPro | ZIL: Awaits a Major Move👋 Welcome to TradeCity Pro!
In this analysis, I will be reviewing the ZIL coin, one of the Layer 1 projects primarily focused on payments.
📅 Weekly Timeframe
In the weekly timeframe, we observe a ranging box following the downtrend from the 0.01536 peak. The lower boundary of this range is at 0.01282, while the upper boundary is at 0.03472.
🔍 During Bitcoin’s last bullish move, this coin also bounced from the lower boundary and moved toward the upper boundary. However, as Bitcoin entered consolidation within its own range, this coin started to decline and has now returned to the lower boundary.
💫 If the price establishes itself below the range, we will likely see the next leg of the downtrend and a new bearish trend forming.
📊 However, if the lower boundary provides strong support and holds the price above this area, a move toward the upper boundary—and potentially a breakout—could occur.
⚡️ If the lower boundary is broken, the price target would be 0.03472, and further resistance levels at 0.06017 and 0.15361 could be tested.
📅 Daily Timeframe
In the daily timeframe, we can analyze price movements in more detail. As seen, after reaching the upper boundary of the range and getting rejected, the first bearish leg took the price down to 0.02034. Following a consolidation phase and a brief support at this level, the price broke below and completed the next bearish leg down to the lower boundary.
✨ Currently, market volume has significantly decreased, indicating that a major move is approaching. If the lower boundary is broken, the price may continue its next bearish leg downward.
🔼 For a long position, the first confirmation of a trend reversal would come after a breakout above 0.01635, though this is a high-risk trigger. The main confirmation for trend reversal currently stands at 0.02034.
💥 On the other hand, the key resistance remains at the upper boundary of the range. A breakout above this level would confirm a fully bullish trend.
📝 Final Thoughts
This analysis reflects our opinions and is not financial advice.
Share your thoughts in the comments, and don’t forget to share this analysis with your friends! ❤️
TON - Time to buy again!The price has formed a Triangle on the 4h time frame, and if it breaks out, it can drive the price up to around $4.3.
Give me some energy !!
✨We spend hours finding potential opportunities and writing useful ideas, we would be happy if you support us.
Best regards CobraVanguard.💚
_ _ _ _ __ _ _ _ _ _ _ _ _ _ _ _ _ _ _ _ _ _ _ _ _ _ _ _ _ _ _ _
✅Thank you, and for more ideas, hit ❤️Like❤️ and 🌟Follow🌟!
⚠️Things can change...
The markets are always changing and even with all these signals, the market changes tend to be strong and fast!!
Ethereum Holds Strong – $4K Target in Sight?#Ethereum has bounced off its long-term trendline support for the third time, maintaining a strong bullish structure.
Upcoming Resistance is at $2,900 and $3,250, with $4,000 as the next major target.
A sustained move above $2,900 could push ETH toward $3,250.
A breakout above $3,250 would confirm further upside. Losing trendline support may invalidate this setup.
DYOR, NFA
Bitcoin Holds Strong: $100K Breakout or Pullback Ahead?#Bitcoin Update
Bitcoin remains in a tight consolidation phase after rebounding from key support.
Support at $93,700 Holding: BTC has successfully defended the ascending trendline and 200 EMA, showing strong buyer interest around this level.
Range-bound movement: The price continues to hover between the ATH resistance and the lower support, forming a key accumulation zone.
Breakout Watch: A daily close above the $100,000 resistance could lead to a breakout, while a failure to hold support may trigger a correction.
Traders should keep an eye on BTC’s next move, as volatility could increase soon.
DYOR, NFA
#BTC #Crypto
TradeCityPro | Bitcoin Daily Analysis #5👋 Welcome to TradeCityPro!
Let's dive into today's analysis of Bitcoin. Since yesterday, there haven't been significant changes in the market, and none of our triggers were activated. However, let's explore the upcoming scenarios and identify any new triggers.
⏳ Hourly Time Frame
1-Hour Timeframe As you can see, Bitcoin is currently forming an expanding triangle, which typically doesn't respect resistances or supports very well, making it tricky to take long-term positions while the price remains within this pattern.
🔼 For a long position, the trigger remains above 98,482. Keep an eye out for this break because, as you can see, the trading volume has decreased, suggesting that a sharp price movement is likely imminent. Financial markets exist for speculation, not stagnation, so a decrease in volume usually precedes a significant price move—either upwards or downwards.
📊 Should this long trigger activate, it would be safe to hold a position expecting the price might retest the resistance at 106,000, giving us comfort in pursuing other potential coin positions.
📉 The short position has a significant level at 95,108, now more critical than the 92,702 level. If broken, Bitcoin could start its next bearish leg, with the first target at 92,702 and, upon breaking this, potentially moving towards the lower ranges around 80,000 to 82,000.
🔑 Today, I'm not focusing on the RSI due to the market's range-bound state, making it unreliable for confirming momentum. Thus, I've excluded RSI from both today's and yesterday's analyses.
👑 BTC.D Analysis
BTC.D Analysis As predicted, the dominance fell, confirming yesterday's analysis. After retesting the 61.10 level and following the trendline curve, the next leg down began, targeting the 59.84 area. This movement will help us understand the upcoming market direction based on how the dominance behaves at this level.
👀 If it proves to be a fake-out and the dominance breaks the curve again, retaking the 61.10 trigger, we might see a resurgence in Bitcoin's dominance, suggesting a bullish scenario is less likely.
📅 Total2 Analysis
Total2 Analysis As observed, the Total2 level that was previously active at 1.24 is currently retesting this area. It hasn't fully stabilized above this level, so let's wait for confirmation that this resistance has been broken. If so, we can expect a move towards at least 1.28.
✅ This break of 1.24 was an initial scalp trigger, with the main long-term trigger at 1.28. If breached, it could validate a bullish long-term position on altcoins, given the concurrent fall in Bitcoin's dominance, suggesting a preferable situation for altcoins compared to Bitcoin.
📉 In the event of market downturns, Bitcoin positions are generally more favorable if Bitcoin's dominance continues to fall. However, if considering short positions on altcoins, wait for Total2 to potentially fake this breakout and, if it reverses, enter upon breaking the 1.19 level. If you're a risk-taker, you could initiate earlier at the break of 1.19.
📅 USDT.D Analysis
USDT.D Analysis In the USDT.D index, nothing significant has changed, and for market long confirmations, the 4.44 break remains crucial. Conversely, for short positions during a market downturn, a break of 4.62 would confirm an increase in Tether's dominance.
⚡️ Note that the 4.44 trigger is risky, and a break of 4.24 is the principal confirmation of a trend change in USDT.D.
❌ Disclaimer ❌
Trading futures is highly risky and dangerous. If you're not an expert, these triggers may not be suitable for you. You should first learn risk and capital management. You can also use the educational content from this channel.
Finally, these triggers reflect my personal opinions on price action, and the market may move completely against this analysis. So, do your own research before opening any position.
Can BNB reach around $1000 ?...Currently, BNB is forming an ascending triangle, indicating a potential price increase. It is anticipated that the price could rise, aligning with the projected price movement (AB=CD).
However, it is crucial to wait for the triangle to break before taking any action.
Give me some energy !!
✨We spend hours finding potential opportunities and writing useful ideas, we would be happy if you support us.
Best regards CobraVanguard.💚
_ _ _ _ __ _ _ _ _ _ _ _ _ _ _ _ _ _ _ _ _ _ _ _ _ _ _ _ _ _ _ _
✅Thank you, and for more ideas, hit ❤️Like❤️ and 🌟Follow🌟!
⚠️Things can change...
The markets are always changing and even with all these signals, the market changes tend to be strong and fast!!
TradeCityPro | COMP: Navigating Consolidation👋 Welcome to TradeCityPro!
Today, I'll be analyzing the COMP token, a core component of a well-known DeFi project specializing in lending and borrowing, currently ranked 200th with a market cap of $100 million.
📅 Weekly Timeframe
In the weekly timeframe, we see a bearish trend that later transitioned into a consolidation box, with the current box's floor at $30.96 and the ceiling at $90.56. After the price was rejected from the all-time high of $800 and fell to $30.96, trading volume was initially high, affirming the downtrend.
🧩 However, after forming this box between the two levels, the volume decreased, indicating that whales and market makers have likely withdrawn their investments from this coin for now.
🔍 The primary support, as mentioned, is at $30.96, and if this level breaks, the downtrend is expected to continue. As observed, the price previously rose to the resistance at $90.56 and broke it, but then returned to the box, making this move a fake breakout.
📊 Currently, an important floor in the weekly timeframe is observed at $40.38, which is a good support. A break below this area could introduce significant bearish momentum and panic into the market. Additionally, the RSI indicator shows important support at 37.89, which, if broken alongside the $40.38 area, could early confirm a further bearish leg.
🔼 On the flip side, if the price is supported above this level and moves towards $90.56, breaking this area could enable us to hit the targets set for this coin. As shown in the chart, significant resistances are located at $252.60 and $800. However, for the coin to reach these figures, significant market cap growth is necessary.
📝 Final Thoughts
This analysis reflects our opinions and is not financial advice.
Share your thoughts in the comments, and don’t forget to share this analysis with your friends! ❤️
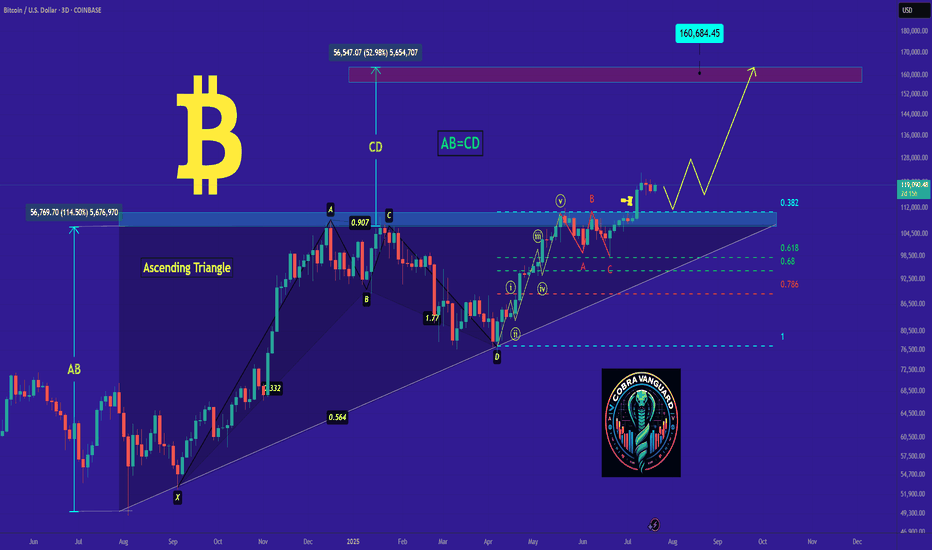
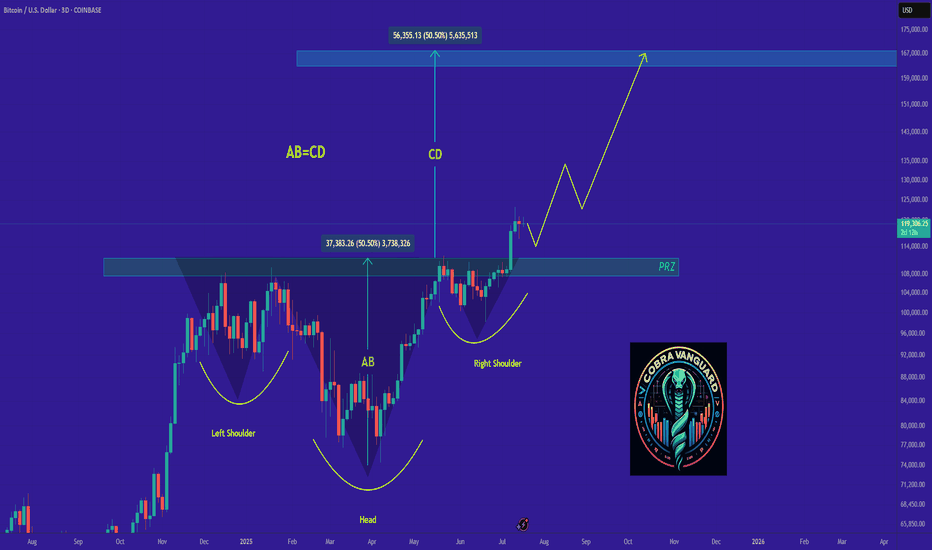
I don't know why ???Now that most people are disappointed with the crypto market, it's time for growth to begin again. Just like in 2022, this drop was natural to shift funds from meme coins to more useful projects in the crypto market.I Expect Bitcoin to reach $123K.
Give me some energy !!
✨We spend hours finding potential opportunities and writing useful ideas, we would be happy if you support us.
Best regards CobraVanguard.💚
_ _ _ _ __ _ _ _ _ _ _ _ _ _ _ _ _ _ _ _ _ _ _ _ _ _ _ _ _ _ _ _
✅Thank you, and for more ideas, hit ❤️Like❤️ and 🌟Follow🌟!
❗Disclaimer
⚠️Things can change...
The markets are always changing and even with all these signals, the market changes tend to be strong and fast!!
GOLD - at support? holds or not??#GOLD. market just near to his current supporting region that is around 2909-10 to 2914-15
that region is most important for now and if market hold it in that only case we can see bounce again. otherwise not,.
Note: 2908-09 is the final area for now and we will go for cut n reverse below that.
good luck
trade wisely
Forex: Why and How to Use TradingView
Dear readers, I am Trader Andrea Russo and today I want to talk to you about the reason why I use TradingView.
The Forex (Foreign Exchange) market is one of the largest and most dynamic in the world, with over 6 trillion dollars traded every day.
TradingView is one of the most popular platforms for technical analysis and chart viewing, particularly appreciated by Forex traders. In this guide, we will explore how to use TradingView to trade Forex, taking advantage of the tools and features offered by the platform.
What is TradingView?
TradingView is a technical analysis platform that offers advanced charts, drawing tools, customizable indicators, and an active community of traders. Among its main features:
Real-time charts on any timeframe, from 1 minute to daily or weekly.
Technical indicators such as RSI, MACD, moving averages, and much more.
Social trading to share ideas with other traders and learn from their analysis.
Drawing tools to plot trends, channels, and Fibonacci.
With its user-friendly interface, TradingView is ideal for beginner traders and those looking for advanced analysis.
How to Trade Forex with TradingView
1. Choose a Currency Pair
The first step to start trading Forex is to choose a currency pair to analyze, such as EUR/USD or GBP/JPY. Each pair represents the value relationship between two currencies. For example, in the case of EUR/USD, the base currency is the Euro and the counter currency is the US Dollar.
2. Use Charts
TradingView offers several views:
Candlestick Chart: Shows price movements in specific time frames. It is the most used chart in Forex.
Line Chart: Shows only closing prices, useful for observing general trends.
Bar Chart: Shows the open, close, high and low for each period.
These visualizations help you better understand the market trend.
3. Set Indicators
Indicators are essential tools in technical trading. On TradingView, you can use:
RSI (Relative Strength Index): Shows whether a currency pair is overbought or oversold (levels above 70 indicate overbought, below 30 oversold).
MACD (Moving Average Convergence Divergence): Provides trend reversal signals and can be used to confirm the market direction.
Moving Averages (MA): Helps identify the market direction and filter trading signals.
4. Customize Drawing Tools
TradingView offers powerful drawing tools such as:
Trend Lines: To plot support and resistance levels.
Fibonacci Retracement: To identify key price reversal levels.
Channels: To analyze price movements within a defined range.
These tools allow you to precisely track market entry and exit points.
5. Create Alerts
TradingView allows you to set custom alerts. You can receive notifications via email or directly on the platform when the price reaches certain levels. This is particularly useful for not missing important trading opportunities.
Forex Trading Strategies
1. Trend Trading
One of the most common strategies is trend following. When the market is in an uptrend (bullish trend), buy; when it is in a downtrend (bearish trend), sell. Use moving averages or the MACD indicator to identify the direction of the trend.
2. Retracement Trading
Retracements are corrective movements within a trend. You can use Fibonacci Retracement to identify support and resistance levels, and wait for the price to retrace before entering the market in the direction of the main trend.
3. Scalping
Scalping is a short-term strategy that aims to make small profits from rapid price movements. Use short timeframes (for example 1 minute or 5 minutes) and take advantage of spikes in volatility.
4. Breakout Trading
Breakout trading is based on breaking key support or resistance levels. When the price breaks these levels, a strong move in one direction is expected. Indicators such as ATR (Average True Range) help you monitor volatility and choose the right times to enter the market.
Forex Trading Tips
Risk Management: Forex is a highly leveraged market, so protecting your capital is key. Use stop losses and take profits to limit losses and protect gains.
Conclusions
TradingView is an excellent tool for Forex trading, thanks to its wide range of advanced features, ease of use and the ability to analyze charts accurately.
Daily Market Outlook: BTC & Forex Setups (#3) | CPI ImpactBefore jumping into today’s analysis, let’s quickly revisit yesterday’s key event – the CPI report. As expected, it triggered a major sell-off in both crypto and stock markets.
📌 BTC Daily – Bulls Still Holding the Line?
Despite the heavy selling pressure and low volume, BTC managed to close above the $95K support level yesterday.
📊 Key Observations:
Sellers dominated, but buyers are still holding ground within this daily range.
No confirmed breakdown below $95K, so yesterday’s short scenario is invalidated.
Market remains extremely volatile, making clean trade setups difficult.
📌 Plan: Sitting out of crypto today until we get a clearer structure.
📊 DXY – Time-Based Correction or Breakdown Incoming?
The Dollar Index (DXY) is currently in a time-based correction and testing a key support at 107.372.
📊 Potential Scenarios:
✅ If support holds, we might see DXY push higher, adding pressure to risk assets.
❌ If it breaks down, expect further declines toward 105.692 and possibly 103.451 (Fib levels).
📌 Bias: Short-term bearish, but cautious due to the overall uptrend.
📉 USD/JPY – Short Setup in Play?
USD/JPY has completed its corrective phase within a major downtrend and seems to be resuming its bearish momentum.
📊 Key Trade Setup:
🔹 Short Entry: 153.391 (if triggered)
🔹 Take-Profit Zone: 152.473 support
If momentum continues, this could be a clean short opportunity.
Final Thoughts & Risk Management
⚠ Market is still choppy—wait for clear confirmations before entering trades.
⚠ FOMO is your worst enemy, risk management is your best friend.
💬 I’m Skeptic, and I’ll see you tomorrow with another market breakdown! 🤍
⚠ Disclaimer: These trade setups are based on my personal analysis and are not financial advice. If you don’t have a solid risk management plan, these triggers may not be suitable for you. Always do your own research (DYOR) and trade at your own risk. 💡