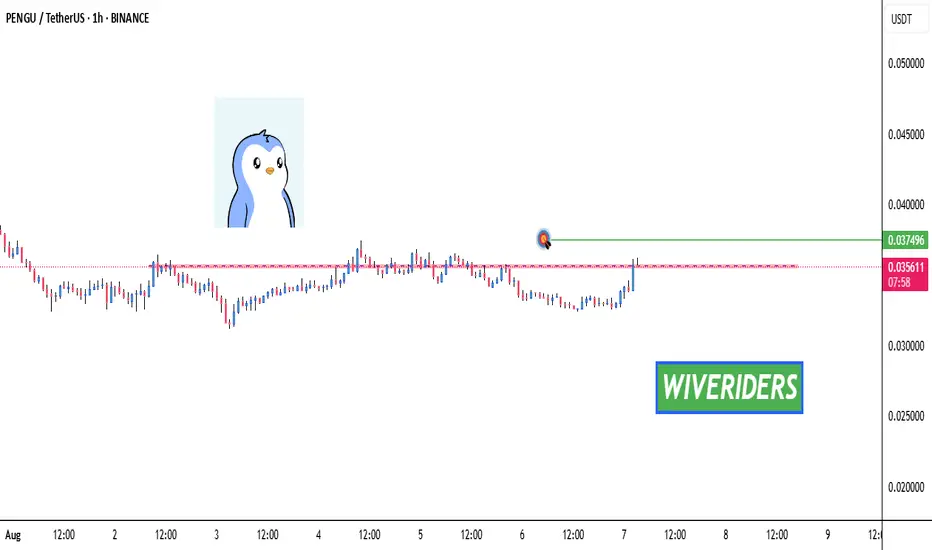
PENGU Breakout Watch – Red Resistance Being Tested! CSECY:PENGU Breakout Watch – Red Resistance Being Tested! 🔴⏳
CSECY:PENGU is testing the red resistance zone.
📊 If breakout confirms, next move could target:
🎯 First Target → Green line levels
A confirmed breakout may signal bullish momentum and continuation higher.
Tradingview
TradeCityPro | Bitcoin Daily Analysis #146👋 Welcome to TradeCity Pro!
Let’s dive into Bitcoin analysis. In this analysis, I want to take a look at the higher timeframes since conditions in the lower timeframes haven't changed much compared to yesterday, and it’s a good idea to review the broader picture.
📅 Daily Timeframe
In this timeframe, after the completion of the previous corrective leg that extended to the 78,000 zone, Bitcoin started a new uptrend and has managed to climb up to the 122,000 area.
💥 The most important resistance during this move was 110,183, which, as you can see, has been broken, and Bitcoin is still holding above this level.
✔️ The curved trendline we've drawn in the higher timeframes has been broken in this timeframe, but in my view, confirmation of this trendline break comes only after the 110,183 level is broken again to the downside.
⚡️ Currently, the RSI oscillator is sitting on a support level around 38.21. This area is a very important momentum zone for Bitcoin, and if it breaks, the likelihood of downward momentum entering the market increases.
🧩 However, we still need more confirmations for a bearish scenario, and breaking this level on the RSI alone does not confirm a trend reversal.
🔽 If the correction continues, the main support we currently have is at 110,183. The SMA99 also acts as a dynamic support and, if it overlaps with 110,183, will form a very strong PRZ (Potential Reversal Zone).
📈 If the uptrend wants to resume from here, the first trigger confirming trend continuation is the 120,000 high — and breaking the range between 120,000 and 122,000 will start the next bullish leg.
❌ Disclaimer ❌
Trading futures is highly risky and dangerous. If you're not an expert, these triggers may not be suitable for you. You should first learn risk and capital management. You can also use the educational content from this channel.
Finally, these triggers reflect my personal opinions on price action, and the market may move completely against this analysis. So, do your own research before opening any position.

ZETA: when a wedge isn’t just a wedge — it’s a launchpadTechnically, this setup is textbook clean. Price completed the fifth wave within a falling wedge and instantly reacted with a bullish breakout. The expected breakdown didn’t happen — instead, buyers stepped in, confirmed by rising volume. All EMAs are compressed at the bottom of the structure, signaling a clear shift in momentum. The volume profile shows strong accumulation around $14, while the area above current levels is a vacuum — ideal conditions for acceleration.
The key resistance zone is $16.70–17.20 — former base highs and the 0.236 Fibonacci retracement. If price breaks this area with volume, the next stop is likely $24.48 (0.5 Fibo). Classical wedge targets land at $38.28 and $55.33 (1.272 and 1.618 extensions). If a trending leg begins, it could move fast — because there’s simply no supply overhead.
Fundamentals:
ZETA isn’t a profitable company yet, but it shows consistent revenue growth and aggressive expansion. Capitalization is rising, debt is manageable, and institutional interest has increased over recent quarters. In an environment where tech and AI are regaining momentum, ZETA could be a speculative second-tier breakout candidate.
Tactical plan:
— Entry: market or after a retest of $14.00–14.30
— First target: $17.20
— Main target: $24.48
— Continuation: $38.28+
— Stop: below $13.00 (bottom wedge boundary)
When the market prints a wedge like this and the crowd ignores it — that’s often the best trap setup. Only this time, it’s not for retail buyers. It’s for the shorts. Because when a falling wedge breaks to the upside with volume — it’s time to buckle up.

BTC 1H Analysis – Key Triggers Ahead | Day 3💀 Hey , how's it going ? Come over here — Satoshi got something for you !
⏰ We’re analyzing BTC on the 1-hour timeframe .
⏱ We’re analyzing Bitcoin on the 1-hour timeframe.
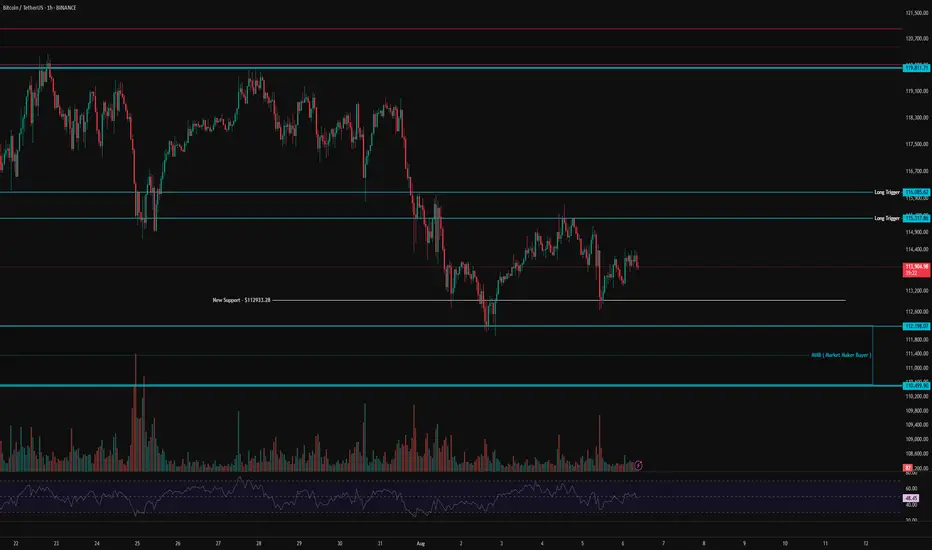
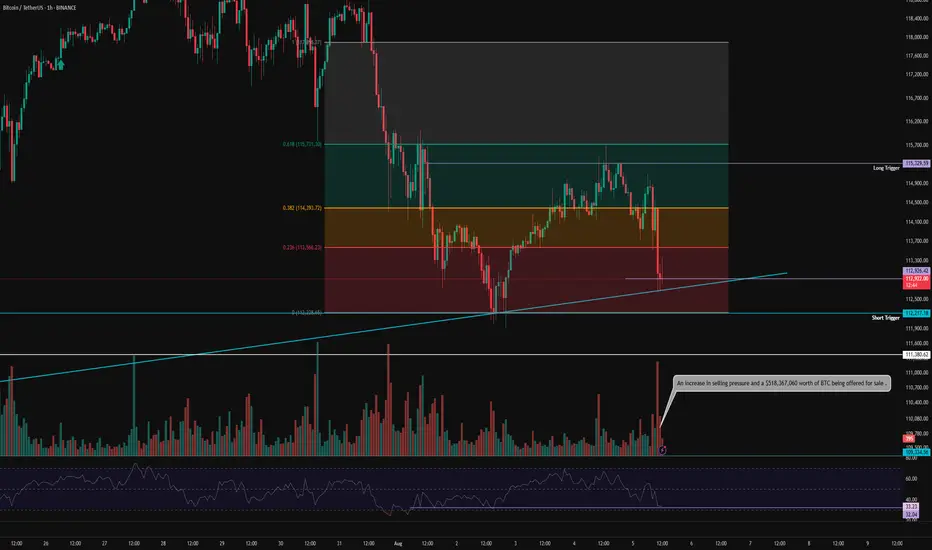
👀 After bouncing from the current $113,000 area, Bitcoin moved upward, indicating the presence of market maker buyers in this zone. A short-term support has formed at $113,000, and yesterday we saw a strong rejection from this level, which helped prevent further selling pressure.
Bitcoin now faces a resistance zone and a potential long entry trigger between $115,317 and $116,085. If long positions increase and short positions get squeezed, this resistance could be broken, potentially fueling a bullish move.
⚙️ On the RSI, our key level is the 50 range. A confirmed hold above this level could signal a higher low forming relative to the previous bottom at $112,933.
🕯 We’re seeing an increase in trading volume, and as the price moves closer to $110,499, there's a noticeable liquidity pull from long positions—more buyers are stepping in around this area.
📈 Our long position trigger lies within the resistance zone mentioned. A confirmed breakout and hold above this level, alongside RSI entering Overbought across multiple timeframes and volume expansion, would give us a solid entry for a long position.
📉 Our short position trigger is below $112,200. A sharp drop with strong selling pressure and RSI entering Oversold would justify a short entry—though I do not recommend taking this trade.
❤️ Disclaimer : This analysis is purely based on my personal opinion and I only trade if the stated triggers are activated .
Crude Oil: Equilibrium, Key Levels & Trade ScenariosNYMEX:CL1! NYMEX:MCL1!
Market Recap
In our prior crude oil commentary, we identified a bullish flag formation with key support anchored at the Q3 micro composite Value Area Low. Following a measured pullback, prices decisively reclaimed the Q3 micro composite Value Area High, subsequently advancing toward the $70 level. However, this upward momentum proved unsustainable, with prices unable to maintain higher ground. We have since retraced to the yearly open, where the market is now consolidating.
Current Market Structure
Crude oil is presently exhibiting a balanced profile. Notably, the composite Volume Points of Control (VPOC) for both the yearly and quarterly profiles are overlapping — a technical signal indicative of equilibrium in positioning.
Market Performance Assessment
Price action in recent sessions has been heavily influenced by shifts in the global demand outlook, which in turn remain sensitive to macroeconomic expectations, geopolitical events, and OPEC+ V8 members’ gradual unwinding of voluntary production cuts. Despite the prevailing headwinds — including tariff disputes, Russian sanctions, and broader trade tensions — crude oil has demonstrated resilience, consistently trading above the $65 threshold.
Forward Outlook
Attention will turn to today’s EIA release at 9:30 a.m. CT, which may serve as the primary catalyst for near-term directional bias.
Key Technical Levels
• Q3 mCVAH: 67.28
• Neutral Zone: 66.45 – 66.30
• Yearly Open: 66.34
• Intermediate Support: 65.80
• CVPOC / mCVPOC: 65.54
• Q3 mCVAL: 64.95
• Support Zone: 65.00 – 64.80
Trading Scenarios
• Scenario 1 — Yearly Open Rejection
Monitor the Yearly Open (66.34) as an initial resistance level. A rejection here could prompt a tactical pullback toward the Line in the Sand (LIS), offering long entry opportunities with a target above the yearly open.
• Scenario 2 — DOE-Driven Flush & Recovery
Should the DOE data trigger a downside push, watch for a swing failure at recent lows. A close back above prior levels would present a potential long setup, with conviction increasing on sustained price action above 65.80.

Pennant — Trend Is Your Best Friend 🚩 Pennant — Trend Is Your Best Friend 📈
drive.google.com
🔍 Introduction
The Pennant is a trend continuation pattern, resembling a small triangle that forms after a strong initial move (known as the “flagpole”). It is similar to the Flag pattern, but with one key difference: the body of the Pennant is formed by two converging trendlines, rather than parallel ones.
📐 Pattern Description
The Pennant forms after a strong, impulsive price move, indicating that the trend is likely to continue after a short pause.
Like the Flag, the Pennant consists of two main components:
The flagpole — a sharp, directional move (either bullish or bearish)
The Pennant body — a brief consolidation shaped like a symmetrical triangle 🔺
🟢 A bullish pennant forms after a strong upward move
🔴 A bearish pennant follows a strong downward move
🧠 Market psychology behind the pattern:
After a big move, many traders expect a reversal and begin taking counter-trend positions. But when the breakout occurs in the direction of the original trend, it triggers a wave of new orders, pushing price even further. That’s why the Pennant is often used to enter trades in the direction of the dominant trend.
📉 Volume behavior is also key:
High volume during the initial move
Low volume during the Pennant’s consolidation
Rising volume on the breakout
This volume pattern reflects renewed trader interest and often leads to a more explosive breakout compared to a Flag, due to the tightening nature of the consolidation.
⚠️ A weak or sloppy move before the Pennant weakens the signal and increases the risk of false breakouts.
🎯 Entry & Stop-Loss Strategy
📥 Entry: After a confirmed breakout above the Pennant’s resistance (or below it for bearish setups)
🛑 Stop-loss: Placed just below the last local low before breakout
💰 Profit Target:
Partial take profit at the top of the flagpole
Full target = the height of the flagpole projected from the breakout point (aka the Measured Move)
Always account for key support/resistance levels to define the potential range
💡 The Pennant often offers great risk/reward due to its tight structure and explosive potential.
💡 My Pro Tips for Trading Pennants
✅ Pennant Pattern Criteria
Trend continuation pattern
A strong, nearly vertical move preceding the Pennant
Triangle-shaped consolidation (two converging lines)
The Pennant body must be shorter than the flagpole
The lowest point of the Pennant should not exceed half the length of the flagpole
Breakouts should happen in the direction of the initial trend
Tight range before breakout increases accuracy
📈 What Strengthens the Signal
Sharp, clean, directional initial move (strong flagpole) ⚡
High volume on the initial move, and volume surge on breakout 💥
⚠️ What Weakens the Signal
Choppy or weak price action before the Pennant 🫤
Lack of volume during the flagpole or breakout 💤
✅ Examples of My Winning Pennant Setups
🔗 EURUSD Bearish Pennant — Ready to Drop
❌ Examples of My Losing Setups
🔗 XAUUSD Bullish Pennant — Failed Follow-through
💬 Do You Trade Pennants?
They’re one of the most powerful continuation patterns when paired with clean price action and volume confirmation. What’s your experience with Pennants? Share your wins — and fails — below 👇👇

XRP - FUTURES SIGNALXRP - FUTURES SIGNAL
Coin: XRP
Direction: LONG
🟢Input range: market
✔️ТР: 3.0088/3.0580/3.1047
❌SL: 2.8975
We open a long trade according to the trend, after reaching a correction of 0.5 according to Fibonacci

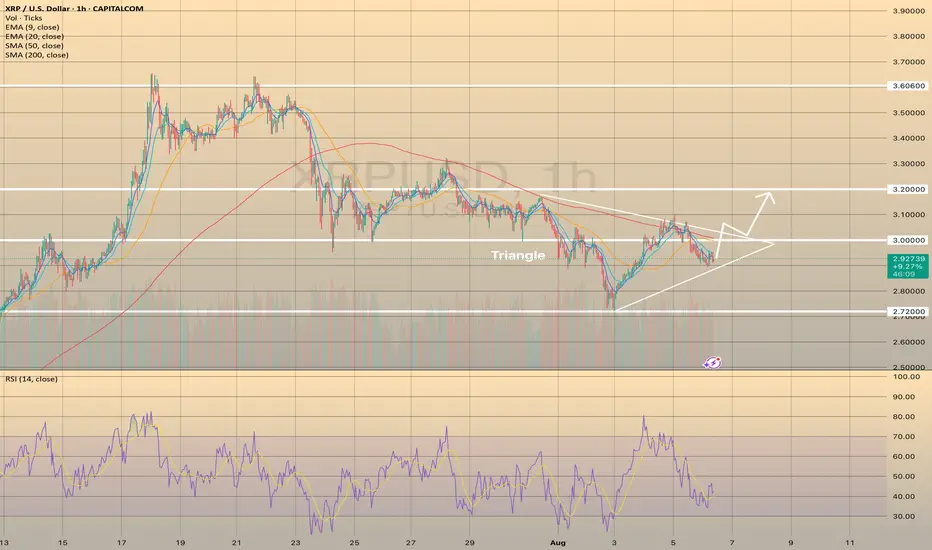
XRPUSD formed the Triangle pattern. The price may increase.XRPUSD formed the Triangle pattern. The price may increase.
XRPUSD has been declining since July 23, reaching the lowest mark at 2.72000 on August 3. Since then the price started to form the triangle pattern. It is not a reversal chart pattern, however, RSI indicator started to show some strength of the bullish momentum. In this case, if the price breaks through the SMA200 on hourly chart and holds above it and the level of 3.00000, the following rise towards 3.20000 is expected.
BTCUSD manages to hold the lower border of the – Rebound LikelyBTCUSD manages to hold the lower border of the descending channel, ready to rebound.
BTCUSD broke below 116,000.00 support level on August 1 and declined towards 112,000.00 support level. Afterwards, the asset successfully rebounded from it. Although, we noticed 2 false breakouts of the channel, in general the asset tries hold itself within the descending channel, still showing us the strength of this formation.
Here, the rebound towards 118,000.00 level is expected with intermediate consolidation slightly above the 116,000.00. In the long term, the asset still moves within the descending channel, so no new long-term bullish momentum is expected.

ETHUSD holds 3,550.00 support level and continues to grow.ETHUSD holds 3,550.00 support level and continues to grow.
Since August 1 the asset has been trading below the support level of 3,550.00. On Monday the asset broke through this level from below, establishing the false breakout of this level. A false breakout is when an asset’s price pops past a major support or resistance line but then flips back fast, not sticking with the move. It tricks traders into thinking a big trend’s kicking off, only to burn them when the price slides back to where it was.
On August 6 ETHUSD has successfully rebounded from the 3,550.00 support level and is currently developing short-term bullish momentum. The price is expected to grow towards 3,800.00 and 4,000.00 as a final target.

GBPUSD 4H: retest done - bearish continuation beginsOn the 4H chart, GBPUSD has completed a textbook head and shoulders pattern. The neckline has already been broken, and the price is now finalizing a retest around 1.3365–1.3380, where the 0.5 Fibo level also lies. This confirms a trend reversal, with the market preparing for the next leg down.
MA and EMA are above the current price, adding pressure to the downside. RSI remains neutral, and volume is shifting in favor of bears. The key resistance zone at 1.3365 has been tested from below, and the price is beginning to roll over - a classic bearish continuation signal.
Targets: 1.3240 first, then 1.3150 and potentially 1.2 870 if momentum builds. The invalidation point is a close above 1.3365, which is not likely at this stage.
Fundamentals support the move: the dollar remains strong as the Fed holds its hawkish stance, while the UK economy continues to show weakness across services and manufacturing.
Neckline broken ✅
Retest done ✅
Momentum building ✅
The setup is complete — time to follow the structure.

BTC 1H Analysis – Key Triggers Ahead | Day 2💀 Hey , how's it going ? Come over here — Satoshi got something for you !
⏰ We’re analyzing BTC on the 1-hour timeframe .
👀 After the strengthening of the US dollar , Bitcoin experienced a drop and formed a short-term support bottom around the $113,000 level . It is currently completing a pullback to the levels of this recent decline .
🎮 Our Fibonacci retracement is drawn from the breakout zone to the $112,200 bottom . Bitcoin broke below the 0.236 level and then found support . The best potential entry trigger, based on Fibonacci, is at the 0.382 level, or around $115,000 . If Bitcoin breaks above this level , it could form a higher high and a higher low in this timeframe .
⚙️ The RSI is showing a support level around 32 , which is currently preventing Bitcoin from entering the oversold zone . However , if this support is lost , Bitcoin could move into oversold territory .
📈 Our long position trigger is at the 0.382 Fibonacci level . A confirmed breakout of this level , combined with RSI overbuying and increased volume , would be our entry signal .
📉 Our short position trigger is around $113,000 . If this support breaks , we may open a short position . However, the main short trigger is at the 0 Fibonacci level ( support at $112,200 ) . If selling pressure increases and RSI enters the oversold zone , we will consider entering a short position with confirmation .
❤️ Disclaimer : This analysis is purely based on my personal opinion and I only trade if the stated triggers are activated .
TradeCityPro | Bitcoin Daily Analysis #145👋 Welcome to TradeCity Pro!
Let’s get into Bitcoin analysis. Yesterday, Bitcoin was rejected from the zone I had mentioned, and today it will probably begin its new downward move.
⏳ 4-Hour Timeframe
In yesterday’s analysis, I told you that a pullback to SMA25 and the 0.5 Fibonacci zone was possible. That happened, and now, given the current candle, the probability of a corrective scenario has increased.
✔️ I still won’t open any position on Bitcoin and am waiting for it to exit the box between 110000 and 116000. But if certain conditions occur in the market, I might open a position inside this box as well.
✨ First of all, Bitcoin is still above the 111747 support, which is a very important support zone. As the price reaches it, there’s a chance it gets stuck there again.
📊 On the other hand, seller strength is very high, and as you can see, the RSI has been rejected from the 50 ceiling, and a red engulfing candle with very high volume is forming — all of which indicate the power of sellers.
🔽 I still stand by my opinion that as long as the price is above 110000, I won’t open a short position. But for a long position, we can move to the 1-Hour timeframe to review the trigger that has formed.
⏳ 1-Hour Timeframe
Before reviewing the triggers, there’s a very important point that explains why I currently prefer to remain without a position.
💫 Bitcoin in the HWC and MWC cycles has a very strong upward trend. Right now, in the LWC, it’s moving downward. So this Fibonacci drawn on the bearish leg doesn’t really mean much and won’t give us very strong and accurate resistances.
🔍 On the other hand, the LWC is moving against the higher cycles — meaning the higher cycles are stronger. That’s why shorting doesn’t make sense, since it’s against the main market cycle.
🔑 But also, since LWC has gained downward momentum, long positions — if not set with wide stop-losses — will likely get stopped out, because this momentum may cause small downward legs that hit stop-losses.
👀 So opening a long position is also difficult right now, and that’s why I say it’s better to wait for the price to move out of the 110000 to 116000 range, and then enter a position more comfortably.
🎲 If the price goes below 110000, we’ll receive the first sign of a trend reversal in the MWC, and then we can open short positions. And if it goes above 116000, LWC becomes bullish again and the continuation of the uptrend can begin.
Let’s now go to the triggers:
📈 The trigger we have for a long position is 115327 — an important ceiling that overlaps with the 0.5 Fibonacci level and has been touched several times.
☘️ If we get another touch to this level, I myself will likely try to open a long position, and I think it’s a good entry point that’s worth the risk to anticipate a breakout of 116000.
🔽 For a short position, a break below the 112205 low will start the continuation of the correction. I won’t open this position myself, but if you believe Bitcoin wants to reverse its trend, this is a very good trigger in terms of price level and you can open the position.
❌ Disclaimer ❌
Trading futures is highly risky and dangerous. If you're not an expert, these triggers may not be suitable for you. You should first learn risk and capital management. You can also use the educational content from this channel.
Finally, these triggers reflect my personal opinions on price action, and the market may move completely against this analysis. So, do your own research before opening any position.

OKLO — when nuclear momentum breaks resistanceSince late 2024, OKLO had been consolidating inside a clear rectangle between $17 and $59. The breakout from this long-term range triggered a new bullish impulse. The price has since returned to retest the breakout zone, now aligned with the 0.618 Fibonacci retracement at $51.94. The retest has completed, and the price is bouncing upward, confirming buyer interest.
Technically, the trend remains firmly bullish. The price closed above the prior range, EMAs are aligned below, and the volume spike during breakout supports genuine demand. The volume profile shows a clean path toward $100, indicating limited resistance ahead. The structure suggests a controlled rally rather than an exhausted move.
Fundamentally, OKLO is a next-generation SMR (Small Modular Reactor) company focused on delivering compact, efficient nuclear power solutions. Following its public debut via SPAC and recent capital injection, OKLO is transitioning from development to implementation. Institutional interest is holding strong, and the broader move toward decarbonization and energy independence places the company in a strategic position.
Target levels:
— First target: $100 — psychological and technical resistance
— Second target: $143 — projected from prior range breakout
OKLO isn’t just another clean energy ticker — it’s a quiet disruptor with nuclear potential. The chart broke out. The volume confirmed. Now it’s time to see if the market follows through.

XAUUSD Critical movement !!!The 3351 4h frame was so critical as I said and showed the movement will make the decision.
Flying now with
tp : 3385
tp:3400
tp : 3413
Better wait for another confirmation on the breaker block 3370 closing above it with green candle . push the price higher as showed

Next movement is so critical The next movement of the gold will make the last decision , 1h fram above the 3352 will make the next target 3360/3380/3400
Be careful and chill !
Breaking the 3348 may see rejection on 3344 3340 as said in the morning ! Will follow up with it

USOIL drops on rising supply and demand concernsUSOIL drops on rising supply and demand concerns
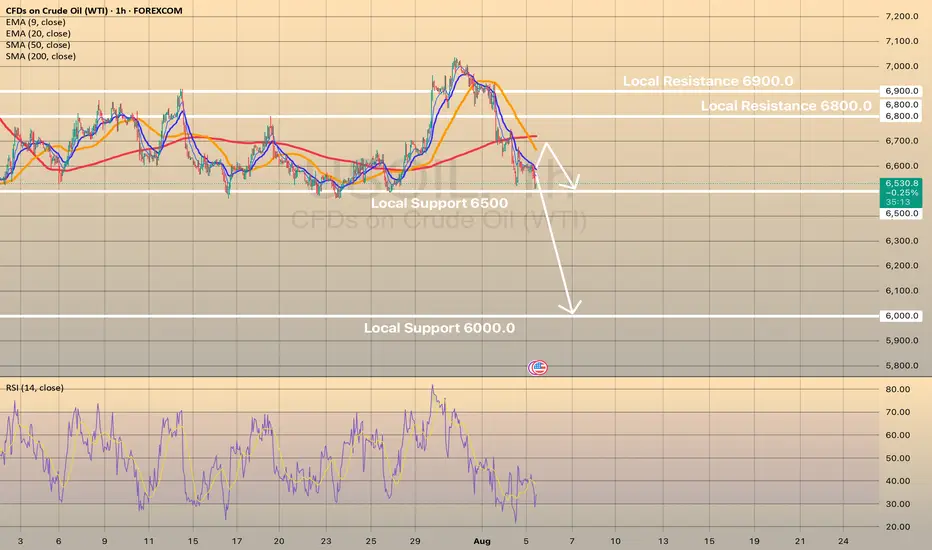
Oil prices fell Tuesday as OPEC+ planned a 547,000 bpd output increase for September, overshadowing potential Russian oil supply constraints from U.S. policies. Brent and WTI crude dropped to their lowest in a week, marking a fourth consecutive decline. OPEC+’s reversal of 2.5 million bpd cuts, combined with weak demand outlooks due to U.S. recession risks and China’s lack of new stimulus, pressured prices. Trump’s threatened 100% tariffs on Russian crude buyers like India, which imports 1.75 million bpd, heightened trade tensions but failed to lift oil prices. Analysts warn U.S. tariffs could further weaken global growth and fuel demand.
USOIL shows some in-moment strength on RSI on 1-h chart, the price may rebound towards sma200 at 6,700.00. However, in long-term perspective, low oil price is expected. Eventually, the price may decline towards level of 6,000.00.
Time is equal to price !Will gold visit again the LL at 3268 or it will pull back from 3340/3344 !
If so we may see gold making a new top at 3400 /3450/3500/3550/3600 .

XAUUSD shows bearish divergence. Minor correction or sign of a rXAUUSD shows bearish divergence. Minor correction or sign of a reversal?
On August 4 gold continued bullish momentum, started on August 1 after disappointing nonfarm payrolls report came out that heightened fears about the U.S. economy’s health. Investors now see a 94.4% likelihood of a Federal Reserve rate cut in September. Gold gained further support due to doubts about the Fed’s autonomy after Governor Adriana Kugler resigned on August 1, opening the door for President Trump to appoint a successor who may support his push for lower interest rates. The metal’s safe-haven status was also bolstered by trade tensions, as Trump’s new tariffs on exports from numerous trading partners are scheduled to begin on August 7.
Despite this, in short term gold looks bearish. The price has failed to break through the intermediate level of 3,380.00 and currently trades slightly below this level, showing bearish divergence. The decline towards the SMA50 with further rise towards 3,440.00 is expected here. Second option (less probable) is the price comes back to a level of 3,300.00.

XAUUSD – Decision Zone Between $3,395 & $3,362Gold continues to trade within a defined structure, now pulling back from local highs after rejecting near the open. Price is approaching key support just above $3,362, which now acts as the decision point for the next leg.
Buyers held this zone previously, but momentum has weakened and the next move will be critical:
→ $3,395.76 is the upside trigger; a confirmed 30m close above could open the door toward $3,407 and higher
→ A failure to hold $3,362.60 support would expose $3,358 and possibly accelerate a bearish continuation
→ The structure remains range bound, but compression is building beneath resistance
This is a pivotal zone for gold short term. Either bulls reclaim control with a strong breakout above $3,395 or sellers step in on a confirmed breakdown below $3,362 to reset structure lower.
#XAUUSD #GoldAnalysis #PriceAction #BreakoutLevels #SupportResistance

SOLUSDT 1D - Bulls back in control with Golden Cross and channelOn the daily chart, SOLUSDT is forming a bullish continuation structure. After the Golden Cross (MA50 crossing MA200), the price is now pulling back toward the midline of the ascending channel and the 0.5 Fibonacci level at 166.38. This confluence with the broken trendline and 200 EMA makes this zone a prime technical area of interest.
Support: 166.38 (0.5 Fibo), EMA200 (161.77), broken trendline
Resistance: 182.84–189.67 (Fibo 0.705–0.79), 206.54, target - 255.93 (Fibo 1.618)
This retracement looks healthy, supported by higher volume during the prior bullish leg. As long as the 166.38–161.77 zone holds, continuation toward 206.54 and potentially 255.93 is on the table.
Fundamentally, Solana remains a key L1 narrative with strong traction in DePIN and AI-linked dApps. The rising TVL and investor sentiment support the trend.
Watch price action around 166 for confirmation - this is the battleground.

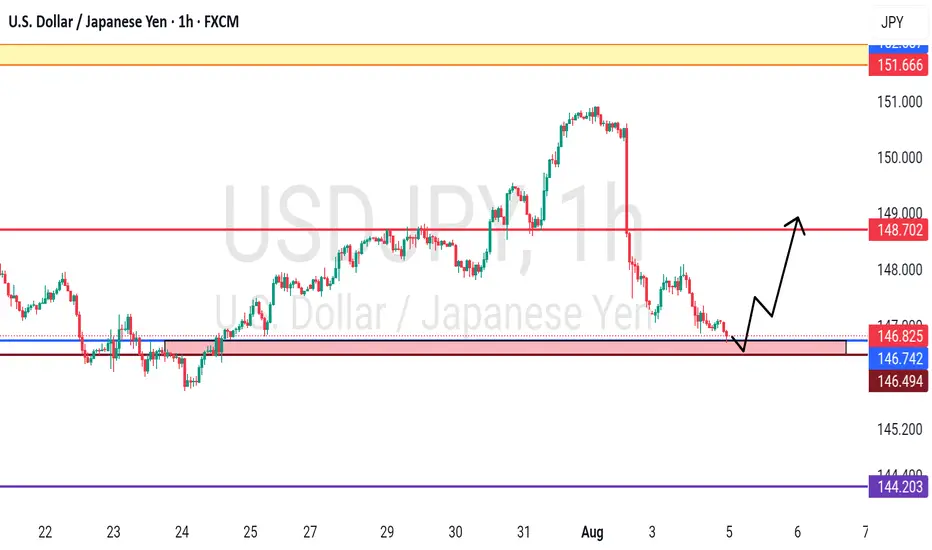
USDJPY - at his ultimate region, holds or not??#USDJPY .. market just reached at his current supporting region .
That is around 145.55 to 146.70
Keep close that region and if market holds that region then we can expect bounce from here
Keep close and don't be lazy here.
Good luck
Trade wisely
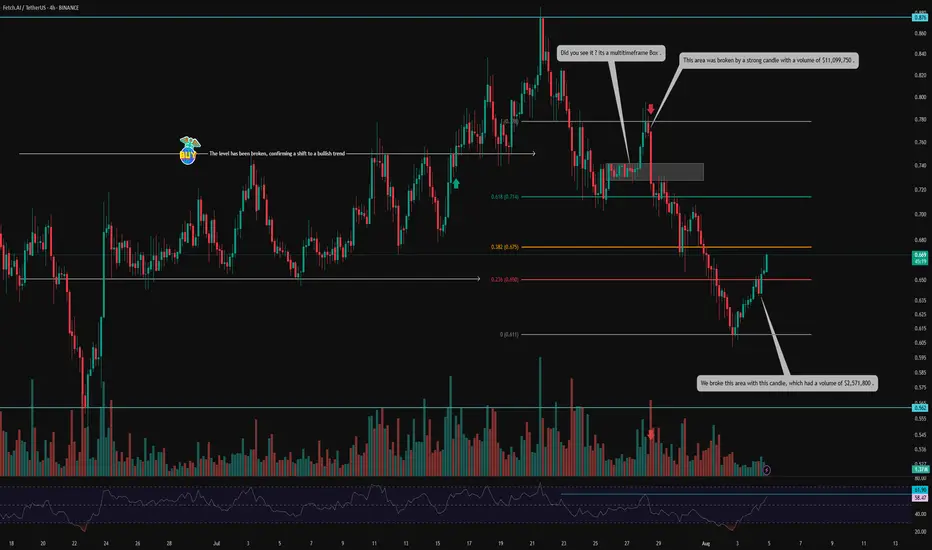
FET on Fire: Volume-Backed V-Pattern Breakout in 4H Structure💀 Hey , how's it going ? Come over here — Satoshi got something for you !
⏰ We’re analyzing FET on the 4-hour timeframe .
👀 After breaking out of its range around $0.75, FET experienced a solid upward move , reaching $0.876 . However , it was rejected from that level and faced heavy selling pressure , eventually forming a consolidation box on the multi-timeframe .
The break of this box, accompanied by rising volume and a total market structure break , led to a move toward the $0.778 resistance , where the price dropped again — this time with significant sell volume .
🎮 The Fibonacci levels in this chart are drawn based on volume-based market activity — specifically from the candle where the sell-off began to the candle where selling pressure ended and a reversal candle formed .
It may sound a bit technical , but the 0.236 Fib level acted as a key V-pattern resistance , which was beautifully broken with a strong $2,571,800 volume, and the candle closed above it .
Following that , traders showed reactions to this level , and the liquidity absorption can be seen in the form of wicks .
🔑 The next important zone is the 0.382 Fibonacci level at $0.675, where we see two possible scenarios :
Reaction and pullback , followed by a breakout .
Breakout first , then a pullback .
You can also place a buy stop at this level — just make sure to use a wider stop-loss .
⚙️ The structure is looking relatively good . The 61.9 RSI region could cause some noise in lower timeframes , but the key area is RSI 70 , which is the entrance to the Overbought zone .
🔼 Volume has been decent , especially considering today is Saturday and a weekend session . This adds more confirmation to the breakout of the V-pattern and the potential end of the correction .
🖥 Summary :
FET is one of those coins with strong recovery potential , operating in the AI sector . It tends to respect classic price action patterns , and with well-drawn Fibonacci levels , volume confirmation , and RSI moving into Overbought , it often activates buy-stop positions cleanly .
💡 Disclaimer :!!! .