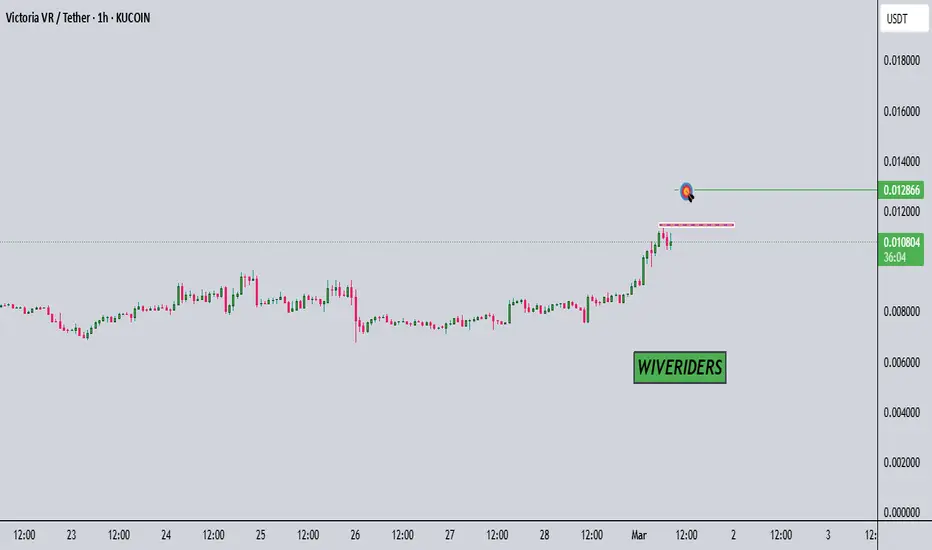
testing the red resistance zoneAnalysis 🚨
NSE:VR is testing the red resistance zone 🔴. If the breakout is successful, the first target will be the green line level 🟩.
🎯 First Target: Green line level
Tradingview
testing the red resistance zone$PNUT is testing the red resistance zone 🔴. If the breakout is successful, the first target will be the green line level 🟩.
🎯 First Target: Green line level

Cup and Handle pattern!Analysis 🚨
NYSE:VET is forming a Cup and Handle pattern! ☕ If it breaks out of the red resistance zone 🔴, the next targets will be:
🎯 First Target: Green line level 🟩
🎯 Second Target: Blue line level 🔵

EUR/USD Rejection at Key Resistance – Bearish Drop Incoming?EUR/USD 4H Chart Analysis 📉🔥
Key Observations:
Resistance Zone (Supply Area) 🚨
Price has tested a strong resistance level (marked by the shaded box) near 1.0500.
Multiple rejections in this area suggest selling pressure is strong.
Potential Reversal Setup 🔄
The price has wicked into resistance and started showing weakness.
A lower high structure could be forming, indicating a possible trend shift.
Bearish Outlook 🐻📉
A break below recent support would confirm a sell-off targeting the lower price range.
The chart suggests a potential move towards 1.0350 - 1.0300 levels.
The 200 EMA (1.0425) is acting as dynamic support, but a break below it will accelerate the drop.
Liquidity Grab & Stop Hunt 🎯
Price action could have trapped buyers before reversing.
A potential stop-loss hunt above the previous highs before a drop.
Trading Plan 💡
✅ Sell Bias: Look for confirmations like bearish engulfing candles or break below 1.0450.
❌ Invalidation: A clean breakout above 1.0510 cancels the bearish setup.
🎯 Target Levels: 1.0350, 1.0300.
🔥 Final Verdict: Bearish setup forming. Watch for breakdown confirmation! 🚀

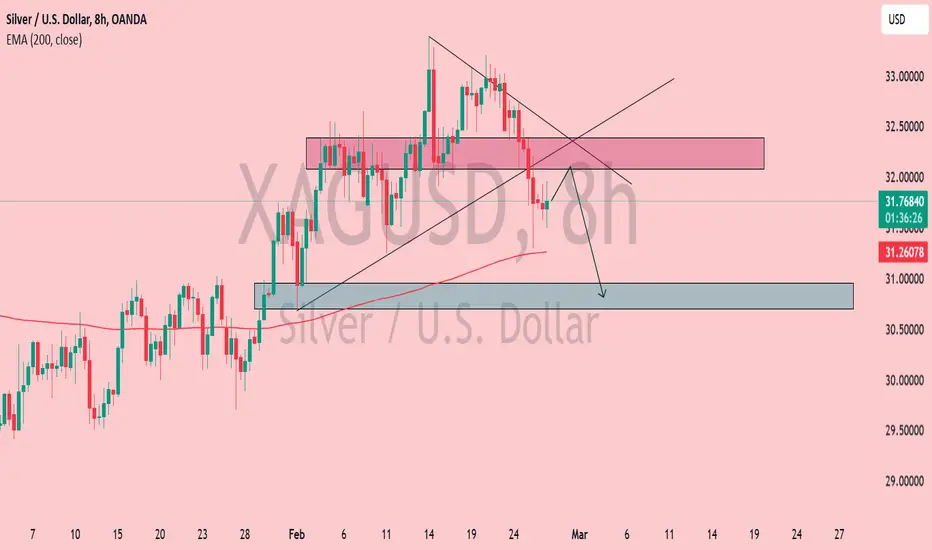
Silver (XAG/USD) Bearish Retest – Drop to $31 Incoming?Silver (XAG/USD) - 8H Chart Analysis
📉 Bearish Setup in Play
Breakout & Retest: Price broke down from a wedge pattern and is currently retesting the supply zone (highlighted in red).
EMA (200) Support: The 200 EMA (31.26) is acting as dynamic support. If price holds below, further downside is expected.
Bearish Target: A move towards the demand zone (30.80 - 31.00) (blue area) is anticipated.
Key Resistance: The rejected zone around 32.00 remains crucial for trend direction.
💡 Trade Idea:
If rejection is confirmed at the supply zone, short positions targeting 31.00 look promising.
A break above 32.00 could invalidate the bearish outlook.
🔥 Watch for confirmation! 🚀
GOLD - if breakout , then??#GOLD.. overall market just palced avery resonable low.. but if market break below then we can expect 2815 and 2790

Oil ($USOIL) – Diesel Demand Soars as Cold Grips U.S.Oil ( TVC:USOIL ) – Diesel Demand Soars as Cold Grips U.S.
(1/9)
Good morning, Tradingview! Oil is dipping slightly 📉, at $ 74.93, down 0.1% from yesterday’s close, as per February 27, 2025, data. Cold weather’s driving up U.S. diesel demand 💪, and Texas power systems are hitting clean energy milestones 🌿. Let’s dive into this oil play! 🔍
(2/9) – REVENUE PERFORMANCE 📊
• Post-Election: $ 74.93, down 0.1% from $ 75.00 💰
• Feb 27, 2025: Diesel demand rises due to cold weather 📏
• Texas Power: Clean energy milestones achieved 🌟
TVC:USOIL steady, with diesel’s boost! ⚙️
(3/9) – MARKET POSITION 📈
• Market Cap: Approximately $ 1.05B, tracks WTI crude tight 🏆
• Diesel Spike: Cold lifts usage, per Reuters ⏰
• Energy Shift: Texas clean power climbs 🎯
TVC:USOIL firm, frost pays off! 🚀
(4/9) – KEY DEVELOPMENTS 🔑
• Cold Snap: Boosts diesel usage across U.S. 🔄
• Texas Grid: Clean energy marks met 🌍
• Market Reaction: Down 0.1% post-election 📋
TVC:USOIL adapting, chill’s the star! 💡
(5/9) – RISKS IN FOCUS ⚡
• Election Aftermath: Policy shifts may affect prices 🔍
• Green Energy Growth: Challenges oil’s dominance 📉
• Weather Flux: Diesel demand may fluctuate ❄️
TVC:USOIL tough, but risks hover! 🛑
(6/9) – SWOT: STRENGTHS 💪
• Diesel Lift: Cold weather props up demand 🥇
• Oil Core: Fundamental to energy needs 📊
• Resilience: Handles market fluctuations 🔧
TVC:USOIL got heat in the freeze! 🏦
(7/9) – SWOT: WEAKNESSES & OPPORTUNITIES ⚖️
• Weaknesses: Election haze, green energy bite 📉
• Opportunities: Continued cold weather, rising demand 📈
Can AMEX:USO bank on the frost to gains? 🤔
(8/9) – OIL’s $ 74.93 dip, diesel up in Feb 2025, your take? 🗳️
• Bullish: $ 80+ soon, cold lasts 🐂
• Neutral: Steady, risks in check ⚖️
• Bearish: $ 70 looms, green wins 🐻
Chime in below! 👇
(9/9) – FINAL TAKEAWAY 🎯
TVC:USOIL $ 74.93 dip masks diesel’s cold surge 📈, Texas green strides mix it up 🌿. Election stings, yet dips are our DCA gold 💰. We grab ‘em low, climb like pros! Gem or bust?

BTCUSDT.. again at resistance ? What's next??#BTCUSDT.. that was a perfect move and market dropped as we discussed in our last idea regarding #BTCUSD, that was 12k pips ride
Now market again near to his current resistance region that is around 80500 to 81400
Keep close that region and if market tholds then again drop expected.
Good luck
Trade wisely

TradeCityPro | Bitcoin Daily Analysis #19👋 Welcome to TradeCity Pro!
Let's dive into the analysis of Bitcoin and important crypto indices. As usual, I will review today's future triggers for the New York session. Today's analysis will be conducted in the 4-hour timeframe, as the 1-hour timeframe does not provide the clarity of price information we need, and the 4-hour timeframe is better suited for today's analysis.
⏳ 4-Hour Timeframe
As you can see, after the price broke through the $95,108 area, we witnessed a significant drop on the chart, with the first bearish leg reaching down to $87,070 and subsequent legs moving to lower areas. Currently, the price has reached the support at $78,940 and has been supported there.
🔍 As you can observe, the volume of the price candles is very high compared to the green candles, which clearly indicates that the market's control is heavily skewed towards sellers.
✨ The RSI oscillator, after forming a Double Bottom in the oversell area and returning to the normal zone, re-entered the oversell zone yesterday, which led to another bearish leg after breaking the $83,779 trigger, which I had previously identified for you, and the price then proceeded to perform its next bearish leg.
💥 Currently, we have positions open from the $95,108 and $92,433 areas, and if you have been following and looking to open more positions, you would have also opened positions upon the breaks of $87,070 and $83,779. Given the sharp market downturn, you would have made a considerable profit by now.
✅ I suggest that if you have open short positions from any of the levels that were breached, to take profits and even close the position because it seems the market has completed its downturn and might start correcting or ranging.
🧩 The range I anticipate the price might oscillate within is between $72,940 to $82,700, but keep in mind that these analyses are my personal opinion, and the price could break the $78,940 area and perform its next bearish leg at any moment. In that case, I would personally open a short position and ensure to have a short position open in case of a break below $78,940.
🔽 Today, apart from this short trigger, I cannot give you another trigger. This short trigger is very risky, and you should open this position with the minimum risk your strategy allows.
👑 BTC.D Analysis
As observed in the 4-hour timeframe, BTC.D is currently forming a smaller box between the areas of 60.48 to 60.91 and continues to fluctuate within this box, so no specific trend can be predicted.
🔑 However, if the area of 60.48 breaks, we can be more hopeful for an altcoin rally, expecting that altcoins might recover some of the ground they have lost because, along with Bitcoin's ranging, Bitcoin dominance has been increasing, and altcoins have been bearish for several months.
📅 Total2 Analysis
Moving on to Total2, as you can see, Total2 was rejected from the crucial area of 1.13, which I mentioned before, and broke the 1.07 area, currently registering a floor at 1.01. This area was not historically significant, and the price has reacted alongside Bitcoin, so we need to see how Total2 moves.
⚡️ If the 1.01 breaks, you can open a short position, which I will also be doing. However, I will open this position only if Bitcoin dominance turns bullish, expecting further declines in altcoins if that happens.
🔼 For a long position, you need to wait until the price forms a new upward structure, and if it moves sharply upwards, you can enter on a break of 1.13.
📅 USDT.D Analysis
As I mentioned yesterday, there was a significant resistance area at 5.45 in USDT.D, where Tether's dominance was rejected from slightly higher at 5.50, and we are seeing a red candle which might indicate the start of a correction and the end of this bullish leg in dominance.
⭐️ The only trigger for a bullish scenario in USDT.D dominance and a market downturn is 5.50, and for a long position and a decline in Tether's dominance, there is no trigger at this moment.
❌ Disclaimer ❌
Trading futures is highly risky and dangerous. If you're not an expert, these triggers may not be suitable for you. You should first learn risk and capital management. You can also use the educational content from this channel.
Finally, these triggers reflect my personal opinions on price action, and the market may move completely against this analysis. So, do your own research before opening any position.

TradeCityPro | SUSHI: Key Levels and Market Outlook👋 Welcome to TradeCity Pro!
In this analysis, I want to review SUSHI for you. SushiSwap is a DeFi protocol operating in the DEX sector, with its token currently ranked 195th on CoinMarketCap and a market cap of $58 million.
📅 Weekly Timeframe
On the weekly timeframe, we can see a consolidation box between $0.534 and $1.959. Since 2022, the price has been fluctuating within this range, forming a large consolidation zone, with multiple touches to both the upper and lower boundaries of this box.
🔍 As observed, in the last bullish leg, the price broke above the box's upper boundary with a large weekly candle. However, it quickly retraced back into the range after being rejected at $2.734, resulting in a fake breakout.
🧩 Currently, the price is near the lower boundary of the range at $0.534. If this support level breaks, the price could initiate another bearish leg and move toward a new all-time low (ATL). On the other hand, if the upper boundary of the box is broken and price stabilizes above it, we could see an upward movement in SUSHI.
⚡️ The largest and most significant resistance ahead is at $20.444, which is the all-time high (ATH). Reaching this level would be extremely difficult, as it would require a significant increase in market capitalization, meaning a substantial capital inflow into the coin.
✨ Let’s now analyze the daily timeframe to gain more insight into price movement.
📅 Daily Timeframe
On the daily timeframe, as seen in the last bullish leg, the price bounced from the $0.534 support and moved upward. After breaking $0.803, strong bullish momentum entered the market. Additionally, RSI reaching the oversold zone contributed to a stronger bullish push.
🔽 Following this movement, the fake breakout at $1.855 led to the start of a corrective and bearish phase, with the price initially declining to $1.347.
📊 After breaking below $1.347 and retesting it as resistance, the price entered another bearish leg, reaching $0.803. Currently, after some range-bound movement around this level, RSI has exited the oversold zone, and the price seems to be retesting this level as resistance.
✅ If RSI re-enters the oversold zone, the price could drop further to the lower boundary of the range at $0.534, which would not be a good sign for SUSHI. As observed, buying volume has significantly decreased, and most traders in this market are sellers.
🛒 For spot buying, I recommend avoiding this coin for now and waiting for a clear bullish structure to form. At a minimum, SUSHI should start showing strength against Bitcoin.
🧲 From a USDT perspective, if the upper boundary of the range ($1.855) breaks, then $2.734 could serve as a trigger for a buying opportunity.
📝 Final Thoughts
This analysis reflects our opinions and is not financial advice.
Share your thoughts in the com

Daily Market Outlook: BTC, DXY & Gold Analysis (#8)The market has been highly reactive following yesterday’s GDP and Unemployment Claims report. The DXY strengthened sharply, reaching a key resistance at 107.474. Previously, this level acted as a strong support and has now turned into a major resistance zone.
DXY Analysis
We need to consider multiple scenarios for the dollar index:
Most Likely Scenario: If DXY gets rejected from 107.474, we can look for short positions below 107.063, anticipating a continuation of the secondary downtrend in the daily timeframe.
Alternative Scenario: If DXY breaks above 107.474, it could continue strengthening toward 107.767, confirming that the correction is over and resuming the major uptrend.
Gold (XAU/USD) Analysis
Gold dropped below 2878.87, entering a price correction phase. Key support levels to watch:
2841.25 (Fib 50%)
2811
2790 (Strong demand zone)
Short Position Plan (1H Timeframe)
If gold finds support at 2855 (35% Fib), and later breaks it, a short entry could be considered.
If the drop continues, the next major short opportunity is at 2841.89 in the 4H timeframe.
Long Position Plan
A confirmed breakout above 2879.26 will indicate strength, making it a valid long entry point.
Bitcoin (BTC/USD) Analysis
BTC has been experiencing significant downside pressure, aligning with the February 26 analysis where I highlighted the potential for a price correction within its major uptrend.
As mentioned earlier, losing 80-82K support would shift the market bias to bearish, favoring short positions. If you shorted BTC from 85K, this could be a great area to secure profits.
Currently, BTC lacks a clear structure, so I’m waiting for more confirmation before taking new positions.
What’s Next for BTC?
If BTC closes below 80K, we will need to reassess the market structure and update our strategy accordingly.
If BTC holds above this level, there is still a chance for a recovery and potential upside continuation.
However, if 80K is lost, the recovery process could take much longer than expected.
Final Thoughts
Stay patient and wait for clear market structures before entering trades. If you’re already in positions, manage them carefully based on these levels.
I’m Skeptic , and I’m grateful to be on this journey with you all. Trading is tough, but growing together makes it worthwhile. Stay profitable and see you tomorrow! 🚀💡

Bitcoin (BTC/USD) Technical Analysis & Trading PlanBitcoin (BTC/USD) Technical Analysis & Trading Plan – February 28, 2025
Market Overview
The Bitcoin (BTC/USD) price is currently trading at $79,770, showing a -0.74% decline in the latest 4-hour candlestick. The chart illustrates a falling wedge trading pattern, which is considered a bullish reversal signal. The price is approaching the lower boundary of the wedge, signaling a potential breakout to the upside.
Technical Indicators & Key Observations
Falling Wedge Pattern:
The price has been making lower highs and lower lows within a falling wedge formation (red and green trendlines).
A breakout above the upper boundary of the wedge could trigger a strong bullish rally.
Support and Resistance Levels:
Immediate support: $76,665
Major support: $67,679
Key resistance levels:
$88,671
$91,271
$95,497
$108,329 (Major long-term resistance)
Momentum Indicators:
RSI (Relative Strength Index): 22.26 (oversold), indicating potential upward momentum.
Stochastic Oscillator: 16.14, also in the oversold region, confirming a possible reversal.
Money Flow Index (MFI): Showing weak inflow, but a reversal at these levels could indicate increasing buying pressure.
Cipher_B Divergences: Potential bullish divergence forming, adding confluence to the breakout scenario.
Professional Trading Plan
Entry Strategy
Aggressive Entry: If Bitcoin closes a 4-hour candle above the wedge's upper trendline (~$80,500), an early entry can be considered.
Conservative Entry: Wait for confirmation above the $82,000 level with strong volume before entering a long position.
Profit Targets
First Target: $88,671 (previous local high)
Second Target: $91,271 (psychological level)
Third Target: $95,497 (strong resistance)
Ultimate Target: $108,329 (major long-term resistance)
Stop-Loss Strategy
For aggressive traders: Below $76,500 (recent low)
For conservative traders: Below $74,000 to reduce risk exposure
Risk Management
Risk-to-reward ratio: 1:3 or higher (entry should be calculated to maintain proper risk-reward)
Position Sizing: Allocate 2-5% of capital to this trade, considering volatility.
Conclusion
Bitcoin is currently trading at a critical support level within a falling wedge. The RSI, Stochastic, and MFI indicators suggest oversold conditions, indicating a potential bullish breakout. Traders should watch for a confirmed breakout above the wedge with strong volume before entering a position. Targets remain between $88,000 and $108,000, with well-defined stop-loss levels to minimize risk.
💡 Recommendation: Monitor price action closely, especially in the next few 4-hour candles. If BTC breaks above the wedge, prepare for a bullish move towards resistance levels.

TradeCityPro | LTCUSDT Let's go for spot buying?👋 Welcome to TradeCityPro Channel!
Let's go together to analyze and review Litecoin analysis, one of the oldest coins in the market, and let's go to update the triggers of the previous analysis!
🌐 Overview Bitcoin
Before starting today's altcoin analysis, let's look at Bitcoin on the 1-hour timeframe. Since yesterday, Bitcoin experienced a correction, which was necessary for the market, and it pulled back to the 102135 range. The next trigger for a long position will be a breakout above 104714.
Yesterday's correction, coupled with an increase in Bitcoin dominance, caused noticeable declines in some altcoins. This highlights the importance of monitoring BTC pairs in your checklist these days.
📊 Weekly Timeframe
On the weekly time frame, it is one of the coins that is in a good position compared to the coins and has had the least correction in recent declines and is in this position due to the possibility of ETF approval
There is no need to complicate things in this time frame and after the break of 136.45, we will buy and be above 98.44. This trigger is valid and we do not have much of an exit trigger for the conditions of these days on this chart and for now it is better to continue holding
📈 Daily Timeframe
On the daily time frame, we are also in a good position and we had a good return after the recent market decline due to the Bybit hack and Trump's tariffs and this is a good thing!
After breaking the 75.01 level and exiting the daily box and breaking its ceiling, we moved up to the resistance of 136.45 and are now fluctuating between the 98.44 to 136.45 boxes.
We also had a curve line in this time frame that was a good support for this event and every time we hit it, we made a good move upwards, but after its failure, it can be said that the upward trend moved into the range and went to form a new structure.
To buy spot after the 136.45 trigger is broken, we can buy for spot with a stop loss of 98.44 and as long as we are above 114.38, the 136.45 trigger is very important for us and it shows us more the strength of buyers and in case of a 98.44 break, we will go for 89 and 80 and we will have a price correction.
📝 Final Thoughts
Stay calm, trade wisely, and let's capture the market's best opportunities!
This analysis reflects our opinions and is not financial advice.
Share your thoughts in the comments, and don’t forget to share this analysis with your friends!

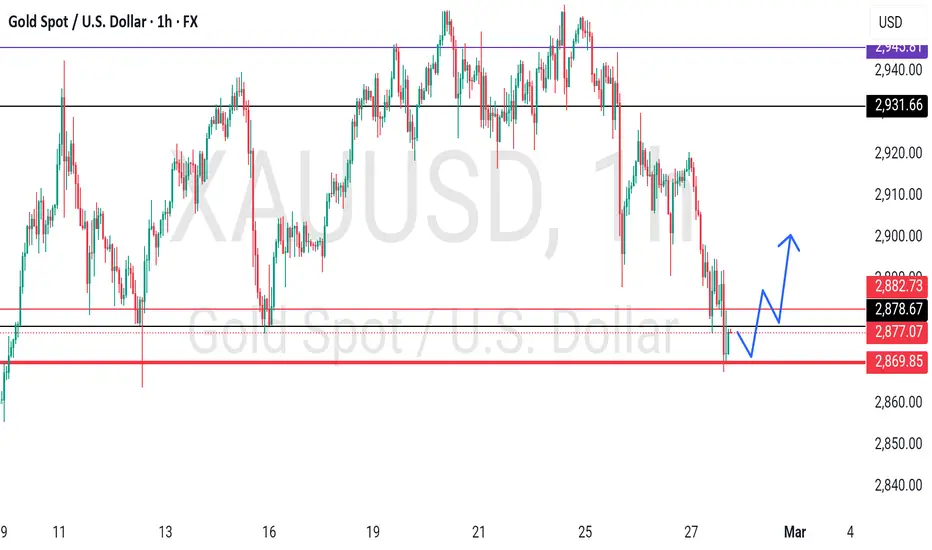
GOLD - single supporting area, holds or not??#GOLD.. market just placed his day low around 2868 68
Guys keep close that is only single area for next move to anyside.
Until market didnot closed below 2869 there is no sell further.
Only short below that otherwise not now..
Stay sharp
Good luck
Happy trading
LITECOIN ($LTC)—$130 SPIKE FLAGS BIG TRADELITECOIN ( CRYPTOCAP:LTC )—$130 SPIKE FLAGS BIG TRADE
(1/9)
Good afternoon, TradingView! Litecoin ( CRYPTOCAP:LTC ) is buzzing, up 25% to $ 130 in 2 days 💰 ETF hype swirls, let’s unpack this crypto sleeper! 🌍
(2/9) – PRICE POP
• Surge: $ 106 to $ 130, 25% jolt 📈
• Avg: $ 114.98 since Dec ‘24 💡
• Rank: Top weekly gainer 🌟
CRYPTOCAP:LTC ’s flexing, dino coin roars!
(3/9) – TRADE SETUP
• Range: Bouncing at $ 114.98 🚗
• Gain: 25% in 48 hrs—swift climb 🌞
• Past: Steady over a decade 💪
CRYPTOCAP:LTC ’s brewing, short-term juice flows!
(4/9) – ETF BUZZ
• Odds: 80% for LTC ETF nod 📊
• Impact: Institutional cash looms 🌍
• Vs BTC: Digital silver shines 💎
CRYPTOCAP:LTC ’s gearing up, big bets ahead!
(5/9) – RISKS IN PLAY
• BTC Shade: King’s glare dims ⚠️
• Volatility: Swings sting quick 🐻
• ETF Wait: Regs lag, hope wobbles 🔒
CRYPTOCAP:LTC ’s hot, can it dodge the fade?
(6/9) – SWOT: STRENGTHS
• Stay: Decade strong, legit cred 💪
• Pop: $ 130 spike, 25% zip 🏋️
• Base: Steady $ 114.98—tough nut 🌱
CRYPTOCAP:LTC ’s gritty, silver’s got guts!
(7/9) – SWOT: WEAKNESSES & OPPORTUNITIES
• Weaknesses: BTC’s shadow looms 🙈
• Opportunities: ETF buzz, trader zing 🌏
Can CRYPTOCAP:LTC vault past the pack?
(8/9) – CRYPTOCAP:LTC ’s $ 130 pop, what’s your vibe?
1️⃣ Bullish, $ 150+ stacks up 😎
2️⃣ Neutral, Holds, risks linger 🤷
3️⃣ Bearish, $ 100 dip looms 😕
Vote below! 🗳️👇
(9/9) – FINAL TAKEAWAY
CRYPTOCAP:LTC ’s $ 130 spike and ETF buzz spark zing, silver sleeper 🪙 Steady grit, risks lurk, gem or bust?

XAU/USD : Get ready for a new ATH, Towards $3000?! (READ)Gold's one-hour chart analysis confirms that the price has followed our previous forecast precisely, reaching the $2951 level as expected. Comparing the last five analyses highlights the accuracy of these projections.
Currently, after hitting $2951, gold is facing selling pressure and is trading around $2947. I anticipate a slight correction before another upward move.
Short-term targets: $2954 and $2956
Medium-term targets: $2966 and $2969
Please support me with your likes and comments to motivate me to share more analysis with you and share your opinion about the possible trend of this chart with me !
Best Regards , Arman Shaban

TradeCityPro | Bitcoin Daily Analysis #18👋 Welcome to TradeCity Pro!
Let's dive into the analysis of Bitcoin and key crypto indicators. Yesterday, the price broke the critical support level at $87,700 and proceeded to the next bearish leg. Today, we'll explore what might happen to Bitcoin in the future and identify appropriate triggers for opening positions in the New York session.
⏳ 1-Hour Timeframe
As you can see, yesterday the price was rejected from $89,458 and moved downwards, breaking the support at $87,070 and dropping to the area of $83,779.
⚡️ As you notice, I have adjusted the Fibonacci that I had drawn. This is because the price did not even correct to the 0.382 Fibonacci level. In fact, the correction and rest that occurred up to $89,458 was not a true correction, but rather a part of the bearish leg.
✅ As you can see in this new form that I have drawn Fibonacci, the 0.5 and 0.382 levels have become very important areas and can be considered significant resistance zones for the price.
♟ Currently, after reaching $83,779, the price has found support at this level, and as observed, the RSI has shown significant divergence with the previous bottom, and after the divergence trigger in the RSI hit 50, we see that the price has managed to form a green candle.
🔍 If the price can rise above this level again and return to the box between $87,070 and $89,458, we can say that the bearish trend has temporarily ended, and the market wants to create a new structure for opening positions.
🧪 As we did before, we supported from $87,070 and took a day of rest in this area. We opened a position when it broke $87,070, and I hope you were with us and opened your position.
🔄 From the positions we previously held from higher areas like $95,108 and $93,433, I suggest using Dow Theory to close your positions if the price establishes a higher floor and ceiling. You can also place your active stop loss above the resistance area of $89,458, which corresponds to the 0.5 Fibonacci level.
📈 However, for opening positions today, if the price moves sharply upward and forms a V pattern, you could consider opening a long position if it breaks $89,458. But this position is very risky, and I personally won't open it because the market trend and momentum are completely bearish, and I see no sign of an upward trend.
🔽 For short positions, if the price is rejected from $87,070, you could open a short position in the lower timeframes if this trigger breaks. However, if you want to behave more securely, you can open a short position if $83,779 breaks.
🎲 I will not be joining this position because I have positions open from higher up, and I don't want to disrupt the average of my position and have it move lower. I think the price has fallen enough and now needs rest, although my view might be wrong, and the price could from here again commence the next bearish leg.
👑 BTC.D Analysis
Let's move on to analyzing Bitcoin dominance to determine which coins might be more appropriate to trade today. As we see, there was another drop in Bitcoin dominance, this time breaking the area of 90.61, and dominance has returned to the previous low of 60.48, where it found support.
🧩 As Bitcoin corrected, Bitcoin dominance also increased, causing Bitcoin to perform deeper corrections compared to altcoins.
🧲 When we get to Total2, we'll see that Bitcoin has corrected more than altcoins, but determining the trend in Bitcoin dominance is a bit difficult as it's nearly forming a large range box between 60.48 and 62.19. As long as it's in this box, it's hard to determine a clear trend, and it might move towards the bottom or top of the box.
💥 However, since we are currently at the bottom of this box, if dominance again stabilizes above 60.21, we can take this as confirmation of becoming bullish. If the bottom of the box, which is 60.48, breaks, dominance could move to its next bearish leg targeting 59.84.
📅 Total2 Analysis
As you observed, alongside the drop in Bitcoin dominance, the market also fell, which caused Total2 to not lose its important area of 1.07 and to bounce back from there, moving upwards.
✨ But as I mentioned, the increase in Bitcoin dominance caused Bitcoin to correct more than altcoins, but overall, Total2 is in a better situation than Bitcoin because Bitcoin was supported at a lower level and lower support, but Total2 bounced back from the same support at 1.07 and is moving upwards.
💫 I expect a box to form between 1.07 and 1.13, which overlaps with the 0.382 Fibonacci, and Total2 could create a structure in this box. Today, if any of these structures break according to Bitcoin dominance, you can open positions, but given that Bitcoin dominance is falling, I prefer to open a position on Bitcoin if the bottom of the box breaks and if I want to open a long position, do it on altcoins unless Bitcoin dominance rises from the bottom of its box and starts moving upward again, becoming bullish.
📅 USDT.D Analysis
Let's go to the analysis of Tether dominance. As you see, dominance broke the resistance at 5.04 and made another upward move to the resistance at 5.21.
⭐️ Currently, dominance is moving downwards again and has entered a corrective phase. There is a very important floor at 4.92, and as long as it is above this area, I see the trend of Tether dominance as bullish.
❌ Disclaimer ❌
Trading futures is highly risky and dangerous. If you're not an expert, these triggers may not be suitable for you. You should first learn risk and capital management. You can also use the educational content from this channel.
Finally, these triggers reflect my personal opinions on price action, and the market may move completely against this analysis. So, do your own research before opening any position.

BTCUSDT - vomiting camel pattern? then what's next??#BTCUSDT.. market just going to make a technical formation that is VOMITING CAMEL pattern,
that will be a very dangerous formation if its occur.
you can search that formation on google as well.
then next areas are expected like 80000 or 70000
stay sharp
trade wisely

TradeCityPro | ASTR: Key Support Levels and Market Momentum👋 Welcome to TradeCity Pro!
In this analysis, I want to review ASTR, one of the coins in the Ethereum ecosystem, currently ranked 159th on CoinMarketCap with a market cap of $297 million.
📅 Daily Timeframe
On the daily timeframe, as you can see, the price is in a long-term downtrend. The first bearish leg started from the $0.1907 high and moved down to the $0.0505 level. After this move, the price formed a consolidation box between $0.0505 and $0.0813. Once $0.0505 was broken, the price dropped further to the key support at $0.0369.
⚡️ As highlighted on the chart, there is a critical demand zone near the $0.0369 level. If the price breaks below this zone, it could register a new all-time low (ATL), which could put serious pressure on the project’s outlook.
📊 As observed, market volume within the consolidation box was decreasing. However, after the breakout, volume increased. Now that the price is ranging again, volume is dropping once more. If RSI enters the oversold zone and breaks below the 30 level, the likelihood of breaking $0.0369 significantly increases, which could trigger a strong downward momentum, leading the price toward new lower targets.
📈 On the bullish side, if the $0.0369 support holds and pushes the price upward, the first long trigger we can consider is $0.0505. We can also confirm bullish momentum from RSI if it breaks above 54.14.
⏳ 4-Hour Timeframe
Now, let’s examine the 4-hour timeframe for a more detailed view of price action. As you can see, the price has formed a ranging box between $0.0369 and $0.0499.
🧲 At one point, the price attempted to break above this range, even forming a higher high and higher low, but failed. After a fake breakout, a double top pattern was confirmed, and when the neckline broke, the price moved downward, reaching the $0.0369 zone once again.
✅ This $0.0369 level remains crucial, as it could keep the price in the current range or push it upward once again.
🧩 However, as seen on the chart, green candles have significantly lower volume than red candles, indicating that bears still dominate the market. The possibility of breaking below this support remains high.
📉 For short positions, the break of $0.0369 would be a strong confirmation. However, keep in mind that below this level lies a strong demand zone, meaning that a reversal could happen at any time. It’s crucial to manage risk carefully when entering shorts.
🔼 For long positions, assuming the previous bullish move was a fake breakout, a break above $0.0419 would be a reasonable entry. However, a more secure long trigger would be at $0.0456.
📝 Final Thoughts
This analysis reflects our opinions and is not financial advice.
Share your thoughts in the comments, and don’t forget to share this analysis with your friends! ❤️

MAJOR SUPPORT AND RESISTANCE OF BTC BASED ON ORDER BLOCKSCurrent Price Action
Bitcoin is trading around $93,041, showing a consolidation pattern after recent price volatility.
The price action suggests Bitcoin is in a critical zone where traders are watching for directional clues.
Support Levels
$92,000 (Immediate Support):
This level has served as intraday support in recent trading sessions.
High trading volumes were observed near this level, suggesting strong buyer interest.
$90,000 (Psychological Support):
Round numbers like $90,000 act as psychological barriers.
Historically, Bitcoin has respected such levels during both upward and downward movements.
$88,500 (Technical Support):
This level aligns with previous consolidation zones and Fibonacci retracement levels (e.g., the 38.2% retracement from the recent rally).
$85,000 (Major Support Zone):
Represents a deeper correction level but remains a critical support based on long-term moving averages (e.g., the 50-day EMA).
Resistance Levels
$94,500 (Immediate Resistance):
Current trading activity shows selling pressure near this level.
Historically, it aligns with a minor peak from earlier price actions.
$96,000 (Strong Technical Resistance):
Close to the upper boundary of recent trading channels.
Converges with key Fibonacci levels (e.g., 61.8% retracement from the last major drop).
$98,000 - $100,000 (Major Resistance):
$100,000 is a significant psychological level for traders.
Breaking this level would signal a strong bullish trend, likely leading to new all-time highs.
Above $100,000:
If Bitcoin crosses $100,000, potential resistance zones could emerge at $105,000 and $110,000 based on historical extensions and trader sentiment.
Other Key Indicators
Moving Averages:
Bitcoin is trading above the 20-day moving average (~$91,500), which is a bullish signal.
The 50-day and 200-day moving averages (~$88,000 and $80,000, respectively) are major support zones.
Relative Strength Index (RSI):
RSI is near 60, indicating neutral-to-bullish momentum. A move above 70 could signal overbought conditions.
Volume Profile:
High trading volume around $92,000–$93,000 suggests significant activity, marking this as a key price region.
Summary
Supports: $92,000 → $90,000 → $88,500 → $85,000.
Resistances: $94,500 → $96,000 → $100,000.
Traders should watch for breakouts or breakdowns at these levels to determine the next price trend.

XRP REJECTED FROM RESISTANCE Analysis 🚨
CRYPTOCAP:XRP is testing the red resistance zone 🔴 and is getting rejected. The next target is the green line level 🟩.
🎯 Target: Green line level

Analysis$FARTCOIN is testing the red resistance zone 🔴. If the breakout is successful, the first target will be the green line level 🟩.
🎯 First Target: Green line level

Analysis$KAITO is testing the red resistance zone 🔴. If the breakout is successful, the first target will be the green line level 🟩.
🎯 First Target: Green line level
