BTCUSD INCREASES Bitcoin looking to be targeting new highs and I’m simply following the trend and keeping trading simple
Tradingview
UP TREND EURJPYEurjpy will be buying and scalping will be moving my SL to BE or swing with it all the way to the top as it cannot sell forever

GME 1W: when the memes fade, the structure speaksGameStop is once again testing the lower boundary of its long-term consolidation, bouncing off the 21.53 zone - a level that aligns with the 0.79 Fib retracement and historical support. This zone also intersects with a key trendline on the weekly chart, and just recently, a golden cross (MA50 crossing MA200 weekly) printed - a rare but technically significant signal. The stock continues to trade inside a broad descending channel, and if this support holds, the natural next step is a move back toward the mid-range at 37.42 (0.5 Fib), followed by a possible push toward 64.92. The tactical setup favors a confirmation entry near current levels, with a stop under 21.00. Risk/reward here is among the cleanest GME has offered in months.
On the fundamental side, GameStop remains in a transitional phase. The company is shutting down unprofitable segments, reducing costs, and doubling down on e-commerce and digital distribution. Financial results are still slow to recover, but the latest Q2 2025 report showed positive operating cash flow and narrowing losses. This isn't a value play in the traditional sense - it's more about the potential for renewed retail-driven momentum if technical conditions align.
If there’s still power behind the crowd - this might be one of the most technically compelling entry zones of 2025.

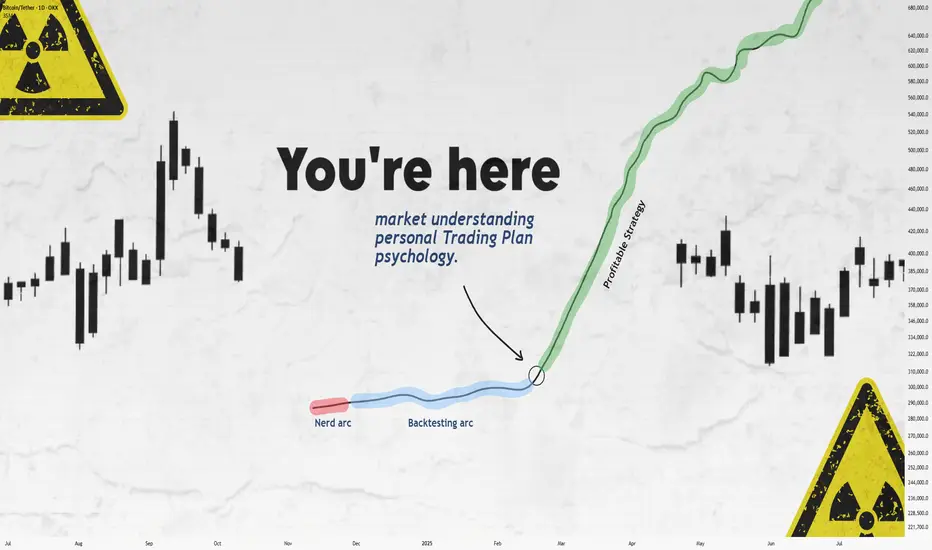
Still Losing After Backtesting? This Fixed It.Let’s get straight to it.
If you’ve gone through the "nerd arc" and the "backtesting arc" but still aren’t profitable...
What’s the fix?
In this short write-up, I’ll walk you through 3 brutal truths that made me finally see green.
Is it hard?
UH—Damn right.
But let’s go 👇
1. Market Understanding
This isn’t something you "learn" from a course.
It’s something that clicks after dozens of stop losses and live trades.
Here are a few ways I got more comfortable with it:
1. Don’t fear opening trades or hitting stop loss.
Each trade gives you data. More trades = more experience = better market feel.
What’s the requirement? Capital and risk management. Without that, you won’t even survive long enough to "get" it.
2. Journaling every single trade.
Write everything: your thoughts, screenshots, feelings — before and after.
Too lazy to do it? Left trading. Simple.
3. Be the detective.
Read the chart like a story. No, seriously.
Think of Bitcoin as a character with real moods.
Every candle tells you something.
That 5% pump? Buyers pushing up. Then bears smacked it down — candle closed red.
Now price is bleeding again.
Why?
🔍 Be the detective.
4. Analyze the market every day — even without trading.
The more you observe, the more you see. Structures. Patterns. Behavior.
Easy? Nah.
It takes discipline — like posting one story text to Insta for 1,000 days straight. Still wanna try?
2. Personal Trading Plan
Remember how I said "don’t fear opening trades"?
Well — after you’ve opened a bunch, you can start tailoring your own trading plan based on you.
This isn’t a PDF you can steal off Google.
Only after seeing how you behave in trades, you’ll know what rules make sense.
Maybe:
"I don’t trade when I’m emotionally off."
"This setup gave me the best results over 100 trades."
Just don’t copy-paste someone else’s rules.
Make a flexible structure, then let the details emerge from the market and your own experience.
Now —
Take a deep breath.
When was the last time you enjoyed your coffee?
More than a day ago?
Go make one now.
Might not get to taste it tomorrow.
Not everything in life is trading :)
3. Psychology
Ah, the final boss.
Still my weakest area, honestly.
But here are a few real things that helped:
Tip 1: WRITE.
Just write whatever you feel.
Telegram saved messages? Notebook?
Or if you're like me (🧠nerd), Notion.
Do it for 60 days straight — then feed that journal to ChatGPT and analyze yourself.
Takes time, but the patterns you'll see are... magical.
Tip 2: Money & Risk Management.
When you know your stop loss means only -0.25% of your capital…
why should you panic?
For me:
I place the SL, set a TP alert, and leave the screen.
No emotions, no fear.
Why? Because when capital is protected, so is my psychology.
Truth is, trading emotions aren’t just during the trade — they live in your head all day.
When your mental energy’s drained?
You’ll miss A+ setups.
Fall for BS ones.
Lose focus.
It’s complicated.
Because humans are complicated.
Our brains are the most tangled system known.
And somehow, out of all that noise, consciousness emerges.
A miracle.
So don’t expect to always feel calm.
Just aim to get better.
That’s it.
Thanks for sticking around.
These are just my thoughts, from one tired trader to another 🧠
I’m no expert—just sharing what’s worked (and what hasn’t).
If it helped, a boost would mean a lot.
🚫 Don’t FOMO
✅ Manage your capital
Until tomorrow —
Peace out. ✌️
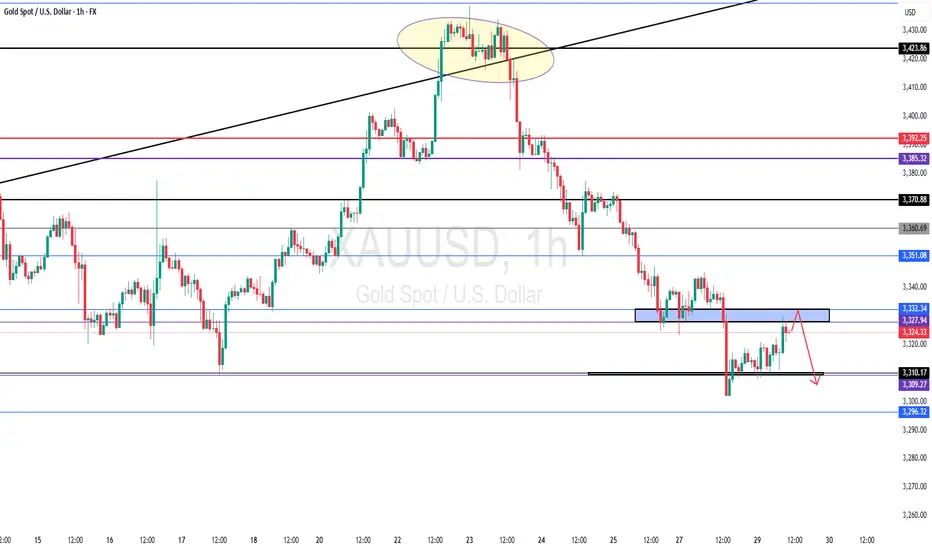
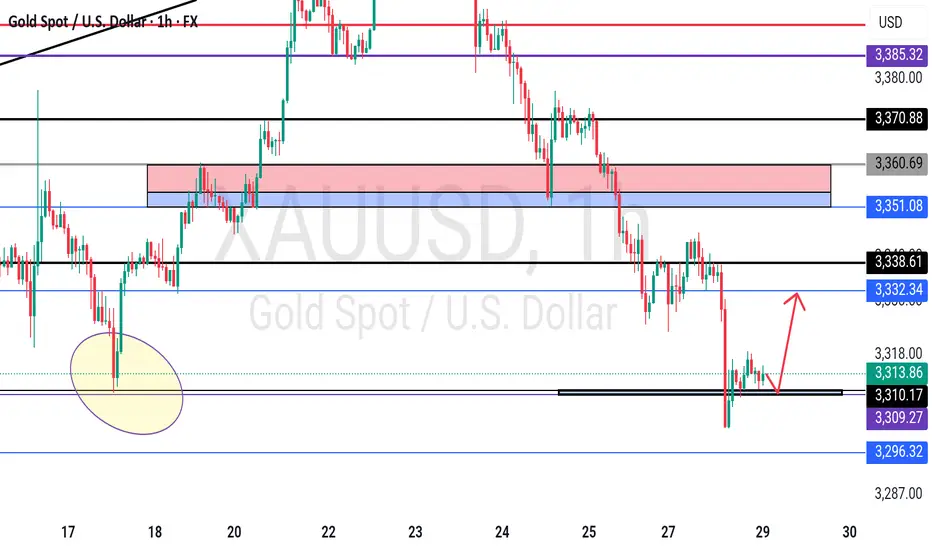
GOLD - Near Current Resistance? holding or not??#GOLD... so market perfectly holds our expected bottom and bounced back and now market just near to his current Resistance region.
that is around 3328 to 3332
keep close that region because if market hold it in that case we can see again drop towards our ultimate support 3310
NOTE: we will go for cut n reverse above 3332 on confirmation.
good luck
trade wisely
EURGBP Analysis : Bearish Leg Nearing Completion + Target Zone📍 Overview:
The EURGBP pair has recently provided significant price action signals that suggest a high-probability reversal setup is unfolding. This analysis dives deep into market structure, supply and demand dynamics, and institutional price behavior using MMC principles.
The current focus lies in identifying a potential trend reversal opportunity after a sharp decline from a key supply level, as price nears a well-marked Reversal Zone. This detailed breakdown covers each phase to provide clarity and trade planning.
🧩 Phase 1: Consolidation Phase (Accumulation)
From July 11th to July 24th, EURGBP moved sideways within a clearly defined range-bound structure (highlighted in green).
This consolidation indicates a battle of control between bulls and bears, typically signaling accumulation or distribution depending on breakout direction.
The tight price action and wicks on both sides suggest market makers accumulating positions before a breakout.
Price eventually broke out to the upside, confirming bullish accumulation rather than distribution.
🚀 Phase 2: Impulse Move & 2x Supply Rejection
Following the breakout from the consolidation, price experienced a strong impulsive rally, catching breakout traders and pushing into a major supply zone.
The area where price reversed is marked as a 2x supply rejection zone, suggesting heavy institutional sell orders were triggered.
This zone aligns with a historical resistance level and is critical in the current structure.
Price failed to sustain the bullish momentum, forming a sharp drop right after tapping into supply, indicating strong selling pressure.
🔄 Phase 3: Market Structure Shift via QFL (Quick Flip Levels)
As the price dropped from the supply zone, two significant QFL levels were printed in quick succession.
QFL (Quick Flip Levels) represent a break in internal structure, showing that buyers were no longer defending the previous support zones.
These quick flips signal an aggressive shift in momentum from buyers to sellers.
Each QFL breakdown was followed by a new lower low, confirming the start of a bearish sequence or trend leg.
📉 Phase 4: Descending Trendline & Dynamic Resistance
After the QFL shifts, a clear downtrend channel formed, respected by multiple lower highs.
The descending trendline drawn from the supply zone peak has acted as dynamic resistance, rejecting every bullish pullback attempt.
This trendline provides technical confluence for intraday traders to manage risk and timing entries.
🟠 Current Market Context: Entering the Reversal Zone
Price is now approaching a marked Reversal Zone (highlighted in orange).
This zone represents a high-probability demand area, previously respected as a base before the rally to supply.
If price reaches this area and shows signs of exhaustion (e.g., bullish engulfing, long wick rejection, volume divergence), it may serve as a reversal point.
This zone aligns with MMC logic — market makers tend to react at zones of trapped liquidity, especially after stop hunts.
📈 Projected Scenario & Trade Setup:
Price drops into the Reversal Zone
A bullish rejection pattern appears (e.g., pin bar, engulfing candle)
Price retests and breaks the descending trendline to confirm a momentum shift
Entry can be taken post-breakout or with aggressive confirmation inside the zone
Stops placed below the zone; targets aligned with the previous QFL or trendline retest
⚠️ Key Notes for Traders:
Don't chase the move. Wait for reversal confirmation before entering.
QFLs offer strong structure-based levels to identify where the market flipped.
Use trendline confluence and volume confirmation for precise entries.
Monitor price action in the Reversal Zone — if invalidated, the downtrend may extend toward the next macro support.
Apply proper risk management and stay patient for the setup to fully develop.
📊 Summary:
🧭 Bias: Short-term bearish → possible reversal bullish
🎯 Entry Area: Reversal Zone (0.85800 – 0.86000 approx.)
⛔ Invalidation: Clean break and close below 0.85700
🏁 Potential Target: First TP near 0.86750; extended TP near 0.87050 (previous QFL level)
🔄 MMC Approach Recap:
This analysis follows the Market Maker Cycle (MMC) method, which involves:
Consolidation (Accumulation)
Manipulation (False Breakouts or Stop Hunts)
Distribution (Rapid Expansion & Flip Levels)
Re-Accumulation or Reversal
Each step is clearly defined in this chart, offering a blueprint for both trend traders and reversal specialists.
💬 Let's Talk:
What do you think about this setup? Are you seeing similar MMC patterns on other EUR or GBP crosses?
Drop your thoughts, charts, and questions below!

MPWR 1D: shoulders are squared and the battery's still fullMonolithic Power Systems broke out of a long-term descending trendline after completing a clean inverse head and shoulders. Now the price is pulling back into the 705–688 zone — a textbook retest area that combines the neckline, the 0.705–0.79 Fib levels, and a major volume shelf. Add to that a golden cross (EMA50 crossing EMA200 from below) and we have a solid technical foundation for continuation. Volume on the pullback is low, indicating no panic, just rotation. If 688 holds, the next levels to watch are 755.66 and 952.17 — the latter being the 1.618 Fib extension. Tactical setup: look for a reversal signal between 705–688, with a stop just below 661. As long as price holds this zone, the bullish structure remains intact.
Fundamentally, MPWR remains one of the strongest names in the semiconductor space. With over $1.5B in annual revenue and industry-leading margins, the company continues to see strong demand from data center and EV sectors. In its latest report, management highlighted accelerating orders from Tier‑1 manufacturers. The balance sheet is clean, with zero debt, and ongoing buybacks provide downside support. In a sector full of volatility, MPWR stands out with both structural reliability and technical clarity - making it a strong candidate for long-term positioning.
If this textbook pattern plays out, the train’s just leaving the station. The best seat is usually the one taken before the doors close.

OSCR: back to support and now it’s decision timeAfter the recent impulse move, OSCR has pulled back to a key support zone around 13.65. That area aligns with the 0.79 Fib retracement, a horizontal level from spring, and a rising trendline that has already triggered reversals in the past. The structure is still intact, and buyers are testing the level again. If support holds and we get a bullish confirmation, the next target is 17.01, followed by a potential breakout toward the high at 22.81.
Volume remains elevated, the overall structure is healthy, and the correction is controlled. A break below 13.00 would invalidate the setup - until then, it’s a clean, high-reward zone with tight risk.
Fundamentally, Oscar Health has revised its 2025 guidance: revenue is expected in the $12–12.2B range, with operating losses projected between $200M and $300M. Despite softening topline growth, earnings per share are improving, and investor sentiment has been shifting. Technical strength is also reflected in the recent rise in RS Rating to 93, confirming that the stock is showing relative leadership even as the market cools.
This is one of those setups where both technicals and narrative are aligning - now we just need confirmation from the chart.

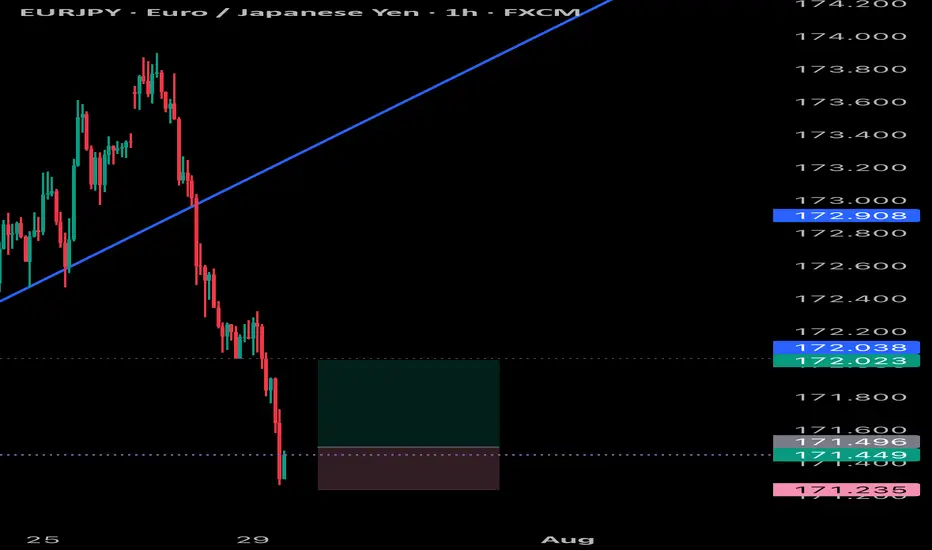
EUROYENEurjpy has shorter pullbacks within an ascending structure ,shall keep following it and expect it to reach a fair mount of highs or levels

BITCOIN BULLYING Bitcoin hit take profit previously and now I will be looking at another buy within this trend and price action combined with patterns

GOLD GOLDEN XauUsd is now still respecting the trend and will keep holding expecting an even stronger push to the up side

LINK - The sleeping Giant ready to wake!Don't forget to add LINK to your watchlist — it's a solid project with long-term investment potential.
The weekly chart shows that LINK is currently retesting the downtrend line it recently broke — a textbook bullish retest.
The lower trendline now acts as a key support level, and as long as price holds above it, the structure remains healthy.
Currently trading around $17.6, the price hasn’t moved significantly yet —
You’ve got:
✅ A strong fundamental project
✅ A bullish technical setup
✅ Large market cap
✅ Still early entry
What more do you need to enter?
Accumulate now... and thank me later.
Best Regards:
Ceciliones🎯

GOLD XAUUSD Gold moving as expected respecting our price and entries, will look for swinging opportunities ,and SL adjustments to BE

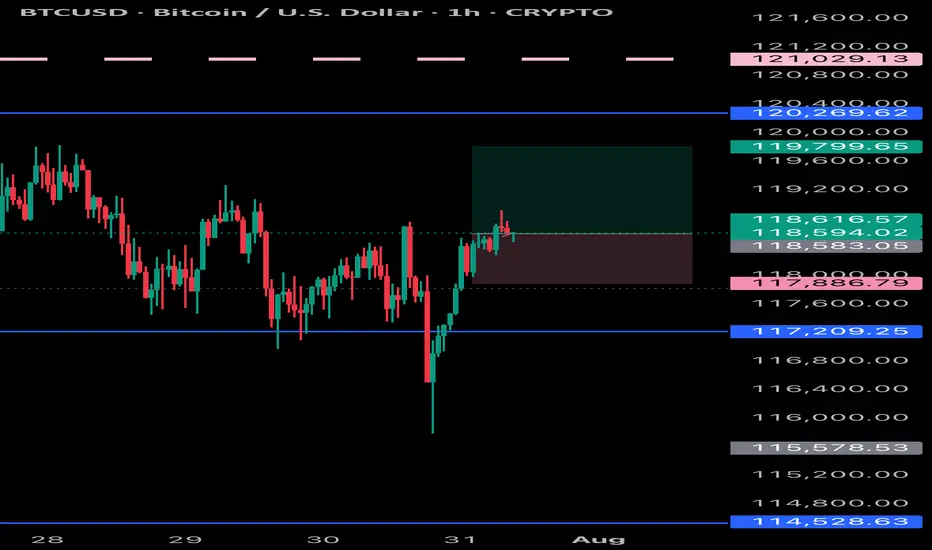
TradeCityPro | Bitcoin Daily Analysis #139Welcome to TradeCity Pro!
Let's go over Bitcoin's analysis. Today, Bitcoin is showing some signs regarding its next move, and today could be a critical day — especially considering that U.S. interest rate data is set to be released tomorrow.
4-Hour Timeframe
Today, there’s no need to switch to other timeframes — this 4-hour chart tells us everything.
Yesterday, the price was moving toward the 120041 area, which we intended to use as a long trigger, but that didn’t happen. The price failed to stabilize above this level, and RSI was rejected from the 61.67 zone.
Currently, the price has formed a lower high compared to 120041 and is now moving toward the support area around 116000.
Selling volume has significantly increased, which is not good for the bullish trend. If this support level breaks, deeper corrections to the 0.618 or even 0.786 Fibonacci levels could occur.
I’ll take profit on my long position that I opened from below 110000 if the price stabilizes below this zone, but I absolutely won’t open any short positions for now.
In my opinion, as long as the price is above 110000, any drop or correction is simply a better entry point for a long position. However, we shouldn’t buy during a falling market — we must wait for our triggers to activate.

GOLD - One n Single Area, what's next??#GOLD... market just reached at his ultimate area as we discussed in our last week analysis and in Friday analysis as well.
The area is 3309-10
Keep close and don't be lazy here.
NOTE: we will go for cut n reverse below 3309 in confirmation.
Good luck
Trade wisley
TradeCityPro | DOGE Faces Resistance with Altseason Tailwinds👋 Welcome to TradeCity Pro!
In this analysis, I want to review the DOGE coin for you. One of the first and most popular shitcoins in crypto, which managed to attract a very strong market cap during the previous bull run due to the hype around Elon Musk.
🔍 Currently, this coin has a market cap of $34.06 billion and ranks 8th on CoinMarketCap.
📅 Daily Timeframe
In the daily timeframe, this coin has created a very strong support level at 0.15190, and now after a bullish leg, it has formed a top at 0.27359.
📊 The buying volume increased nicely during this bullish leg, and the price moved up to the 0.27359 resistance.
✔️ Now, after the first touch, the price has started a slight correction and is moving downward. If further touches occur, we can open a long position after breaking the top.
📈 Breaking 0.27359 could be one of those positions that stays open all the way up to 0.46496, and we can buy this coin in spot using the profit from that trade. I will try to have a position open after breaking 0.27359, aiming for 0.46496.
💥 The next trigger we have is the break of 0.31222, but the price should first form some structure after reaching that area, and only after confirmation should we open a position. Just entering based on that break doesn’t seem logical to me.
🔽 If a correction and drop happen, as long as the price stays above 0.15190, there’s no problem for the trend to continue. But if the price stabilizes below that level, a trend reversal might occur.
📝 Final Thoughts
This analysis reflects our opinions and is not financial advice.
Share your thoughts in the comments, and don’t forget to share this analysis with your friends! ❤️

EURNZD Update: This short trigger could spark a waterfall dropYo traders, Skeptic from Skeptic Lab! 🩵 EURNZD just broke its daily upward trendline, setting up a sharp drop. Weekly shows a fading uptrend. Daily’s got a strong bearish candle, full body, no buyer fight. 4H trendline broke and... more on this video:)
👀Beware of fakeouts this week—volatility’s high! Trade smart, keep risk tight, and don’t FOMO. Share your thoughts in the comments, boost if it helps <3

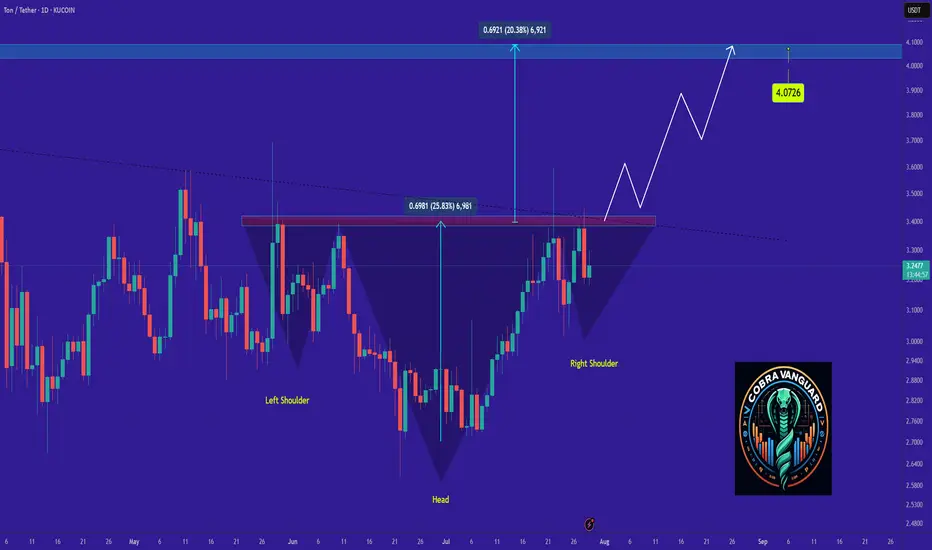
we shall see a good amount of increase in TON price !It seems the price is forming a head and shoulders pattern, which, if correct, suggests a good price increase in the coming days. However, we should wait for the pattern to fully complete.
Best regards CobraVanguard.💚
EURUSD Breakdown Bearish Trend Continues or Demand Zone Reversal🔍 Chart Breakdown: EUR/USD (30-min TF)
Trend Overview:
Previous Trend: Bullish channel structure (highlighted in blue).
Current Momentum: Strong bearish breakdown following a clear range phase.
The chart shifted from consolidation → breakdown → aggressive bearish continuation.
🧱 Key Technical Highlights:
1. Bearish Breakout:
Price broke below the ascending trendline and exited the ranging box, confirming a bearish shift.
Multiple Breakdown Retests (highlighted with red arrows) confirming structure failures and validating resistance zones.
2. Range Zone (Distribution Phase):
Price moved sideways within the green rectangle (“RANGE”), indicating accumulation/distribution before the selloff.
The breakdown from this range confirmed bearish momentum.
3. Demand Zone Test (Now in Play):
Price is approaching/hovering around a demand zone (green box) marked as a critical support.
Buyers may react here, offering two key scenarios:
Bounce back to retest resistance around 1.1600 (highlighted).
Breakdown below demand, leading to further decline toward next major support zones (1.15354 and 1.15040).
4. Price Reaction Zones:
🔴 Resistance zones are clearly marked where breakdown retests occurred.
🟢 Demand zone with bounce-or-break logic provides directional bias.
🧭 Potential Scenarios (Marked on Chart):
✅ Bullish Case:
If demand zone holds, expect:
A corrective rally toward 1.1600–1.1620.
Watch for rejection signals here (could be ideal for re-entering shorts).
❌ Bearish Case:
If breakdown below green demand zone occurs, targets:
1.1535 (local structure support)
1.1504 (next confluence level; possible long-term bounce area)
📈 Indicators:
Ichimoku Cloud: Price is well below the cloud, confirming bearish control.
Structure: Lower highs & lower lows = confirmed bearish trend.

SMCI: When a chart says it’s time to reconnect with the AI hypeOn the daily chart, Super Micro Computer Inc. (SMCI) is showing a clean bullish setup. Price broke out of a descending trendline (green dashed), confirmed it with a retest, and is now consolidating above the breakout zone. The golden cross — where the MA50 crossed above the MA200 — confirms a long-term trend reversal.
Volume profile indicates strong accumulation near $41–43. The 0.5 Fibonacci level at $41.84 acted as support. Above the current range, there’s low volume resistance up to $63.57 (0.786), followed by $66.44 and a final extension target at $79.82 (1.272).
Fundamentals: SMCI is a leading server hardware manufacturer. Demand for their systems has soared with the explosion of AI infrastructure. The company maintains solid financials, with rising quarterly revenue and growing presence in the cloud sector. Institutional investors have been actively increasing their positions since late 2023 — a sign of strong long-term conviction.
Tactical plan:
— Entry: market $42–43
— Target 1: $55.91
— Target 2: $63.57
When technicals scream textbook breakout and fundamentals bring AI momentum to the table — it might just be one of the best late entries in the AI wave this summer.

EURJPY SCALP Eurjpy quick scalp trade as it can still drop so it would be wise to not target higher than normal take profits , but will scalp it
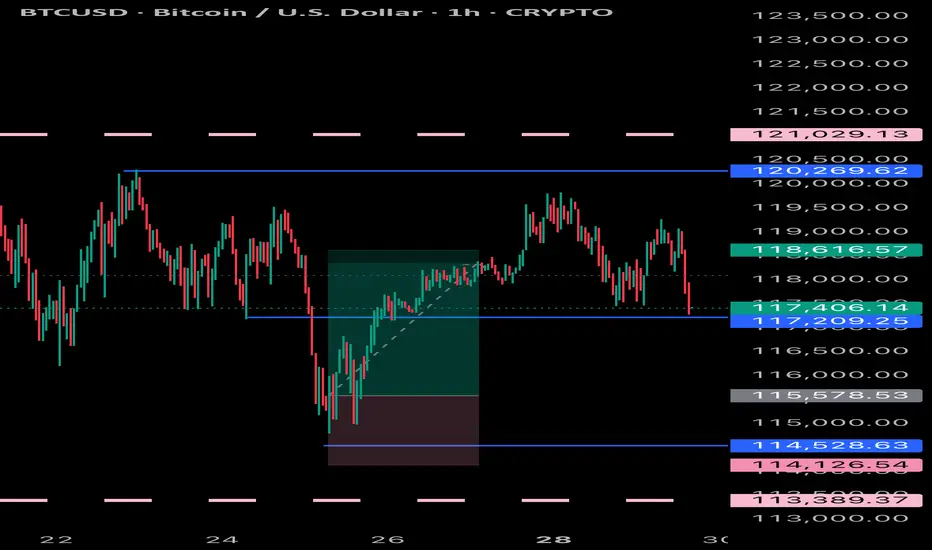
TradeCityPro | Bitcoin Daily Analysis #138👋 Welcome to TradeCity Pro!
Let’s get into the Bitcoin analysis. Today is the start of the week, and it’s very important to begin our trading week with the right analysis and outlook.
📅 Daily Timeframe
On the daily timeframe, as you can see, not much has changed compared to the previous analysis, and the price is still ranging near the supply zone.
✔️ The fact that no price correction has occurred so far shows the strength of the buyers, and even if a correction does happen, as long as the price stays above 110183, the trend will still be considered bullish.
🧩 The main trigger for trend continuation is either the price reaction to the curved trendline or the break of 122733. We can find more optimal triggers in the lower timeframes.
⏳ 4-Hour Timeframe
In this 4-hour timeframe, after a fakeout below 116829, the price corrected down to the 0.5 Fibonacci level and now has returned again to the box between 116829 and 120041.
🔍 The fakeout trigger is 120041, and I’ll try to have at least two positions open in the market when this level breaks — whether on Bitcoin or altcoins.
📈 The main trigger for the next bullish leg is 122733.
If RSI also breaks the 61.67 resistance alongside 120041, the likelihood of the move continuing will increase.
❌ Disclaimer ❌
Trading futures is highly risky and dangerous. If you're not an expert, these triggers may not be suitable for you. You should first learn risk and capital management. You can also use the educational content from this channel.
Finally, these triggers reflect my personal opinions on price action, and the market may move completely against this analysis. So, do your own research before opening any position.
