TradeCityPro | Bitcoin Daily Analysis #134👋 Welcome to TradeCity Pro!
Let’s dive into the Bitcoin analysis and key crypto indices. As usual, in this analysis I will review the New York futures session triggers for you.
⏳ 1-Hour Timeframe
On the 1-hour timeframe, Bitcoin has formed a range box between 116829 and 119395. Yesterday, after getting supported at 116829, it climbed back to the top at 119395.
📊 As you can see, buying volume has increased, which indicates strong buyer momentum.
📈 If 119395 is broken, the price could move toward higher targets like 120594 and 122733.
🧩 This 119395 area is also the breakout trigger of the descending triangle. The bottom at 116829 has supported the price multiple times, and now with the descending trendline being broken, price could aim for higher resistance levels.
👑 BTC.D Analysis
Let’s move on to Bitcoin Dominance. BTC Dominance has been supported at 60.46, which is why Bitcoin is moving upward, while altcoins are dropping.
🎲 The dominance trend is still clearly bearish, and if 60.46 breaks, the next downward leg may begin.
📅 Total2 Analysis
Let’s look at Total2. This index has also formed a range between 1.48 and 1.55, and it is currently sitting at the bottom of the box.
🔔 If we get confirmation of support at 1.48, we can consider entering a long position. The main long trigger would be the break of 1.55.
📅 USDT.D Analysis
This index has also formed a range box. The previous support level was 4.08, which has now shifted to 4.13.
💥 The top of the box is 4.25. Given the bearish momentum in dominance, the probability of 4.13 breaking is higher.
🎲 So keep a close eye on altcoins in the coming days, because a lot of capital is flowing into them and they could see significant pumps.
❌ Disclaimer ❌
Trading futures is highly risky and dangerous. If you're not an expert, these triggers may not be suitable for you. You should first learn risk and capital management. You can also use the educational content from this channel.
Finally, these triggers reflect my personal opinions on price action, and the market may move completely against this analysis. So, do your own research before opening any position.
Tradingview

GOLD - Cut n Reverse Area? What's next??#GOLD... Perfect holdings upside as we discussed in our video and last idea.
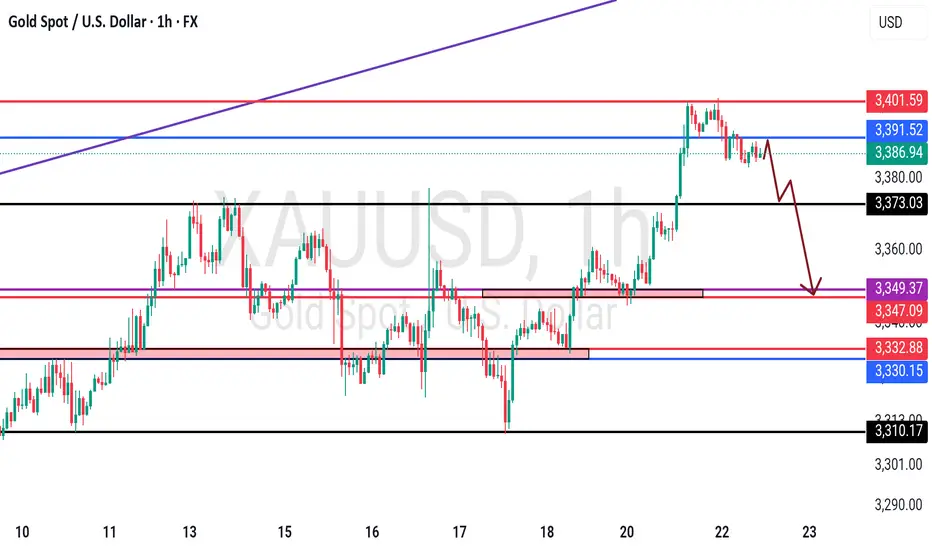
Now 3390-91 is major key level because only above that you can see again bounce otherwise not.
NOTE: we will cut n reverse above 3390-91 on confirmation.
Good luck
Trade wisely
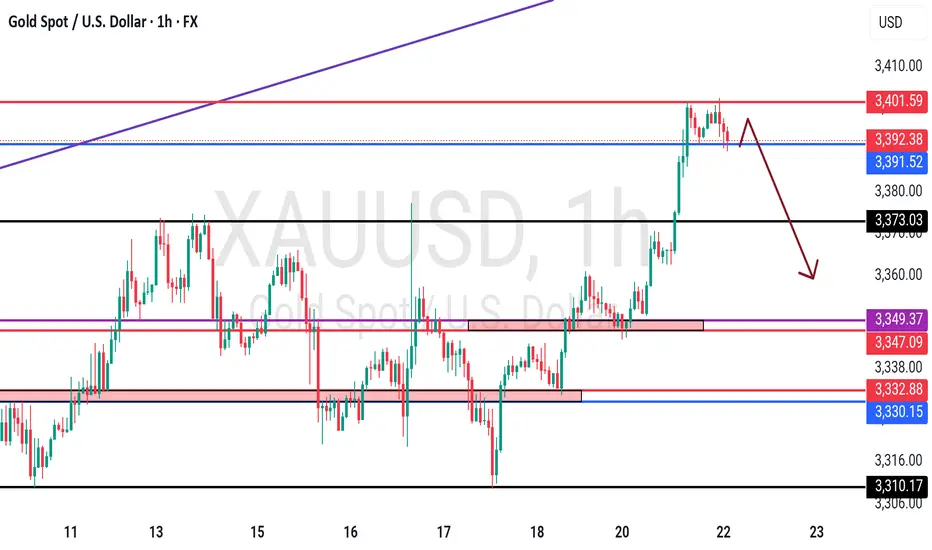
GOLD - at cit n reverse area? What's next??#GOLD... market perfectly moved as per our video analysis and now market just reached at his current ultimate swing area
That is around 3402
So if market holds 3402 in that case selling expected otherwise not.
NOTE: we will go for cut n reverse above 3402 on confirmation.
Good luck
Trade wisely
TradeCityPro | SUI Eyes Breakout with Bullish Momentum Rising👋 Welcome to TradeCity Pro!
In this analysis, I want to review the SUI coin for you. It’s one of the Layer1 projects in the crypto space, currently ranked 13 on CoinMarketCap with a market cap of $13.66 billion.
📅 Daily Timeframe
On the daily timeframe, a lot has changed for SUI since the previous analysis. After breaking the descending trendline, it has started a new bullish trend.
✔️ In the first bullish leg after breaking the trendline, the price reached the 4.0866 zone, and now after a correction, it’s moving upward again.
📈 The 4.0866 level is a very important resistance. In fact, we can draw a resistance range between 3.6402 and 4.0866, as the price tends to behave erratically within this zone.
⭐ Currently, the price has re-entered this range and if 4.0866 is broken, the bullish wave could continue. The first target for this wave could be 5.2689.
🔼 So, if 4.0866 is broken, I highly recommend opening a long position, because if the price truly breaks this level (and it’s not a fake breakout), then the minimum target would be 5.2689.
📊 If the buying volume continues to increase as it is now, and the RSI breaks above 76.64, the chances of breaking 5.2689 will also rise, and the price may even set a new ATH.
👀 I already have an open position on this coin based on lower timeframe triggers, and I’m currently waiting to see the reaction to 4.0866. Based on my entry, if the price moves toward 5.2689, the risk-to-reward ratio will be very high. That’s why I’ve kept part of my position open to potentially capture that move.
🛒 For spot buying, we can also use a futures strategy — meaning if 4.0866 breaks, we open a futures position targeting 5.2689, and then use the profit from that position to buy SUI in spot, gradually building our spot portfolio.
✨ If you are looking at this coin only for spot, the main trigger is the breakout of 5.2689. But be careful — if the price moves aggressively, it might not give you a proper entry trigger, and entering from that area might be difficult.
📝 Final Thoughts
This analysis reflects our opinions and is not financial advice.
Share your thoughts in the comments, and don’t forget to share this analysis with your friends! ❤️

Tesla Trade Breakdown: The Power of Structure, Liquidity & ...🔍 Why This Trade Was Taken
🔹 Channel Structure + Liquidity Trap
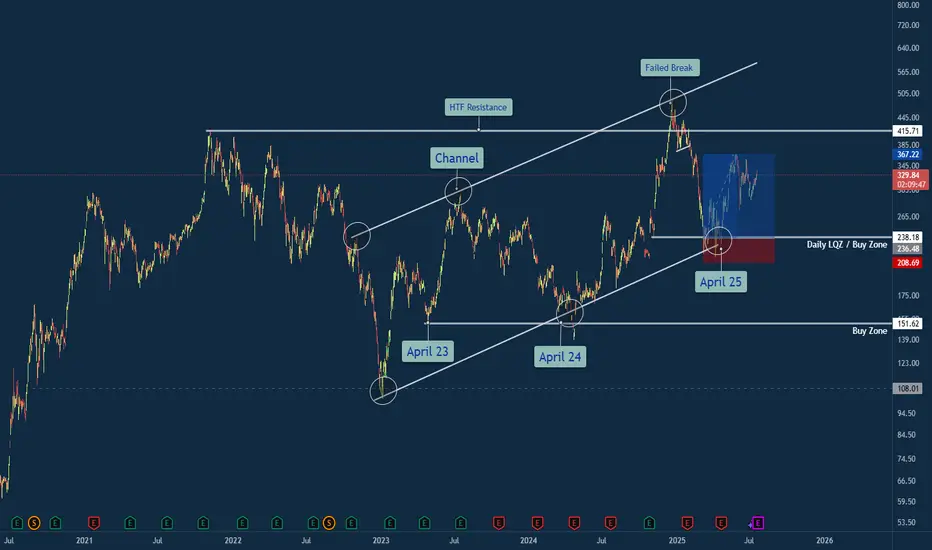
Price rejected from a long-standing higher time frame resistance channel, making a false breakout above $500 — a classic sign of exhaustion. What followed was a sharp retracement into the lower bounds of the macro channel, aligning with my Daily LQZ (Liquidity Zone).
🔹 Buy Zone Confidence: April 25
I mapped the April 25th liquidity grab as a high-probability reversal date, especially with price landing in a confluence of:
Demand Zone
Trendline Support (from April 23 & April 24 anchor points)
Volume spike + reclaim of structure
🔹 Risk/Reward Favored Asymmetry
With a clear invalidation below $208 and targets at prior supply around $330+, the R:R on this trade was ideal (over 3:1 potential).
Lessons Reinforced
🎯 Structure Always Tells a Story: The macro channel held strong — even after a failed breakout attempt.
💧 Liquidity Zones Matter: Price gravitated toward where stops live — and then reversed sharply.
🧘♂️ Patience Beats Precision: The best trades don’t chase. They wait. This was one of them.
💬 Your Turn
How did you play TSLA this year? Were you watching the same channel? Drop your insights or charts below — let’s compare notes 👇
#TSLA #Tesla #SwingTrade #PriceAction #LiquidityZone #FailedBreakout #TechnicalAnalysis #TradingView #TradeRecap #ChannelSupport #SmartMoney
TradeCityPro | Bitcoin Daily Analysis #133👋 Welcome to TradeCity Pro!
Let's dive into the Bitcoin analysis and key crypto indexes. As usual, in this analysis, I’m going to review the triggers for the New York futures session.
⏳ 1-Hour timeframe
On the 1-hour timeframe, Bitcoin has once again dropped to the support area at 116829 and reacted to it. Currently, it is fluctuating above this level.
✨ If 119395 is broken, the price could move toward the highs at 120594 and 122733.
📈 So for a long position, we can enter on the breakout of 119395. Pay attention to Bitcoin dominance, because if it’s in a downtrend, Bitcoin setups might not be ideal, and altcoins may offer better opportunities.
✔️ If the price stabilizes below 117647, it will enter the box between 116829 and 117647, and this time the likelihood of breaking the 116829 bottom and heading toward lower supports for deeper corrections becomes very high.
👑 BTC.D Analysis
Now let’s look at Bitcoin Dominance. BTC.D is still falling and after breaking the 61.45 level, it has reached 60.46.
⭐ If this level breaks, the next bearish leg may begin. The trend is strongly bearish with no visible weakness, and we’ll have to see how long this continues.
📅 Total2 Analysis
Let’s move to Total2. This index has broken the 1.5 resistance and is moving toward 1.62.
💫 At the moment, I don’t have a trigger for it, and we need to wait until its structure gives us the next setup.
📅 USDT.D Analysis
Now let’s look at Tether Dominance. This index has stabilized below the 4.22 level and is now moving downward after a pullback to this area.
🧩 The next support is at 4.08, and the index has room to fall to that level. I still see the USDT Dominance trend as bearish for now.

ABCL: When biotechnology not only curesABCL: When biotechnology not only cures, but also makes your wallet happy!
Hello, fellow investors and those who just like to tickle your nerves on the stock exchange!
Today we have on our agenda (and on the chart) - the stock AbCellera Biologics Inc. (ABCL), which seems to have decided to prove that even at the bottom there is life, and then even throw a party with a breakthrough!
As you can see, our hero ABCL has been playing ‘hide and seek with the trend line’ for a long time, showing an enviable resilience in the fall, just like your sofa after a day at work. However, if you look closely, the ‘ma/ema below price’ signalled that buyers, like secret agents, had already taken control of the situation, preparing for the decisive throw.
And here it is, it's happening! The recent ‘breakout + retest’ is not just a technical term, but a real escape from the ‘bearish’ prison with a subsequent test of strength. Not only did price break through resistance, but it came back to see if it was indeed broken. It's like going out of the house, forgetting your keys, coming back in, getting them, and then going out again - only in the stock market it's a sign of strength and determination!
Now that the dust has settled and the ‘1d’ trendline is behind us, our sights are set on the upside. Targets? Of course! ‘tp1-4.81’ and ‘tp2-6.00’ are not just numbers, they are potential points where we can pat ourselves on the shoulder and say, ‘I told you so!’. А ‘2,618 (6,61)’ - is for the very brave and patient who are willing to wait for the true bull dance.
All in all, ABCL seems to have turned a page in its history, swapping sad ballads for upbeat dance hits. But remember, friends: the market is a capricious thing, and even the most beautiful charts can bring surprises. So, act wisely, don't forget about risks and, of course, enjoy the process! Have a good trading!

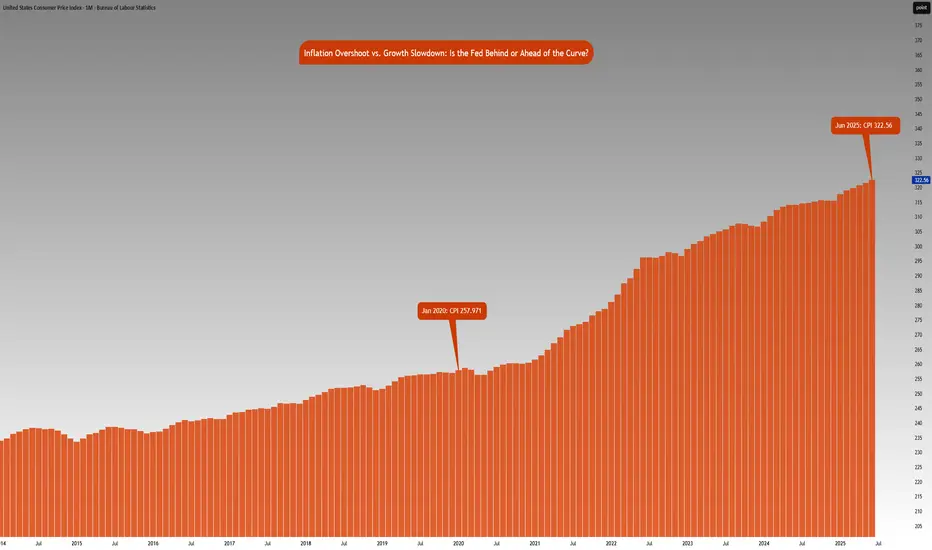
Inflation vs. Growth : Is the Fed Behind or Ahead of the Curve?CME_MINI:NQ1! CME_MINI:ES1! CME_MINI:MNQ1! CME_MINI:MES1! CBOT:ZN1!
Fed Policy recap:
There is an interesting and unusual theme to keep an eye on this week. The Fed is in a ‘blackout period’ until the FOMC meeting- this is a customary quiet period ahead of an FOMC policy meeting. Fed Chair Powell is scheduled to give a public talk on Tuesday. Although his address will be focused on the capital framework of the large banks, this appearance will be closely watched for any subtle signals on the FOMC policy stance.
Especially given that last week, Federal Reserve Governor Chris Waller made a speech, “The Case for Cutting Now” with a purpose as he stated to explain why the FOMC should reduce rate by 25 bps at the July 30th, 2025 meeting.
His stated reasons were:
1. Tariffs create one-off price level increases with transitory inflation effects, not sustained inflation momentum.
2. He argued that much of economic data points towards interest rates should be lowered to FOMC’s participants' median neutral rate, i.e, 3%.
3. His third stated reason notes that while the state of the labor market looks resilient on the surface, accounting for expected data revisions, private-sector payroll growth has peaked, with more data suggesting increased downside risks.
His speech further explains:
• Growth has decelerated sharply: Real GDP rose only ~1% annualized in 1H25, a significant slowdown from 2.8% in 2H24, and well below long-run potential.
• Consumer spending is weakening, with real PCE growth falling to ~1%, and June retail sales showing soft underlying momentum.
• Broader labor market indicators, including the Beige Book and JOLTS data, show declining labor demand and hiring caution, suggesting increasing downside risks to employment.
• Inflation is slightly above target (PCE ~2.5%) but driven primarily by temporary, one-off tariff effects. Core inflation ex-tariffs is likely near 2%, and expectations remain anchored.
• Current fed funds range (4.25%–4.50%) is well above neutral (3%), implying excessive restraint.
• With inflation risks subdued and macro conditions deteriorating, a preemptive rate cut now provides optionality and avoids falling behind the curve if the slowdown deepens. Further cuts may be warranted if trends persist.
• The tax bill contains pro-growth provisions, but its economic impact is expected to be minimal in 2025.
Source: Federal Reserve Speech, The Case for Cutting Now Governor Waller
Inflation Analysis:
Let’s compare this with what we have previously mentioned regarding inflation. CPI index stood at 257.971 points in January 2020. Projecting this at a 2% Fed target, June 2025 inflation should be around 287.655 points. However, June 2025 inflation is currently at 322.56 index points, 12.2% higher above 2% the inflation trend. Effectively, this means annualized inflation since January 2020 is roughly 4.15%.
The Fed is in a real dilemma whether cutting rates given the inflation trend in the last 5 years and risks to inflation outlook justify cutting rates.
Key Questions to ask
Markets are forward looking. Investors and participants want to know:
• How will the rates impact the cost of debt service? Currently the third largest government expenditure, over $1.03 trillion.
• Will the tariff rate offset the tax revenue losses by extending tax cuts?
• Is the fiscal path sustainable?
• What happens to the long end of the yield-curve?
• Will the Fed monetize the debt issuance imbalance?
• Is this simply Governor Waller positioning himself for the next appointment of Fed Chair when Fed Chair Powell’s term expires in May 2026?
It seems there is a huge conflict between longer term implications vs quick short term fixes that align with US administration objectives.
The Week ahead:
It is a relatively light economic calendar in the US. Flash PMI readings and housing data on the docket. The primary focus as it has been for most weeks since President Trump took office, will be on the developments in trade policy and any further comments on Fed and Chair Powell. The threat of renewed tariffs starting August 1st, is also key to monitor and whether these protectionist measures will force US’s trading partners to make further concessions to negotiate trade deals.
The earnings season is off to a good start with major US banks reporting higher EPS and revenue than expectations. This week investors will be looking at Q2 earnings reports from Alphabet, Meta, Microsoft from the Mag 7 and Tesla.
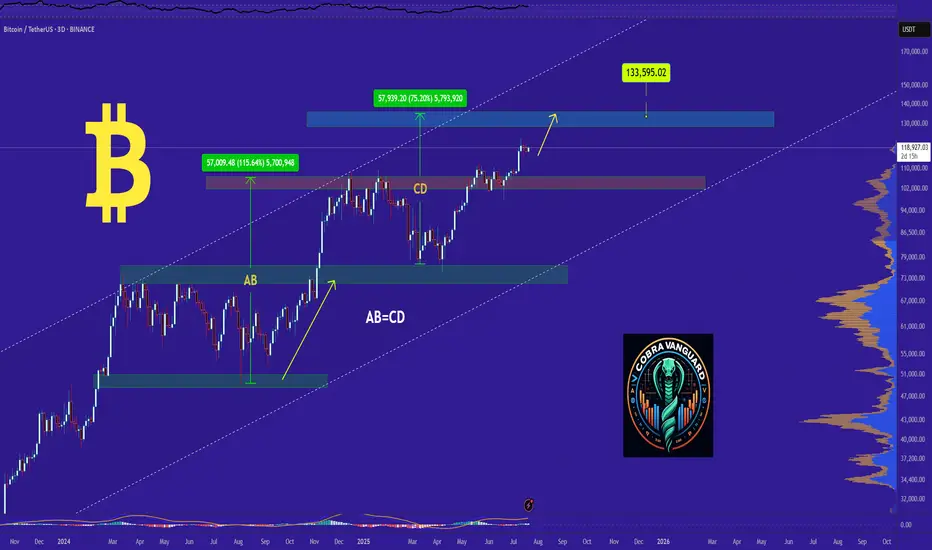
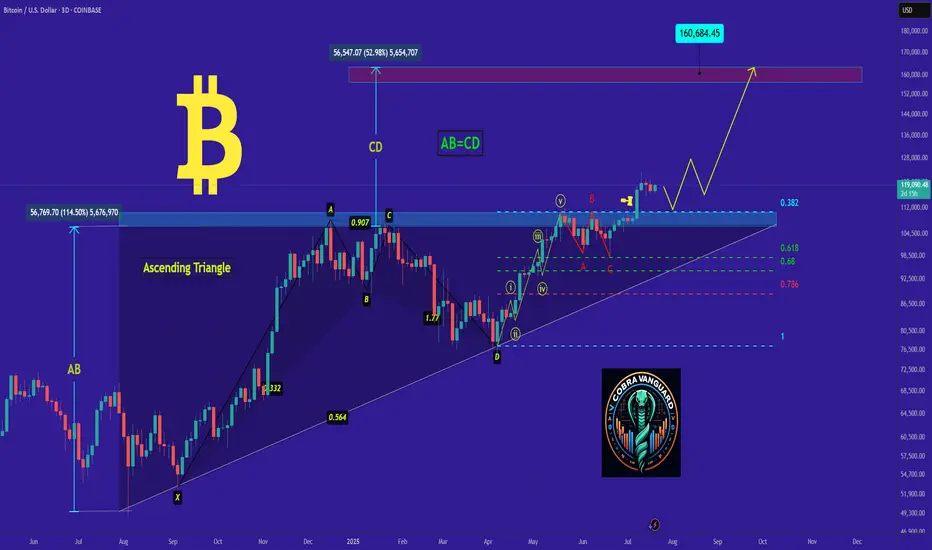
𝐛𝐢𝐭𝐜𝐨𝐢𝐧's Situation, A Comprehensive Analysis !!!As I said, Bitcoin broke the triangle, and now with a slight price correction, it could surge to $160,000, and you still think I'm joking!!
Previous analysis
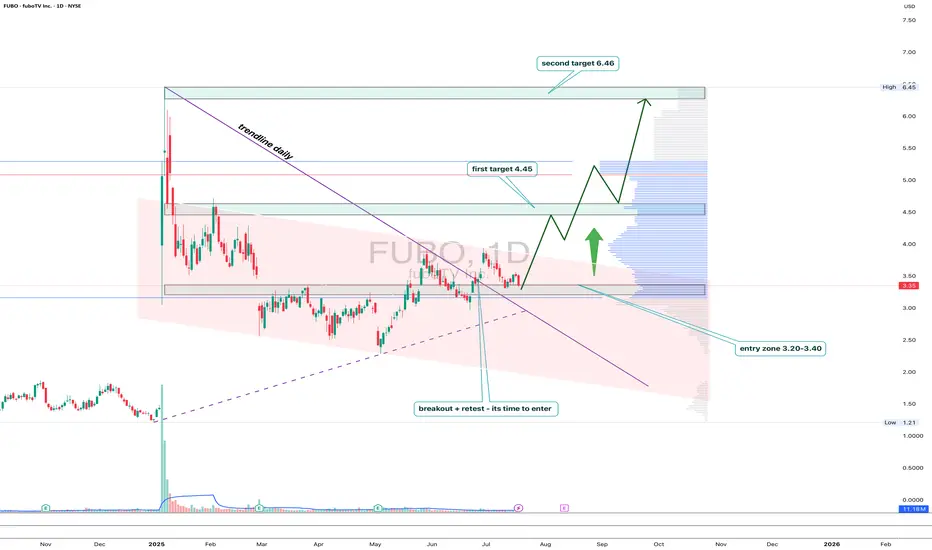
FUBO: trendline breakout with a subscription to $6.46FUBO has broken out of the descending trendline on the daily chart, followed by a clear retest and consolidation above the key 3.20–3.40 area. This zone coincides with the 0.5 Fibonacci retracement and high-volume support, confirming strong buyer interest.
As long as price holds above 3.20, the setup looks bullish with targets at 4.45 (0.382), 5.22, and finally 6.46 — the major resistance and top of the current range. Volume picked up on the breakout, validating accumulation from bigger players.
Fundamentally, FuboTV remains a niche contender in the sports streaming market. With optimized spending and new partnerships with major sports leagues, interest may spike ahead of events like the Olympics and NFL season.
Tactical setup:
— Entry zone: 3.20–3.40
— Must hold: above 3.20
— Targets: 4.45 / 5.22 / 6.46
— Invalidation: break below entry without buyer confirmation
This breakout might just be FUBO’s ticket to prime time.
EUR/CHF Update: I just found out the next big triggerHey friends 🩵, hope you’re kicking off the week with a great vibe! It’s Skeptic from Skeptic Lab . In this video, I’m diving into EUR/CHF .
We’re stuck in a range box right now, and knowing this setup will help you miss fewer opportunities. Don’t forget money management, dodge FOMO, and have a plan for different scenarios. I also explained in the video why I personally prefer opening a short position. So, let’s get started!

TradeCityPro | LDO Breaks Out Amid Altseason Hype Shift👋 Welcome to TradeCity Pro!
In this analysis, I’m going to review the LDO coin for you. It’s one of the well-known DeFi projects in crypto with the highest TVL in this category, and the LDO coin ranks 82 on CoinMarketCap with a market cap of $1.08 billion.
📅 Daily timeframe
On the daily timeframe, LDO has been in a range box for several months and is now starting to break out of it.
💥 After being supported at the 0.683 bottom, a large amount of buying volume entered, and a sharp bullish move occurred from this bottom to the top of the box. The RSI has also entered the Overbuy zone.
🔔 The overextended level on the RSI oscillator is 79.66, which has even been broken during this leg. Right now, I think the probability of a correction is quite high.
🔍 Yesterday's candle made a deep penetration into the top of the box, and currently, the price is sitting above the box. Since RSI is in the overextended zone, a pullback or short-term rest is likely.
🚀 However, considering the current uptrend, I believe this bullish leg might be ending, and we could see a few corrective candles. But after the correction ends, a new bullish leg might begin, pushing the price toward the resistance levels at 1.480 and 2.382.
🛒 For a long position or a spot buy, we can enter during this new bullish leg once the top breaks and a confirmation of a new wave starting is in place.
📝 Final Thoughts
This analysis reflects our opinions and is not financial advice.
Share your thoughts in the comments, and don’t forget to share this analysis with your friends! ❤️

TradeCityPro | Bitcoin Daily Analysis #132👋 Welcome to TradeCity Pro!
Let’s dive into the Bitcoin analysis and key crypto indices. As usual, in this analysis I’ll review the futures triggers for the New York session.
📅 1-Hour timeframe
On the 1-Hour timeframe, as you can see, Bitcoin is still holding the key support at 116829 and has been ranging between 116829 and 118440 since yesterday.
✨ Today, if the 118440 level breaks, we can open a solid long position. However, I still believe that due to Bitcoin Dominance being in a downtrend, altcoins are a much better choice for opening positions.
✔️ If you're only planning to trade Bitcoin, this trigger is suitable. The next entry points would be 120594 and 122733. If we open positions at all three triggers and the market moves upward, we can get strong risk-to-reward setups since we’ve entered with significant volume across three positions.
📊 If the 116829 level breaks downward, we might see sharper corrections. In that case, the next supports will be the 0.5 and 0.618 Fibonacci levels.
👑 BTC.D Analysis
Looking at Bitcoin Dominance, as you can see, the trend is heavily bearish and moving downward.
⭐ The downtrend in dominance is quite steep, and the next support we have is at 60.49. There’s still room for dominance to drop to this level.
📅 Total2 Analysis
Moving to Total2, yesterday the 1.46 trigger was activated and price moved to 1.5, and it is now sitting just below that level.
💫 If this level breaks, another bullish wave towards 1.62 could form.
📅 USDT.D Analysis
Looking at Tether Dominance, this index is also in a downtrend similar to Bitcoin Dominance, which shows that money is exiting both Bitcoin and Tether and entering altcoins.
🎲 So keep a close eye on altcoins in the coming days, because a lot of capital is flowing into them and they could see significant pumps.
❌ Disclaimer ❌
Trading futures is highly risky and dangerous. If you're not an expert, these triggers may not be suitable for you. You should first learn risk and capital management. You can also use the educational content from this channel.
Finally, these triggers reflect my personal opinions on price action, and the market may move completely against this analysis. So, do your own research before opening any position.

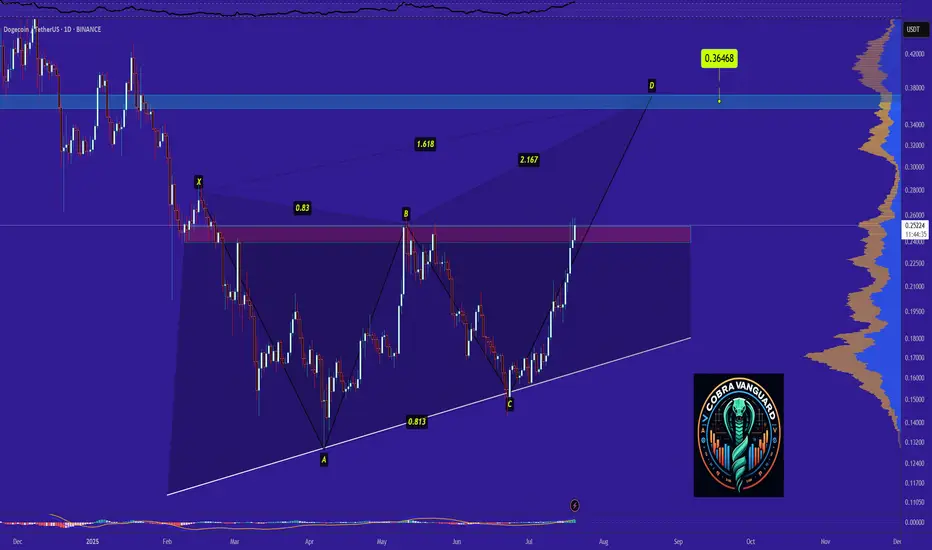
Dogecoin - Time to buy again!So if you pay attention to the DOGE chart you can see that the price has formed a Ascending Triangle which means it is expected to price move as equal as the measured price movement.( AB=CD )
NOTE: wait for break of the triangle .
Best regards CobraVanguard.💚
Polish zloty in trouble: Swiss franc is sharpening its teethTechnically, CHFPLN has completed a consolidation phase within a narrowing triangle and broke to the upside. The pair is now testing the 4.60 level (the 0.618 Fibonacci retracement) from below — a decisive zone. A breakout and confirmation above this area opens the path toward 4.705, which coincides with the 0.5 Fibo level and a local resistance. A pullback from that zone back to 4.60 is possible, but this time as a support retest. If the level holds, the targets remain: 4.91 and 5.13 - both marked by Fibonacci extensions and major long-term horizontal resistance. The EMAs are aligned in support of further upside, with price consistently trading above them.
Fundamentally, the Swiss franc remains a safe-haven currency, especially amidst increasing instability in the Eurozone. Weak growth in Germany, looming ECB policy easing, and rising inflationary pressures are all tilting investor interest toward CHF. Meanwhile, Poland faces political uncertainty, budgetary debates, and volatility in the agricultural and energy sectors. All of this strengthens the case for the franc in this pair.
Tactically, the game plan is straightforward: a confirmed breakout above 4.60 signals the start of a bullish impulse. The 4.60–4.705 zone is the key area of interest for buyers. If this zone is reclaimed and held, the next targets - 4.91 and 5.13 - remain valid, where large players may look to take profits.
If this scenario plays out, the zloty may soon be tuning into Polish radio to sing nostalgic songs about the golden days of its strength.

TradeCityPro | ICP Eyes Breakout as Altseason Speculation Grows 👋 Welcome to TradeCity Pro!
In this analysis, I want to review the ICP coin for you—one of the DePIN and AI-related coins, ranked 37 on CoinMarketCap with a market cap of 3.11 billion.
📅 Daily timeframe
As you can see on the daily timeframe, a ranging box has formed around the key support at 4.648, and price is fluctuating inside this box.
🔔 The top of the box is at 6.205, and price has touched it multiple times. It just wicked into it again and got rejected.
📈 This level has become a very important resistance. If it breaks, we can enter a long position—and it’s even suitable for a spot buy.
🛒 I already hold this coin in spot from lower entry points and don’t plan to increase my spot volume, but I’ll open a futures position if 6.205 breaks.
🔽 If Bitcoin Dominance moves downward, the 6.205 trigger will be a very good entry point. A break above 70 on the RSI will also be a strong momentum confirmation.
📊 If price gets rejected from the top of the box and drops to the 4.648 support, we can open a short position in lower timeframes. A break below 4.648 would confirm the bearish outlook.
📝 Final Thoughts
This analysis reflects our opinions and is not financial advice.
Share your thoughts in the comments, and don’t forget to share this analysis with your friends! ❤️

Miss This Watchlist, Miss Next Week’s OpportunitiesHey friends,it’s Skeptic 🩵 hope you’re having a great weekend!I know it’s the weekend, so a lot of you are probably chilling away from the charts, but for some, trading’s such an addiction that even weekends can’t keep you away. In this video, I’m gonna break down my weekly watchlist for you. Knowing it will help you miss fewer good opportunities, avoid FOMO, and have a plan ready for different scenarios and events.
Don’t forget money management , and stay clear of FOMO. & if it helped smash that boost bottom and follow for more !

Ripple Update: Is XRP Ready for Another 500% Growth?Hey friends, it’s Skeptic 🩵 . In this video, I’m giving an update on Ripple’s conditions , reviewing past triggers, and what to do with your long positions in futures if you’re still holding. For spot, what’s the move? I dove into XRP/BTC analysis and, at the end, broke down BTC.D , which just had a major event you need to pay close attention to. Don’t forget money management, and stay clear of FOMO. Drop your thoughts on XRP in the comments so we can chat about it!

BITCOIN's Situation (1h) !!!The price is within an ascending triangle, which could be encouraging. However, since crypto doesn't always follow patterns, it might break down from below and correct to around $115K!
Best regards CobraVanguard.💚

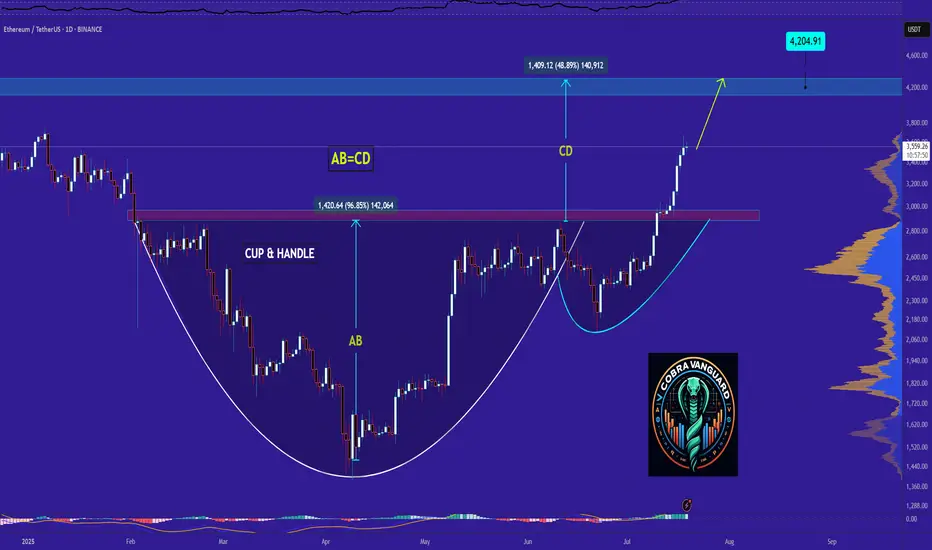
Ethereum - Time to buy again!Exactly, based on previous analyses, the price is rapidly approaching $4,000. But we need to be cautious because whenever it hits round numbers, something big usually happens!!!
previous analysis
Best regards CobraVanguard.💚
Psychology Is 80% of Trading SuccessPsychology Is 80% of Trading Success – But Most Traders Still Ignore It
Have you ever followed a perfect setup… and still lost money?
You entered at the right level.
The trend was clear.
Confirmation was solid.
But you closed the trade too early.
Or held onto a losing trade far too long.
Or took a revenge trade just to “get it back.”
This isn’t a strategy problem – it’s a psychological one.
💡 Most traders don’t fail due to poor analysis – they fail because they lose control of themselves
Let’s break down three real-world scenarios that almost every trader has experienced at some point:
🎯 1. Closing profitable trades too early – fear of giving it back
Example:
You long XAUUSD from 2360, targeting 2375.
As price hits 2366, you panic and exit early, fearing a reversal.
Later, the price hits 2375 without you.
➡️ This is classic loss aversion — where the fear of losing small gains outweighs the logic of sticking to your plan.
🎯 2. Holding onto losers – hoping the market will turn
Example:
You short EURUSD expecting a pullback, but price breaks resistance and climbs.
Instead of cutting your losses, you widen your stop and hold on.
The loss grows, and you exit in frustration.
➡️ This is denial – refusing to admit you're wrong, letting hope override discipline.
🎯 3. Increasing risk after a winning streak – “I can’t lose” mindset
Example:
After two wins, confidence spikes. You double your position size, despite a weaker setup.
One loss later – your previous gains are wiped out.
➡️ This is overconfidence bias – common after wins and extremely dangerous to consistency.
📊 Technical knowledge accounts for 20% of success – the remaining 80% lies in mindset and behaviour
You can:
Understand market structure
Use advanced indicators
Develop a robust strategy
But if you:
Ignore your stop-loss
Trade out of boredom or revenge
Break rules when under pressure
Then your edge disappears.
Your system becomes irrelevant if your psychology breaks down.
🧠 5 Practical Ways to Strengthen Your Trading Psychology
✅ Keep a trading journal – especially note your emotions
Ask yourself: “Was this trade part of my plan, or based on impulse?”
✅ Never adjust SL or TP mid-trade
Stick to your original parameters. Trust your plan, not your feelings.
✅ Use demo accounts to practise discipline, not just execution
Treat them like live accounts. Emotions will surface if you're honest.
✅ Pause trading after consecutive losses
Two losses in a row? Step away for 24 hours. Protect your decision-making clarity.
✅ Learn to wait – no trade is often the best trade
Patience is a trader’s secret weapon. Pros trade less, but with precision.
🔁 Trading isn’t about predicting the market – it’s about managing yourself within it
A 55% win-rate system can make you consistent profits
If you’re disciplined, calm, and structured.
But…
A 70% win-rate system can still blow your account
If your emotions are calling the shots.
🎯 Final Thought:
Financial markets don’t reward traders with the best strategy.
They reward those who stay rational under pressure.
You don’t need to be the smartest person in the room.
You don’t need a complex system.
But you do need emotional control, patience, and trust in your process.
Knowledge helps you spot the trade. Psychology helps you survive it.
🔔 If you found value in this, follow me for more content on trading mindset, discipline, and long-term consistency – because true success begins in the mind.

BABA: triangle with tensionOn the weekly chart, BABA has already formed a golden cross - price is above both MA50 and MA200, confirming a bullish trend shift. The stock is now approaching the upper edge of the symmetrical triangle and the key resistance at $122, which also aligns with the 0.5 Fibonacci level.
The numbers inside the triangle represent the contraction phases, not Elliott waves. This is a classical consolidation before a potential breakout. If the $122 level is broken and retested, upside targets are $128 (0.618), $137 (0.786), and eventually $148–181 (1.0–1.618 extension).
Volume is rising, MACD is flipping bullish, and RSI is climbing out of oversold territory — all signs point to growing bullish momentum.
Fundamentally, Alibaba benefits from China's economic rebound, possible regulatory relief, and ongoing share buybacks. With Chinese tech rotating back into favor, BABA could lead the rally.
So if you're still waiting for a signal - it's already here. The golden cross is done, price is flying above moving averages, and all that’s left is a clean breakout. Watch $122 — that’s the launchpad.
