TBO TEK LTD – 19 May Trendline Resistance Test Incoming 📌 Trade Plan (Aggressive Swing Setup):
Buy above: ₹1,250 (on breakout + volume confirmation)
Stoploss: ₹1,195
Target 1: ₹1,310
Target 2: ₹1,385
Sell Below: ₹1,180 (if price rejects the trendline with high volume)
🔎 Technical Insights:
Strong volume buildup near resistance
RSI trending upwards with bullish momentum
Trendline acting as dynamic resistance since Nov 2024
For Education Purposes Only
Tradingviewindia

PEL | Breakout Setup | Short-Term Buy | Target ₹1100🟩 Trade Plan:
Buy Zone: ₹1059 – ₹1060
Target: ₹1100 (approx. 3.77% upside)
Stop Loss: ₹1037
Risk-Reward Ratio: ~2:1
Setup Type: Breakout above resistance zone (marked on chart)
Volume Confirmation: Strong bullish candle with high volume
RSI Confirmation: RSI bouncing above 60, momentum building
📈 Chart Annotations (TradingView Tips):
Draw resistance zone on 1H around ₹1060 – ₹1070 (breakout zone)
Plot EMA (9 & 21) or EMA crossover to confirm short-term bullish trend
Use RSI (14) to highlight momentum breakout
Highlight entry point, stoploss, and target with labels
Use TradingView’s “Long Position Tool” to visually display RR
For Education Purposes only

OIL – Oil India Ltd | Target: ₹429.00🟢 Trade Details:
LTP: ₹417.30
Recommended Buy Range: ₹415.50 – ₹416.00
🎯 Target: ₹429.00
🛑 Stop Loss: ₹408.70
🔍 Technical Snapshot:
✅ Strong bullish candle with volume confirmation
✅ EMA crossover supports the uptrend (9 EMA > 13 EMA)
✅ RSI at 62.22 shows healthy momentum
✅ Breakout above previous range box visible on Daily & 1H TF
📊 BB %B at 0.82 – still room before overbought levels
💼 Strategy:
Suitable for short-term MTF holding (2–5 days)
Risk-Reward ~1:1.5
Trail SL to cost once ₹424+ is breached
Use smaller timeframes (15m / 1H) to confirm entry with volume
For Education Purposes Only

GOLD - At CUT N REVERSE area? holds or not??#GOLD... perfect bounced from bottom and market constant showing buying scenarios.
Buy now market at his one of the most important n expensive area that is 3237
Keep close 3237
We will go for cut n reverse below that on confirmation.
Don't holds buying below 3237
Good luck
Trade wisely

ENDURANCE – Breakout from Supply Zone | Target ₹2136 ⚙️ ENDURANCE TECH LTD (NSE:ENDURANCE)
Time Frame: 15min / 1 Hour
📊 Trade Type: Positional / Intraday Momentum
📌 Buy Zone: ₹2042 (Above supply zone breakout)
🎯 Target 1: ₹2136
🎯 Target 2: ₹2287
🛑 Stop Loss: ₹1915
📈 CMP: ₹2022.60
📌 Chart Insights:
✅ Strong volume breakout from horizontal resistance
✅ Cleared EMA 9/13/26 crossover
✅ RSI > 60 indicates bullish momentum
✅ Bollinger Band breakout (BB %B > 1.00)
✅ Breaking above pivot R2 zone (₹2042) opens room to R3
⚠️ Strategy:
Enter on confirmation above ₹2042 with volume support on 15min or 1H timeframe.
Stop loss below breakout candle or EMA cluster around ₹1915.
Trailing stop as it approaches targets.
For Education Purposes Only

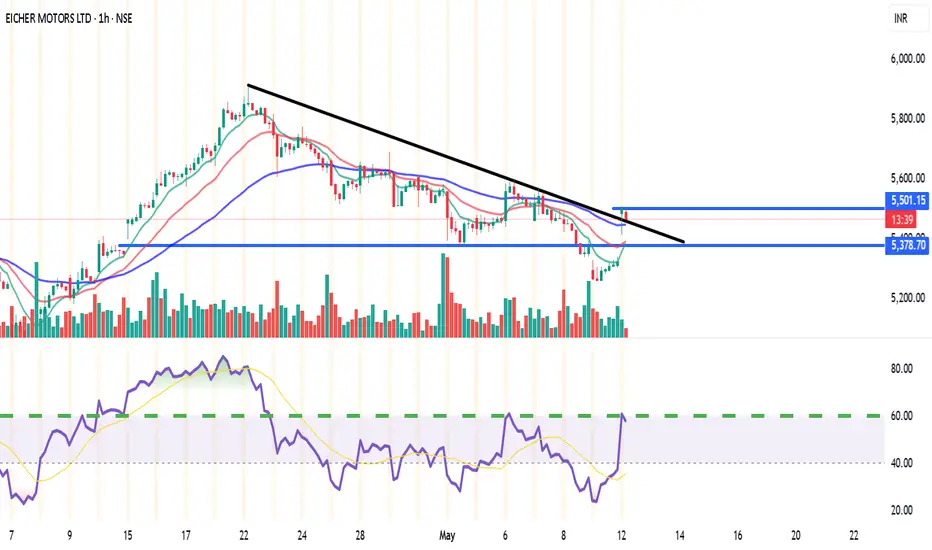
EICHERMOT (NSE) – Bullish Setup on 15min & 1H🔑 Trade Plan:
📥 Buy Above: ₹5485 (above current resistance & candle body highs)
🎯 Targets:
T1: ₹5527 (Pivot R1)
T2: ₹5555
🛡️ Stop Loss: ₹5380 (below 13 EMA & Supertrend support)
📊 Technical Signals:
RSI: 58.08 – Bullish momentum, still room to run
%B (BB): 0.77 – Close to breakout from upper band
EMA Crossover: 9 EMA > 13 EMA – Short-term bullish crossover confirmed
Supertrend: Support at ₹5322, aligning with bullish reversal
Volume: Spike during recent green candles signals strong buying interest
⚙️ Strategy Notes:
Use 15min chart for entry timing post breakout
Tighten SL to cost after T1 hits
Ideal for short-term intraday/swing traders
For Education Purposes Only
PB Fintech (NSE: 543390) Trade Setup📈 Breakout Watch | Price retesting key pivot at ₹1,745
Momentum building with RSI > 60 and bullish structure. Ideal for intraday or short swing.
🔵 Long Entry
Buy Above: ₹1,745 (Pivot breakout confirmation on 15m/1H candle close)
Target 1: ₹1,775 (minor resistance)
Target 2: ₹1,807 (next pivot)
Target 3: ₹1,869 (final swing target)
Stoploss: ₹1,720 (below previous candle low/support zone)
✅ Volume confirmation and RSI strength supporting move
🧠 Good for breakout traders looking for momentum continuation
🔴 Short Setup (if rejection from ₹1,745)
Sell Below: ₹1,730 (on rejection + bearish candle)
Target: ₹1,682
Stoploss: ₹1,745
📊 Indicators:
RSI: 65.7 → bullish, near breakout threshold
BB% B: 0.88 → strong bullish move near upper band

SHYAM METALICS – Breakout Zone Alert Price is approaching a key resistance zone (~₹950) after breaking out of a descending channel with strong volume and RSI confirmation.
This setup indicates potential bullish continuation.
📌 Trade Plan:
Buy above ₹955
Stoploss: ₹915
Target 1: ₹1,010
Target 2: ₹1,065
Sell below: ₹915 (only if price rejects resistance with volume)
Reasoning:
Price broke long-term downtrend
Strong volume and RSI > 60
Clean resistance breakout in sight
For Education Purposes Only

GOLD - at resistance? holds or not??#GOLD - perfect bounce from multi weeks bottom and now marekt near to his current resistance area that is around 3179 80 keep close it and if market hold it in that case we can expect a drop from here.
keep close and dont be lazy here.
good luck
trade wisely

GOLD - where is current resistance? Holds or not??#GOLD.. in yesterday market placed a low around 3167-68 and bounced back.
Now market just near to his current resistance area that is around 3184-85
Keep close that area and if market hold it in that case we can expect a further drop..
NOTE: we will go for cut n reverse above 3184-85 on confirmation ..
Good luck
Trade wisely

MKVENTURES CAPITAL – Positional Breakout Setup📈 Buy Above: ₹1,700 (Breakout Zone)
Stoploss: ₹1,630
Target 1: ₹1,790
Target 2: ₹1,880
🔹 RSI is bullish, above 60
🔹 Strong volume build-up
🔹 Near resistance zone – breakout likely
📉 Sell Below: ₹1,630 (Trend Reversal)
Stoploss: ₹1,700
Target: ₹1,550
📊 Chart: Daily
📌 Strategy: Resistance Breakout with RSI & Volume Confirmation
💡 Risk-Reward: 1:2 (Good for swing trade)
For Education Purposes Only

SILVER - ultimate area, short only below that..#SILVER.. market placed a very reasonable low in yesterday tha tis around 32.08 and bounced back.
Keep close that area because that is our ultimate area in today and if market break that level then we will go for short means ....!
That is our cut n reverse area if you are convinced in long.
Good luck
Trade wisely

ADITYA BIRLA CAPITAL LTD – Trend Reversal Breakout Trade🧠 Technical Highlights:
Downtrend Channel Breakout: Clear breakout from a falling channel pattern
Resistance Break: Strong breakout above supply zone of ₹204–₹210
Volume: Massive volume spike validates bullish strength
RSI: Above 70, indicating strong momentum but not overbought yet
🟢 Buy Setup
Buy Above: ₹219 (today's close confirms breakout)
Stoploss: ₹204 (below the previous resistance/new support)
Target 1: ₹235
Target 2: ₹248
Target 3: ₹260+ (swing/high-risk high-reward)
🔻 Sell/Short Setup (only if reversal)
Sell Below: ₹203
Stoploss: ₹210
Target: ₹190, ₹178
📅 Timeframe: Short-to-Medium Term (2–6 weeks)
📊 Risk-Reward: ~1:2.5
For Education Purposes Only

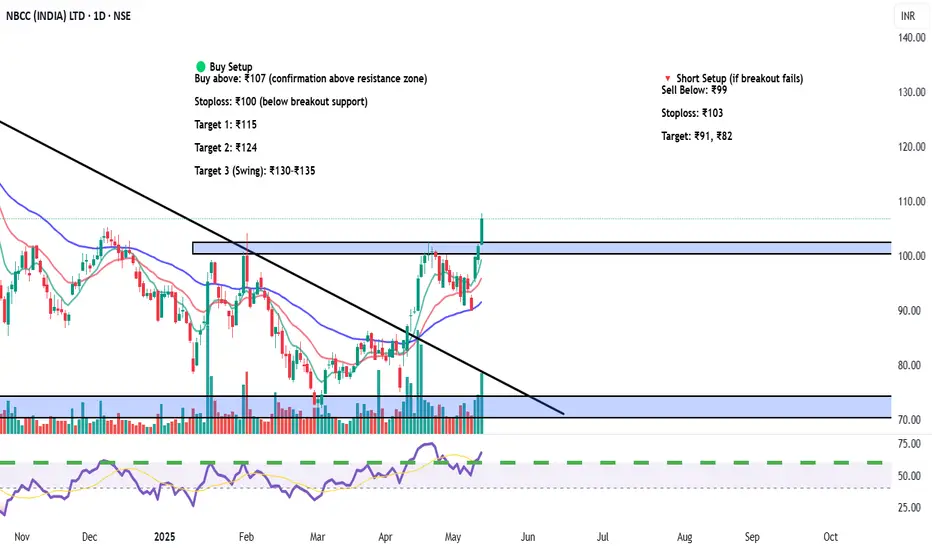
NBCC (India) Ltd (NSE: NBCC) – Breakout Trade Setup🧾 Equity Research Summary – NBCC (India) Ltd.
Sector: Construction & Infrastructure – Government PSU
Technical Setup: Trendline breakout + Base retest + Volume surge
Support Zone: ₹68–₹75
Breakout Zone: ₹100–₹103
Upside Potential: Strong move expected due to order book + infra push
Catalyst:
Government infrastructure spending
Order wins from CPWD, NBCC contracts, redevelopment projects
📅 Timeframe: Short-to-Medium Term (2–4 weeks)
📊 Risk-Reward: 1:2.5
🟢 Buy Setup
Buy above: ₹107 (confirmation above resistance zone)
Stoploss: ₹100 (below breakout support)
Target 1: ₹115
Target 2: ₹124
Target 3 (Swing): ₹130–₹135
🔻 Short Setup (if breakout fails)
Sell Below: ₹99
Stoploss: ₹103
Target: ₹91, ₹82
For Education Purposes Only
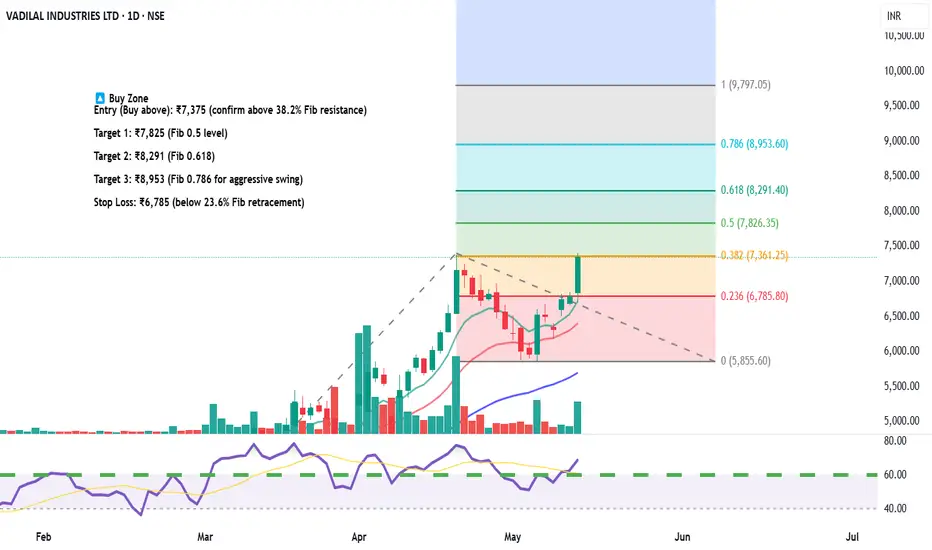
Vadilal Industries – Equity Trade Setup & Research View🟢 Long Trade Setup (Bullish Reversal Play)
Current Price: ₹7,346.50
Fibonacci Level Tested: 38.2% at ₹7,361 — a crucial breakout level
Trendline Breakout: Price has broken above falling trendline with volume confirmation
RSI: Near 60 – bullish momentum building
🔼 Buy Zone
Entry (Buy above): ₹7,375 (confirm above 38.2% Fib resistance)
Target 1: ₹7,825 (Fib 0.5 level)
Target 2: ₹8,291 (Fib 0.618)
Target 3: ₹8,953 (Fib 0.786 for aggressive swing)
Stop Loss: ₹6,785 (below 23.6% Fib retracement)
🔻 Short Trade Setup (if rejection happens)
Sell Below: ₹7,200
Target: ₹6,785
Stoploss: ₹7,375
📅 Timeframe: Daily (1D)
📊 Risk/Reward Ratio: 1:2.5+
🔁 Valid for: Next 2–4 weeks
For Education Purposes Only
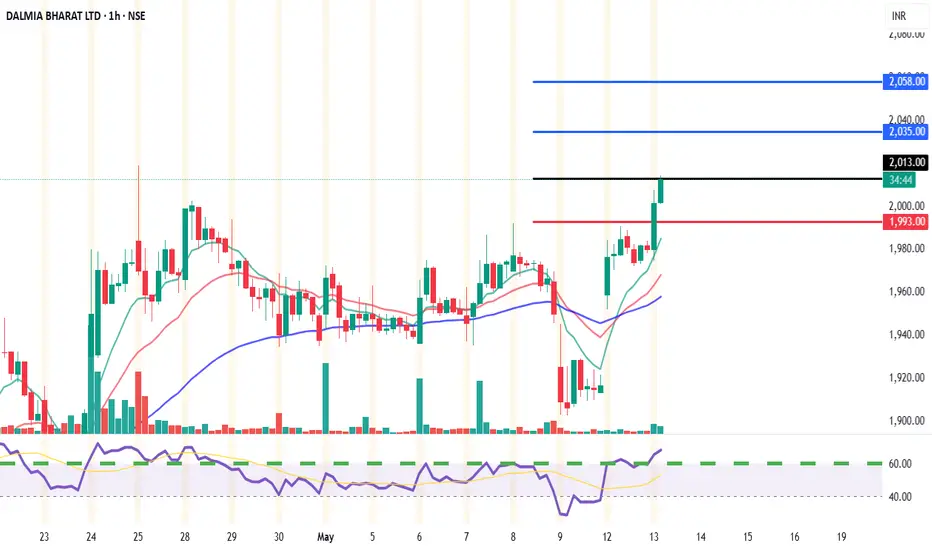
Trade Setup: DALMIA BHARAT (NSE)📊 Chart Summary:
Current Price: ₹2,009
EMA Support: 9 EMA (₹2,003.57) | 26 EMA (₹1,993.31)
Volume: Increasing with bullish candles
Price Action: Sustaining above key pivot and EMA levels
Momentum: Strong with minor consolidation
✅ Intraday Buy Setup (15min & 1h)
Buy Above: ₹2,013.50 (Break of intraday resistance zone)
Targets:
🎯 Target 1: ₹2,035.80 (Pivot R2)
🎯 Target 2: ₹2,058.30 (Pivot R3)
Stop Loss: ₹1,993 (below 26 EMA and pivot zone)
Risk:Reward: ~1:2 or better
For Education Purposes Only
Equity Research Report – TIMKEN India Ltd 📌 CMP (May 2, 2025): ₹2,728
🧭 Sector: Industrial Bearings & Motion Solutions
📈 Signal: Breakout from falling channel with strong volume confirmation
🔹 Technical Summary
Breakout Pattern: Price has decisively broken out of a long-term falling channel after a 10-month downtrend.
Volume Spike: Breakout accompanied by significant volume spike (highest in over a year) – strong institutional interest.
Momentum: RSI has broken above resistance line (~55), confirming bullish momentum.
🧭 Trade Setup
✅ Buy Zone (Swing Trade/Positional)
Buy Above: ₹2,750
Target 1: ₹2,900
Target 2: ₹3,050
Target 3: ₹3,280
Stop-Loss: ₹2,490 (just below recent breakout candle)
Timeframe: 2–6 weeks
Risk-Reward Ratio: ~1:2.5 (good for swing setups)
🚫 Invalidation Level:
Breakdown and close below ₹2,490 on weekly timeframe.
For Education purposes only

Gabriel India Ltd (GABRIEL) – Weekly Resistance Breakout Setup✅ Trade Idea:
Price has reclaimed the 0.618 retracement at ₹608.25
Breakout above the ₹612 horizontal level (weekly closing basis)
Volume is rising and RSI shows strong uptrend
💰 Buy Zone:
Entry: ₹610 – ₹613
(preferably above ₹612 on strong 15min or 1H candle close)
🎯 Targets:
T1: ₹630 (previous minor supply zone)
T2: ₹646.65 (Fib 0.786 level)
T3: ₹695.55 (Fib 1.0 extension)
T4: ₹836.85 (1.618 extension for swing positional)
🛑 Stop Loss:
Intraday SL: ₹598 (below 9 EMA on 1H)
Swing SL: ₹581 (Fib 0.5 retracement support)
🔁 Strategy:
Wait for confirmation via volume + RSI > 60
Trail SL to ₹610 once ₹630 is hit
Lock partial profit near ₹646 if market sentiment weakens
For Education Purposes Only

Equity Research Report – CARE Ratings Ltd (CARERATING)🔹 Technical Outlook
Stock has broken out of a horizontal resistance near ₹1,237 with volume pickup.
RSI is above 60, indicating momentum strength.
Short-term EMAs are crossing over the 50-day EMA — bullish signal.
Volume confirms accumulation.
🛒 Trade Setup
✅ Short-Term View (Swing/Positional Trade):
Buy above: ₹1,240 (on closing basis)
Target 1: ₹1,320
Target 2: ₹1,375
Stop-Loss: ₹1,185
Timeframe: 2–4 weeks
🏦 Long-Term View (Investor Strategy):
Buy Range: ₹1,180–1,240
Target 1: ₹1,450
Target 2: ₹1,580
Stop-Loss: ₹1,080 (weekly close)
Timeframe: 3–6 months
for educational purpose only

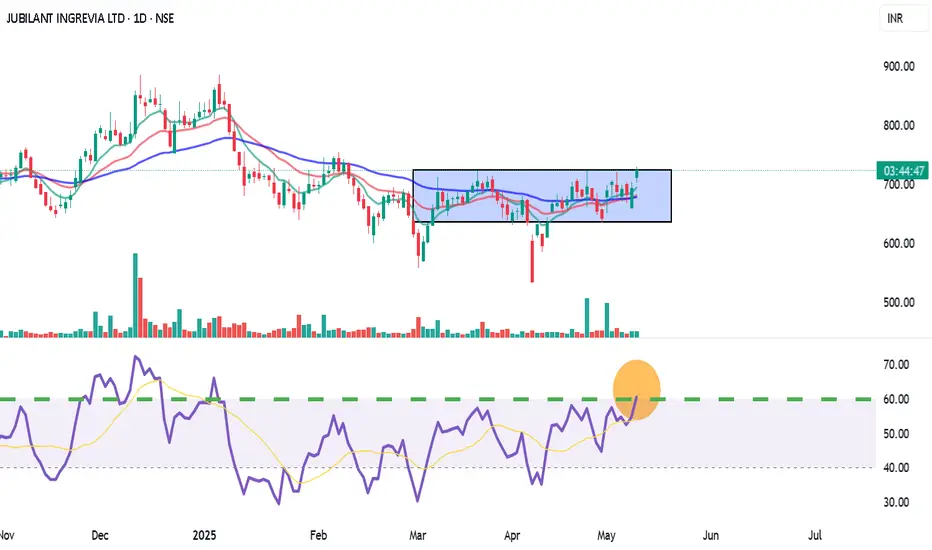
Jubilant Ingrevia (JUBLINGREA) – Short-Term Breakout Trade LTP: ₹726.30 | Recommended Entry: ₹722.00 – ₹723.00
Type: Short-Term Swing / Intraday MTF Trade
✅ Trade Setup:
Breakout above horizontal resistance near ₹725.75
9 EMA has crossed 26 EMA (bullish momentum)
RSI at 60.84 – strong trend, room for upside
BB %B: 0.96 – price pushing upper band = momentum buying
Good volume breakout on daily TF confirms buying interest
🟢 Buy Zone: ₹722 – ₹723
🔁 On retest or 15-min candle close above ₹725.75 with volume
🎯 Targets:
T1: ₹738
T2: ₹750 (supply zone / fib level)
T3: ₹765+ (if breakout sustains in 1H)
🛑 Stop Loss:
Conservative SL: ₹707 (below support + 9EMA)
Aggressive SL: ₹712 (tight SL for intraday)
For Education Purposes Only
BTCUSDT - at support? Holds or not ??#BTCUSDT - so far that was a perfect holdings of our upside region and market just reached at his first supporting area that is around 101600
Keep close it because if market slip below that then next it can drop towards downside further areas as mentioned on chart.
Keep close n stay sharp.
Good luck
Trade wisely

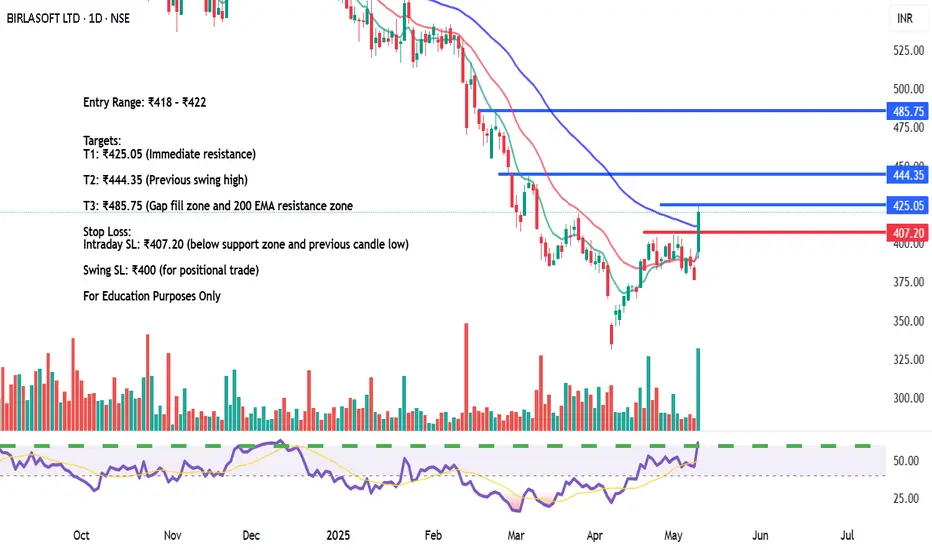
BIRLASOFT LTD – Bullish Reversal with Volume Surge✅ Trade Plan:
Stock gave a bullish breakout with a large green candle & volume spike
RSI crossed 60 level – bullish strength confirmed
Price broke above short-term resistance zone at ₹407 and nearing ₹425
💰 Buy Zone:
Entry Range: ₹418 – ₹422 (on 15min or 1H candle close above ₹420)
🎯 Targets:
T1: ₹425.05 (Immediate resistance)
T2: ₹444.35 (Previous swing high)
T3: ₹485.75 (Gap fill zone and 200 EMA resistance zone)
🛑 Stop Loss:
Intraday SL: ₹407.20 (below support zone and previous candle low)
Swing SL: ₹400 (for positional trade)
🔁 Strategy:
Scalp at ₹425 with 30–40% booking
Hold rest for breakout continuation toward ₹444+
Trail SL to ₹415 once above ₹425
For Education Purposes Only
COFORGE 8100 CE – 29 MAY EXPIntraday to Short-Term Trade Setup (15min/1H)
🟢 Bullish Breakout | Volume Surge Confirmed
🛒 Entry Zone (Buy Above): ₹258–260
🔑 Confirmation on 15min candle close above ₹260 with volume
🎯 Targets:
T1: ₹276
T2: ₹306.50
T3: ₹353.90 (if momentum continues into next session)
🛑 Stop Loss:
SL: ₹230 (on candle close basis for 15min TF)
Conservative SL: ₹240 (if tighter risk appetite)
📊 Indicators Signal:
✅ 9 EMA crossed 26 EMA (momentum confirmation)
✅ RSI at 76.79 – strong, but watch for pullback
✅ BB %B at 0.89 – breakout zone
✅ Clean breakout above resistance (~₹230) with volume spike
✅ Pivot & resistance flip visible on both 15min & 1H TF
For Education Purposes Only
