$RAMP possible long trapShould price overcome 0.3096 in the next daily candle, I will take a long position and try to reach the higher end of the green candle.
TRAP

Nice gap on TSLA! But FYI, some people want to dump at 1100-1120Really nice gap today. But don't get too excited. There was an invisible trap (premarket pump-and-dump) happened outside market hour last week. Won't be seen in daily chart. Therefore a lot of careless traders might not be aware. In case you are day trading/swing trading TSLA, I'm pointing it out for you just in case.

Hmmmm what do you guys thing?Classic setup. Hammer with increasing volume. Bear trap. Entry above, stop below. What do you guys think?

DIS potential bear trap?DIS can easily break down the strong strong support. But if the area below is a pocket of liquidity, we might have an opportunity to catch some trapped bears. Look at the bear trap in Jan. 2021. HMMMMMMM Looking delicious. Let's wait and see what happens this time.
I will try to see if I can include these potential traps in our Real Life Trading UK free week videos next week.

THE ONLY WAY IS UP FROM HERE | TYPICAL TRAPWe will go tomorrow up. There is no question about that.
This looks for me like a beartrap. Just like we saw in the 58k area, and the 29k area.
Big move down, small consolidation, and the same way up and higher.

Bear trap on ROKUThe lower wick on ROKU today could have been a bear trap. Feel free to plan your trades accordingly ;)

TSLA is very very bullish, not because of news, but the volumeI'm a trap trader but I personally don't believe in BS like "bullish volume", "bearish volume", because for a buyer there is a seller. And newbie traders who buy high and sell low generate massive volume nowadays too. But when big volume with (pattern, media, rumor) bias gets trapped, that's when one side has to take an immediate action altogether (thus moving the price).
On TSLA it just happened. Friday close took out the previous "blown top" candidate. And look at the volume of those candles... Today's gap further confirms it. But bullish for how long? It's at the mercy of those TSLA buyers down there.

FB not bearishWhen FB closed below daily 200 I was worried for a moment LOL. Good trap and not bearish for sure! But the dip!

Solana!!!! Bull Flag a trap ? In my recent Analysis on Solana I've published About the Bull flag formation in SOLANA
Well its our good that We are Still in profit according to that analysis but Today I have spotted a bear divergence in the RSI
So that means Solana will break in near future ?
Well Reversal can be seen in near 2 or 3 days but can not be much powerful. I also drew the Support zone which is at almost 129USDT,Most probably it can take support from there . Never the less Crypto Alts are dependent on Bitcoin only and BTC showed a massive cup and handle formation also the crypto total market cap On this basis only I am assuming bears are not powerful
However I'm eagerly waiting for your point of views fell happy to share in the comment box !
Best of luck for your trades !!

ROKU hammerROKU had a very nice hammer on Friday with increasing volume at a great great location. The only concern is the daily 50 pushing down. This is a nice set up to consider but I will wait for one or two days. If it breaks out, I will buy a retest. If it trades sideways, I could consider this stop limit breakout.

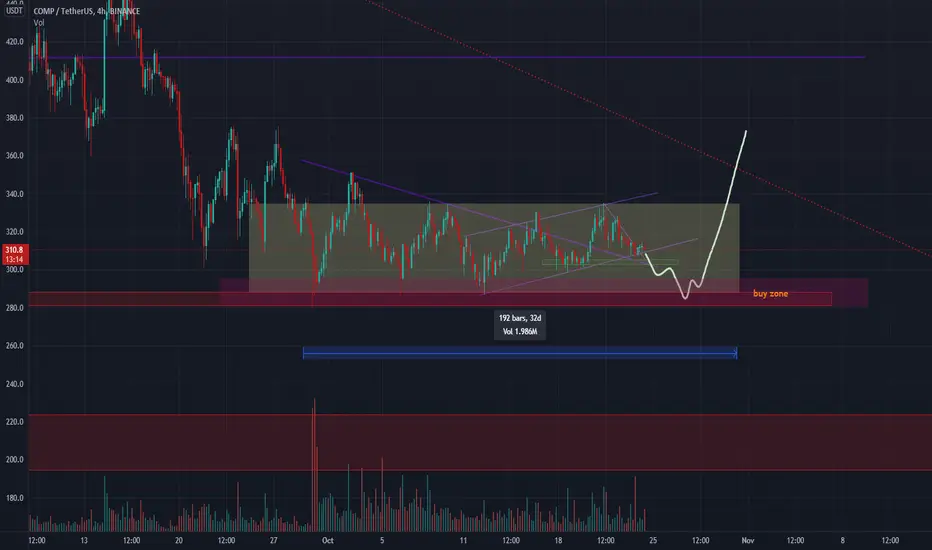
COMP USDT important update comp usdt is in a range for 30 days now i think we will see a trap to the downside and from there it will skyrocket im placing buy orders in the buy zone
GBPUSD: Manipulation ZoneMany would assume price is gearing up for the next leg down, however, I believe price has actually taken liquidity from the buyers of support so It could be ready for its next impulse upwards before continued sells.
What are your thoughts on this chart work? Are you bearish from here or bullish from here?
Please, support this post with a like and comment!

GBPCAD: Retrace TimeI am expecting a retrace of this huge sell-off.
We saw a liquidity purge of the support created after the trendline bounce.
Now that this is out of the way, we can expect some pullbacks before bearish continuation.
We can either pull back from this zone or we can take the low before we retrace.


SQ double bottom?This is a very classic setup on SQ. Buying off daily 200 on a double bottom. And in the last 3 bars it was a perfect breakout. Nice close today. Nice increasing volume on the long bearish dip in Oct 4th meaning people are trapped. Nice 1.4 risk/reward ratio.
But the experienced trader inside me is yelling and saying I should buy the stop of this classic setup. What do you think I will do :wink:?

BTC 'bear-inator' path Recently i had thought through an idea i coined ' the bear-inator' which gave a curved line from the spawn of a bull run and ultimately being the point of no return once the bull run died off ! While this idea is on a very HTF so its fruition wont be know for some time , it is worth planning out possible ideas ahead of time so you can look back upon your thinking and therefore i drew up a general idea of where BTC may go .
This idea may not occur and because of that i wont pay much attention to this chart , perhaps checking back to it monthly . This idea mainly plays into the idea that the BTC ETF will get delayed or disapproved and also ties into a futures driven run we may currently be seeing .
In red ive drawn a possible path that features fib retracement in combination with fibonacci circles. It also looks for possible confluence areas using the circle as a basic direction guide and the retracement as a price guide !
While im not betting on this playing out the thinking behind this chart is rational and features common traits of previous runs including a similar size drop off .
-Oliver

TRICKY USDJPY SHORT MIGHT BE A TRAP! TRADE WITH CONFIRMATION!
Take a look at the above image of USDJPY daily TF chart. Its clearly visible that there many hurdles that USDJPY needs to clear before aiming low. In this case, the main chart that shows USDJPY 4H, shows that once the trendline breaks it will likely aim low. Due to this many traders might get trapped should they SHORT USDJPY once this trendline breaks. As a probable consequence, the price might likely start to reverse against their trade and head back up.
A CONSERVATIVE AND PATIENT approach would be to look at the bigger picture and scan for any hurdles that might cause the price to limit its downmove. in this case, scanning the daily chart (have a look at the attached image up). On this chart there lies a Monthly pivot and just below it lies the daily EMA. these two factors have been proven to be a strong support. To trade this setup with confirmation would be to wait for the DAILY candle to pierce and close below D EMA and Monthly pivot. Once this happens a short trade can be taken on 4H charts depending on the weekly pivots. The target which would likely be tested would the area near 110.000 region.
Shall there be any updates, i will post the entry requirements below

AUDUSD: London SetupThis setup could provide plenty of profits if executed correctly.
I will be looking to see how we react after breaking the small head and shoulders pattern.
If we reject the order block holding below it, I will be buying into the region as illustrated.
Leave a comment and/or message us on how we can improve and provide better content, we are open to suggestions to create a better experience for you!
Keep in mind that the analysis provided is not 100% accurate and that you can never be certain of the markets. This information given is not financial advice, always do your own research.
Thank you for reading,

USDJPY: High WipeThe high wipe had to happen, we couldn't sell simply from a trendline breakout.
This was a trap, now that the trap is out of the way we can look for sell opportunities.
I expect one last purge of the highs before we collapse into equal lows.
Leave a comment and/or message us on how we can improve and provide better content, we are open to suggestions to create a better experience for you!
Keep in mind that the analysis provided is not 100% accurate and that you can never be certain of the markets. This information given is not financial advice, always do your own research.
Thank you for reading,
Cheers to many pips!

Sucked 'em back in. Shock & Awe time.Sucked 'em back in.
Now that we have a captive audience, Shock & Awe time.
The Shock:
Plummet to 42000 for breakout retest, with Long-able bounce at 45000. Suck in bow-ties, bear cubs, and hayseeds on the short side.
The Awe:
reverso rally to ATH, fueled by short-covering, fomo, and fundamental "news"

LTC Rangin' Up?Looking for a buy for LTC near 61.80% or 50% on the Fibo, and looking to hold until 185.40
We need for MACD to also respect the 50 line (or 0.00 ) on the RSI for both the 1HR & 4HR
We'll be on the lookout for this during this weekend.
NOTE: Please do not take this as confirmation as buy/sell signal. This is my general idea and opinion on LTC's momentum.

BEWARE OF STRONG BEARISH SIGNALS - S&P 500 - DAILYThank you for the like and comments, really appreciated! This is an idea not a financial advice.
__________________________________________________
The chart highlights every time when volumes and candlesticks signals a strong selling force but the chart went the other way around continuing to grow indefinitely following a safe 45 degrees angle.
The red line indicates a potential psychological level passed. It could be used as a probable level for a market return

