EURUSD: The Range Trap 🐻The more I study this chart the more I see the potential for buys to liquidate sell-side liquidity.
Using logic, it would seem that buy-side liquidity has already been swept and any trapped sellers that got caught on the breakout have been given an opportunity to close out of negative positions to join the correct side of the market (Hopefully Buys)
With this theory, we could assume that this fresh demand will be the zone to give buyers strength to push for that sell-side liquidity.
If the price respects this demand throughout London, I will consider buying into the weak supply, updates to follow.
Give this post a thumbs up if you like my breakdown! 🔥
Trappedtraders

EURUSD: Perfect Sell Zone 🔥This area is where I will be swing selling. The zone is trapped with buyers that need to close out of their losing positions to join sellers.
Once the area is met and an entry model is created I will update you all.
Have a great trading week gang! 🏌️♂️

Emini / ES / SPY (4H) Backtest : 57% win rate across 21 tradesWinners = 12
Losers = 5
Breakevens = 4
Total Trades = 21
% Non Losers = 76%
% Winners = 57%
% Breakevens = 19%
% Losers = 24%
Win/Loss = 240%
Net R = 14.2
Avg R/Winner = 1.18
Avg R/trade = 0.68
Bad trades prevented due to presence of liquidity near SL= 14
Icons on the chart
Thumbs up : Trade was a win
Thumbs down : Trade was a loss
Circle with a cross : Trade was breakeven
Cross : Did not take the trade due to presence of liquidity (equal highs) behind the stop loss
Variables
Avg winner = 1.6R
Strategy : wait for market structure break, then trade the retest of that zone. Zone is drawn using the first candle which crossed the pivot high/low to trap the traders.

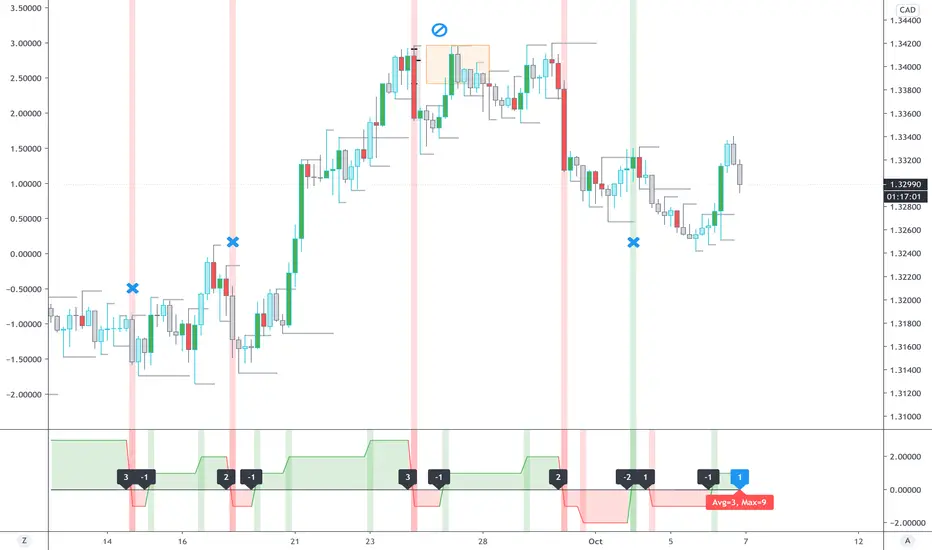
USDCAD (4H) Backtest : Break of market structureWinners = 6
Losers = 3
Breakevens = 4
Total Trades = 13
% Non Losers = 77%
% Winners = 46%
% Breakevens = 31%
% Losers = 23%
Win/Loss = 200%
Net R = 6.6
Avg R/Winner = 1.1
Avg R/trade = 0.51
Bad trades prevented due to presence of liquidity near SL= 18
Icons on the chart
Thumbs up : Trade was a win
Thumbs down : Trade was a loss
Circle with a cross : Trade was breakeven
Cross : Did not take the trade due to presence of liquidity behind the stop loss
Variables
Avg winner = 1.6R
Strategy : wait for market structure break, then trade the retest of that zone (against the trapped traders).
USDCHF : Trapped sellersTrapped Sellers on 4H are nested inside trapped sellers on Weekly. They will want to exit, giving us a long entry.

XAUUSD (GOLD) : Where are traders trapped on a weekly chart? Watch what happens when price comes back to either of blue zones. They both have a bunch of trapped traders caught on the wrong side.
Use these zones as guides and look for refined entries on H4 when price comes back to them.

Liquidity trap in GBPUSD. Going short.Liquidity trap in GBPUSD. The GBPUSD is in a good zone to open sells. It's probable to touch (or keep going down) to 1.27. I wil go short.

XAUUSDD (GOLD) : Trapped sellers below a liquidity zone (Buy!)Sellers were trapped in the recent uptrend in XAUUSD. Just above them, is a liquidity pocket which was recently taken out.
When price reaches these trapped sellers, they'll love to exit their loss making position - (hopefully) giving a beautiful long trade

EURGBP : Trapped sellers below a liquidity zoneTrapped sellers will love to exit during a liquidity hunt!

Emini : Trapped sellersSunday gap up caught a bunch of sellers by surprise. Their desire to exit is our long trade!

YM : Trapped sellersThe gap up on Sunday trapped a bunch of sellers, who would have a strong desire to exit when price comes back to them.

NQ : Trapped buyers and sellers on 30m chartThese are two important zones to watch for reversals from.

USDJPY Snipe zones : trapped sellers below July 2020 lowA large volume of sellers are trapped at July 2020 lows - who will have a strong desire to exit when price comes back to them - giving us a long entry.

USDOLLAR / DXY : Operating monthly rangeDXY has trapped buyers and sellers on bottom and top of the monthly chart. This might become an operating range for next few months!

EURJPY Snipe zone : trapped sellers in an uptrendTrapped sellers (from 30m) inside a larger 4h zone - will have an urge to exit when price comes back to them - resulting in a long entry!

NQ : When Nasdaq falls, where is the monthly support?The zone at 8943 has a bunch of sellers trapped from the Covid-19 selloff. They would want an exit. That'll be the support.

SPY500 : Another breakout to the top to trap more buyers?The volume of trapped buyers above Jan 2020 time high is very low (both on weekly and daily charts). I suspect that we'll see more topside so that market traps more buyers above all time highs before it reverses down violently!


USDOLLAR / DXY : Trapped sellersShorts are trapped in a uptrend in USDOLLAR/DXY. They would have a desire to exit when price comes back to them


GBPJPY : Trapped buyersTrapped buyers in a downtrend will have a desire to exit when price comes back to them


BYND- Bullish continuation or distribution?Whether you like it or not, BYND is the first mover in the alternative meat industry.
There is just way too much upside and growth to be captured in this nascent industry.
Future trend toward green environment and sustainability will only push this industry higher.
Three scenarios-
#1. Test the local resistance one more time and break out of the bull flag pattern. Third time is the charm!
#2. Retrace first, then trapped shorts cover their shorts which propel the price higher. Swing long opportunity.
#3. Key support lvl broken. Long at the second key support lvl. Positional long opportunity.
Click like & follow me if you find my analysis useful. Much appreciated!
