TRB Aims 8% then 15% higherTRB trading above the POC. There's a solid resistance level above 8% away. If we can reclaim this level, 15% will be the next target.
Calculate Your Risk/Reward so you don't lose more than 1% of your account per trade.
Every day the charts provide new information. You have to adjust or get REKT.
Love it or hate it, hit that thumbs up and share your thoughts below!
This is not financial advice. This is for educational purposes only.
TRB

Trb Is Just waiting to Break Out Seriously Look at how all these moving averages are sqeezing together on the hourly?
I also notice the macd is looking like it could cross any moment
TRB Has a circulating and total supply of only 2.5 milion and has been steadily climbing for the last 2 years
I wouldn't sleep on trb as i could easily see this project being worth over 10k a coin in a bull market scenerio

What is TRB's next move?In addition to a bearish CH, we have had a large and sharp falling movement, which indicates that a large descending wave has probably emerged.
We expect movements similar to those drawn on the chart for TRB.
Note that TRB is highly volatile and risky For risk management, please don't forget stop loss and capital management
When we reach the first target, save some profit and then change the stop to entry
Comment if you have any questions
Thank You

TRB Next Important LevelAfter a decent size pull back, the next level if support is at $137 which is 12% down, and strongest support is at $123. It looks like it wants to go to back to $157 and if it can flip $157 into support, then $192.
Calculate Your Risk/Reward so you don't lose more than 1% of your account per trade.
Every day the charts provide new information. You have to adjust or get REKT.
Love it or hate it, hit that thumbs up and share your thoughts below!
This is not financial advice. This is for educational purposes only.

TRBUSDT.4HBased on the given market data, the TRB/USDT pair seems to be in a bullish trend in the short term as shown by the high 4-hour RSI of 88.25 and the positive MACD of 7.54. The current price of 161.35 is closely approaching the first level of resistance at 169.01, which if broken, could lead the price to the next resistance levels at 189.0 and 195.0. The Bollinger Bands at 169.01 suggest that the market is volatile and could swing in either direction.
In the daily timeframe, the RSI is balanced at 52.82, indicating neither overbought nor oversold conditions. The MACD is negative at -3.42, suggesting a bearish trend. The price has significant room to grow to reach the daily resistance levels at 169.0, 220.0, and 265.0. The Bollinger Bands at 231.0 indicate that the market is less volatile on the daily timeframe.
The 7-day RSI is slightly bullish at 58.72 and the MACD is positive at 32.74. The Bollinger Bands at 189.0 suggest that the market is relatively stable in the 7-day timeframe. The price has significant support at 91.0, 71.0, and 9.0, and faces resistance at 225.0, 305.0, and 372.0.
In conclusion, TRB/USDT appears to be in a bullish trend in the short term but shows mixed signals in the daily and 7-day timeframes. Traders should watch for a break above the resistance levels and also keep an eye on the RSI and MACD for any significant changes. As always, this analysis should be used in conjunction with other indicators and strategies.

2-leg (TRB)📊Analysis by AhmadArz:
🔍Entry: 164.23
🛑Stop Loss: 169.79
🎯Take Profit: 155.87
🔗"Uncover new opportunities in the world of cryptocurrencies with AhmadArz.
💡Join us on TradingView and expand your investment knowledge with our five years of experience in financial markets."
🚀Please boost and💬 comment to share your thoughts with us!

New TRB -> PEOPLE ? *//* PEOPLE yeni TRB olabilir mi?English :
Can #PEOPLE New #TRB?
I opened long position on #PEOPLE.
According to onchain data %80 of the tokens are on cex, especially around half of the coins are on Binance so maybe they want to pump it?
It is highly risky position so dont put all your money.
---------------------------------------------------------------------
Türkçe:
#PEOPLE yeni #TRB olabilir mi?
#PEOPLE coine long yönlü işlem açtım.
Onchain analizlerine göre arzın %80'i borsalarda ve baş sırayı yaklaşık coin arzının yarısını barındıran Binance çekiyor, bu yüzden borsalar bu coini pumplar mı?
Bu işlem son derece riskli o yüzden tüm paranızla işlem almayın.

START GET TP-1 FOR 1-WEEK AT (TRB)📊Analysis by AhmadArz:
Back to break in low of bear-candle
🔍Entry:149.58
🛑Stop Loss: 157.05
🎯Take Profit: 142.01
🔗"Uncover new opportunities in the world of cryptocurrencies with AhmadArz.
💡Join us on TradingView and expand your investment knowledge with our five years of experience in financial markets."
🚀Please boost and💬 comment to share your thoughts with us!

The last bull run this yearWe are very close to closing the current year candle and the opening level of the next one will be of great importance. As expected, the market has flown at the key levels of 2250 on the air and 42.5 on the cue ball, with a predominance of attempts to consolidate higher, which is justified by the release of a large number of negative statistics on the United States.
Yesterday – today, they also added negativity than gave the green light for a new attempt to take higher levels in the remaining days. Starting tomorrow, there is a high probability of a new test of 2500 on the air and 45 on the cue ball in order to close the year higher. In this case, we will see only a slight pullback in the early days and continued growth in the new year on the inertia of the current one, at least until the middle of the first quarter. In the case of opening a new annual candle below 2500 and 45k in the early days, the probability of a rather sharp retest of 2250-2100 and 42.5-40k prevails with a further payback from the second half of the week to continue the trend.
Until the close of the year, against the background of a high probability of a new impulse, there remains an opportunity for coins to reverse the current year candle and take new heights. Many of the coins that I recommended for work have already fulfilled the specified goals. For coins that have shown significant growth, the probability of a rollback with the opening of a new year candle prevails. At the moment, I prefer coins that still have quite high goals, because at the turn of the year they can show themselves more stable due to this. In particular, there is an opportunity for a new attempt to gain a foothold above 0.6 and test 0.75 at UFT. OOKI left a signal for the 0.0035 test and in case of a breakdown, the road will open to 0.005. According to PROS, there is a break with a signal for a hike above 0.5, in case of a breakdown, there is a possibility of a test of 0.75. CVP also broke through 0.5, which opens up the possibility of a test of 0.75. VIB is consistently traded around 0.075 and in the case of a general impulse on the tops, there is a possibility of a test of 0.125-150. Also, the phantokens that are waiting for the 0.1 chz breakdown have not shown significant growth. I still prefer asr and atm among them.

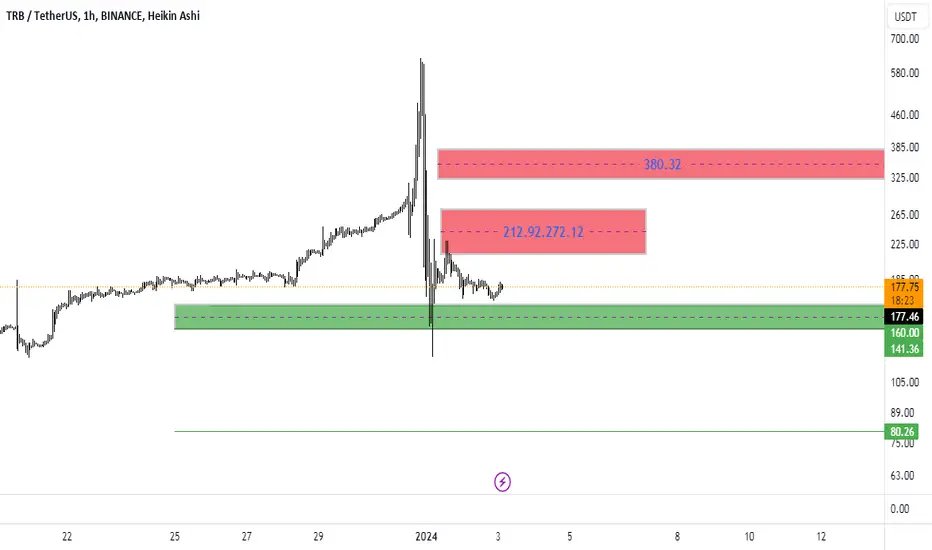
trbMany people asked questions about this currency. The price must reach an equilibrium state after an increasing state. Therefore, the green box is an important part of the state of excellence that should not be lost, otherwise it can also fall to the bottom line. At the same time, with We have those two resistance boxes that need to be seen if they break or not
Tellor #TRB is up over 30X straight upCongratulations if you spotted that W pattern and manage to ride this rocket.
I have provided a log target if you are still participating!
If you haven't been winning on this coin...
The risk reward does not favour getting involved IMO

Why BITCOIN ain’t going to 100k by 2024Evening fellas, and happy new year.
I figured I’d leave a final post to wrap up the year and throw a cold bucket of water at some people out there.
This right here, is the reason Btc ain’t going to 100k next year or anytime soon.
Impossible.
I didn’t long, I didn’t short this coin I missed out both ways, but check it for your own sake and let me know what you think.
I ain’t god, just a simple trader making his little money here and there but when it comes to trust, I trust myself only. And not the idea that btc and the crypto decentralized market fails to provide.
Trade thirsty.

TRBUSDT About To Hit New ATH!TRBUSDT formed a cup and handle pattern on the daily chart, with price nearing the neckline. The $164 level, a previous ATH resistance, awaits above. A breakout could trigger a significant bullish move for TRB.
Buy zone : Below $120
Stop loss : $88
Take Profit 1: $160.00
Take Profit 2: $220.00
Take Profit 3: $400.00
Regards
Hexa

TRB big crash 🩸 incoming Oracle defi coin COINBASE:TRBUSD 🪙 #DYOR
Done good performance 🙌
I am expecting dump from present price 📌
If any liquidation pump 📌 to liquidate short positions
It will reach red box $56-73
Day close above box $74 invalid 📌
I am expecting dump towards $8-10

TRB - Still Strong 💪Hello TradingView Family / Fellow Traders,
In reference to my previous analysis (attached on the chart), TRB has broken above 140.0 and traded higher.
Now, what's next?
↗️ TRB is currently overall bullish from a long-term perspective, trading inside the rising blue channel.
📈 According to my trading plan, as TRB approaches the lower blue trendline, I will be looking for bullish reversal setups on lower timeframes to catch the next bullish impulse.
🎯 As the next bullish impulse begins, our target will be the 300.0 round number marked in green.
📚 Always follow your trading plan regarding entry, risk management, and trade management.
Good luck!
"All strategies Are Good If Managed Properly!"
~Richard Nasr

Tellor TRB Coin Price Prediction🔥 Price on the 4H chart might come at these support area and we might get a potential bounce🔥
Potential bounce areas for Buying 127.18 and 104.50
👉 Follow me for More Real Time Opportunities.
Share your Thoughts if you have any?

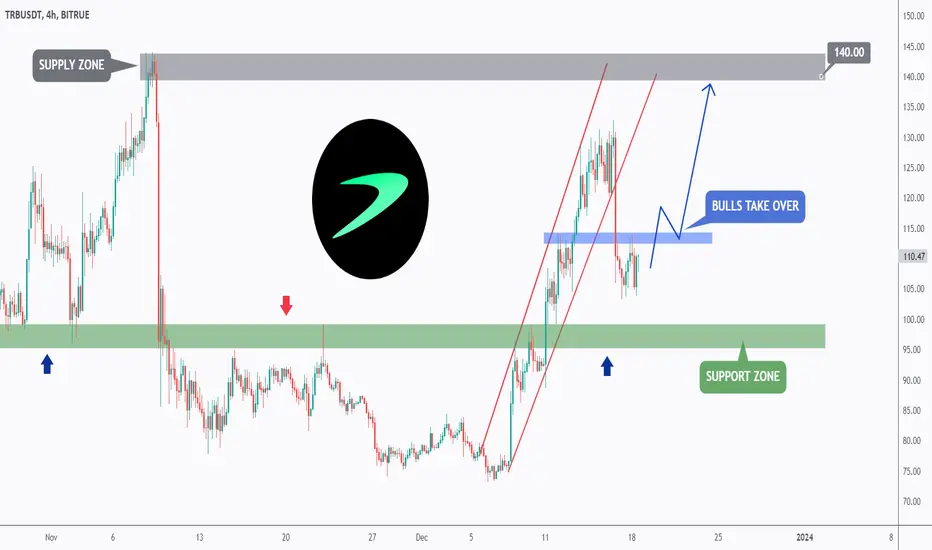
TRB - Catching The Next Impulse 📈Hello TradingView Family / Fellow Traders,
As per my last analysis, we know that the correction phase started on TRB as the red channel has broken downward.
📈 According to my trading plan , as TRB approaches the 100.0 support zone and the round number, I will be looking for buy setups.
🏹 For the bulls to take over and start the next impulse movement, we need a break above the last major high in blue.
🎯 In this case, a movement to the 140.0 supply zone would be expected.
📚 Always follow your trading plan regarding entry, risk management, and trade management.
Good luck!
All Strategies Are Good; If Managed Properly!
~Richard Nasr
The key is whether the Fibonacci ratio can rise above 0.5Hello traders!
If you "Follow" us, you can always get new information quickly.
Please also click “Boost”.
Have a good day.
-------------------------------------
(TRBUSDT chart)
(1D chart)
If it rises above 164.05, the new high (ATH) will be updated.
Accordingly, the key is whether the price can be maintained by rising above the Fibonacci ratio of 0.5 (140.54).
If not, and it falls below 104.97-108.94 and shows resistance,
1st round: 73.60-83.89
2nd round: 52.79
You need to check whether you are supported in the first and second sections above.
If it rises above 140.54-143.97 and becomes supported,
1st round: 156.44-168.43
2nd: 207.91
There is a possibility of resistance near the 1st and 2nd stages above.
--------------------------------------------------
- The big picture
The full-fledged upward trend is expected to begin when the price rises above 29K.
This is the section expected to be touched in the next bull market, 81K-95K.
-------------------------------------------------- -------------------------------------------
** All explanations are for reference only and do not guarantee profit or loss in investment.
** Trading volume is displayed as a candle body based on 10EMA.
How to display (in order from darkest to darkest)
More than 3 times the trading volume of 10EMA > 2.5 times > 2.0 times > 1.25 times > Trading volume below 10EMA
** Even if you know other people’s know-how, it takes a considerable amount of time to make it your own.
** This chart was created using my know-how.
---------------------------------

TRBUSDT SHORT SCALPAfter somewhat of an impressive run, inevitably TRB has completed the motions and needs a lie-down..
Safe TP: $22.50
TP: $20.00

#TRB Speedy Down to 91 USD#TRB Speedy Down to 91 USD.. At 91 it'll test local support then we'll watch reaction and trade further according conditions. But this time DOWN ONLY.

TRB/USDT 1DAY UPDATE AND 4HOUR UPDATE BY CRYPTOSANDERS !!Hello friends, welcome to this BITCOIN update from Crypto Sanders.
Chart Analysis:- 1-day update TRB USDT is bouncing back from fib retracement label 0.5 by breaking out in a triangle pattern and entry-level would be good to take around 0.382 which has a very small stop loss and for long-term TRP USDT will be right.
4 Hour You can see in the chat that the TRB/USDT up trend is going up trend and its support label is 100 MA and the entry level is around $120. Stop loss will be small and it is trading for a long time. Make sure to set end-stop loss.
This is not a piece of financial advice.
I have tried to bring the best possible results in this chart.
If you like it, hit the like button and share your charts in the comments section.
Thank you.

TRB - Stronger Than Ever 💪Hello TradingView Family / Fellow Traders,
↗️ After breaking above the 100.0 round number and support zone, TRB has been bullish trading inside the rising channel in red.
📈 According to my trading plan, as TRB approaches the lower red trendline, I will be looking for bullish reversal setups on lower timeframes to catch the next bullish impulse.
🎯 As the next bullish impulse begins, we will be targeting the 140.0 supply zone marked in gray.
📚 Always follow your trading plan regarding entry, risk management, and trade management.
Good luck!
All Strategies Are Good; If Managed Properly!
~Richard Nasr

#TRB 60 USD Again. But First 22% PUMP#TRB 60 USD Again. But First 22% PUMP..TRB will go upside to 112 $ Then After Taking stoploss earlier seller it,ll go down for earlier buyer . TRB 66 USD SOON
