Perl the next trend startsToday I want to consider the position of perl, which, along with uft ooki pros cvp, has so far the highest goals for growth in the mid-range up to 3-5X and has repeatedly pleased with profits last year. The project is only developing and will still show itself. Today, perl was listed on CoinDCX, which will provide an increase in the volatility of the coin. Under the overall negative dynamics of the market, we rebounded from the profit-taking zone, which has already brought up to 90% profit, but there was a breakdown, which will ensure a return to the zone in the future. Since September, there has been a trend reversal, sales have been fully repaid and a new wave of growth begins to swing. The key level for the coin is 0.025, the breakdown of which opens the possibility of a hike to 0.050-75 and an increase in volatility. By the end of the month, we can expect an attempt to break a new bullish trend line and a stable consolidation above 0.025 with a further trend. Opening a month above the level will give stable support to purchases. I would like to note that the December impulse broke through the level of 0.050, which technically makes it possible to test 0.075 this year.
TRB

TRBUSDT for Martins Fat Ass Shorts TRB LVLS for shorting, i think 130 is lvl to watch for. But still can turn around before that, so we will see what the market is gona bring us. Kind regards (peace & love & harmony)

TRBUSDT(Tellor) Daily tf Range Updated till 19-10-23TRBUSDT(Tellor) Daily timeframe range. slowly retracing up even on this dull day. at 67.76 it failed twice, there are not much of hold up there if retail interest comes. if not than back to lower levels.

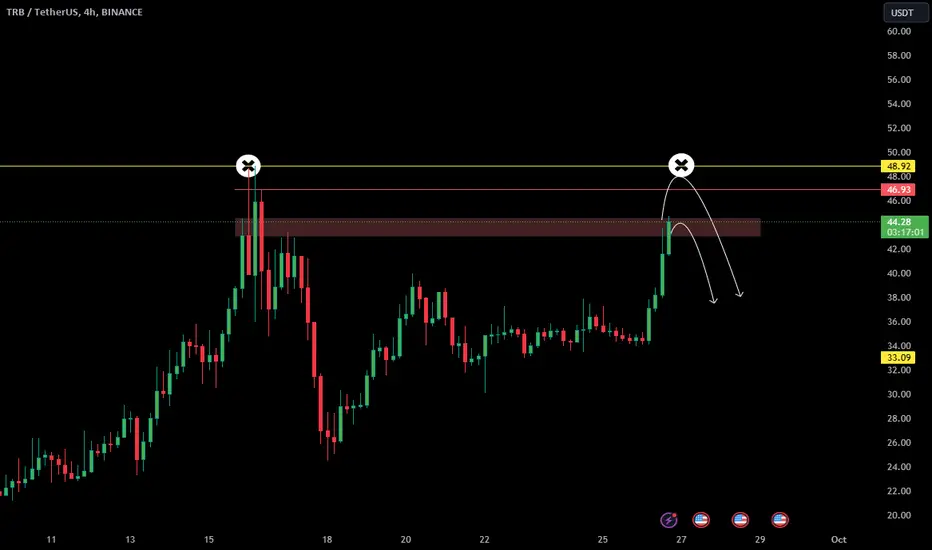
TRB/USDT Crucial Moment for TRB, What's the Next Move TRB ???💎 TRB is currently situated within a weekly resistance area, marking a pivotal moment for its trajectory.
💎 Examining past movements, TRB, just a week ago, experienced a substantial rejection at this level, plummeting 40% to reach a robust demand zone. Presently, TRB is retesting this weekly resistance area, following a notable rebound from the strong demand zone.
💎 A single confirmation is needed: a breakout of TRB through the weekly resistance and a daily candle closing above this resistance. If achieved, this area, once a formidable resistance, will transition into a support zone.
💎 Additionally, a prominent double bottom is visible on the chart, with the weekly resistance serving as the neckline for this pattern. A breakout in this area could effortlessly lead TRB to Target Profit 2.
Entry Strategies:
Spot Buy: Purchase post-TRB breakout and once the daily candle concludes above the weekly resistance area. This strategy is designed to circumvent false breakouts, necessitating a confirmation candle close.
Short Position: Await a bearish candle rejection within the 4h-12h timeframe and establish a short position. This position should be closed if TRB breaks out of the weekly resistance and the daily candle closes above it.

TELLOR $TRB follow up IdeaMore visual context regarding recent TELLOR idea.
Road to ATH!
BINANCE:TRBUSDT BYBIT:TRBUSDT.P MEXC:TRBUSDT.P OKX:TRBUSDT.P COINBASE:TRBUSD BINANCE:TRBUSD

TELLOR $TRB going to pop?TELLOR has been quiet for a couple of weeks after the massive pump it experienced. It has retraced down to $41 and been in a redistribution phase since and has levelled out somewhat. The structure still has bullish momentum being above the aug '22 high around $46, which was resistance. If it continues to hold this level and flips it into support, a further push can be expected. The heavy sell liquidity zone is between $64 and $80 (nov '21 high), therefore the market will likely push TRB up to either make a double top or a new high, potentially followed by a massive crash towards the lower sup zone around $30. If price manages to reach $80 and break above it'll be either wicked up and sold off hard, although that will likely happen before overcoming $80, so say it does get above the main resistance zone, then a parabolic move towards ATH at $165 is not far fetched, which would likely result in an aggressive 60-70% dump back to the new found support around $46. It may sound improbable but TRB only has a $125M marketcap making it prone to insane, almost irrational, value increases. The bearish outlook would be confirmed by break of bullish structure and price breaking below $41, this would send TRB into heavy demand zone around $24-$33. Potentially making a bottom there and/or moving sideways. I do not think a visit of $12-$13 is likely, at least in the short term. Marketcap would sink back to FWB:25M -30M, which is less than average daily volume traded in past 60 days. Considering all in all, TRB is going to provide ample opportunities in the short and medium term! Let's get it ;)
Most important level to break for bulls: $56
Most important level to break for bears: $41 - $43
TP bulls: $64 -> $80 -> $164 ((extended(ATH)
TP bears: $33 -> $24 -> 12.9
BINANCE:TRBUSDT BYBIT:TRBUSDT.P MEXC:TRBUSDT.P BINANCE:TRBUSDT.P OKX:TRBUSDT

TRB#TRB
I will be short about this coin.
High probability that the coin will continue pumping. Last month it closed very bullish.
But, let me write you 2 possible scenarios.
If the coin continues it consolidation above 43$ - 46$ in this case, the retest of 64$ is possible (n.2)
If the coin closes with 1 H candle at around 43$ or below, in this case the coin will continue its downtrend towards to Green lines that I highlighted on the chart. On every level I would recommend to book your profits.

TRBUSD Sell the Channel Up peak. 1week RSI extremely overbought.Tellor / TRBUSD is on 6 straight green 1week candles. The long term pattern is a Channel Up which has grown more than +600% since it touched its bottom.
The 1week RSI is already much higher than the previous Higher High, in fact it is just under the 90.00 Resistance A, formed by the August 2020 highs.
We have entered a heavy take profit zone. The previous Higher High rejection pulled back to the 0.618 Fibonacci level.
Sell and target 20.00 (Fib 0.618).
Follow us, like the idea and leave a comment below!!

TRB is still falling!As we go further, we can see different scenarios for TRB on the chart.
After hitting TP 1 of the previous analysis, we saw the TRB pump.
By re-examining the TRB, it seems that the bearish triangle is being completed.
This falling triangle whose D wave is time-consuming and has become a diametric is also one of the valid TRB scenarios.
Do not enter the position without capital management and stop loss setting.

TRB's bull run is overTRB has been climbing for a long time and is up around 600%. It has reached an important resistance range that, in my opinion, cannot climb any further.
The red box is a suitable place for SELL/SHORT positions.
I also specified the invalidation level, closing a daily candle above this level will cause an analytical violation.
For risk management, please don't forget stop loss and capital management
I specified two tps .When we reach the first target, save some profit and then change the stop to entry
Comment if you have any questions
Thank You


TRB pump to target in 2days as planSuggest you closing 75% positions here
Below is my TRB analysis 4 days ago(price 33)

#TRB/USDT 5D (Binance Futures) Big descending wedge breakoutTellor Tributes printed a shooting star which probably marked the local top on that supply zone.
RSI is quite overbought, a retracement down to 200MA at least would make sense.
⚡️⚡️ #TRB/USDT ⚡️⚡️
Exchanges: ByBit USDT, Binance Futures
Signal Type: Regular (Short)
Leverage: Isolated (2.0X)
Amount: 4.7%
Current Price:
38.512
Entry Zone:
38.997 - 44.129
Take-Profit Targets:
1) 30.911
1) 22.890
1) 14.868
Stop Targets:
1) 50.476
Published By: @Zblaba
LSE:TRB BINANCE:TRBUSDT.P #Tellor #Tributes #Oracle #Web3 tellor.io
Risk/Reward= 1:1.2 | 1:2.1 | 1:3.0
Expected Profit= +51.3% | +89.9% | +128.5%
Possible Loss= -42.9%
Estimated Gaintime= 3-9 months

TRB COIN PRICE ANALYSIS AND NEXT POSSIBLE MOVE !!LSE:TRB Coin Update & Possible Moves Near Me !!
• Almost on All Charts Look Overbought instead 1D Chart ( 1D Chart not Clear )
• You are able To Build position For Short with Tight Stoploss untill its price below 48$.
• RISK Level is High. Don't use High Fund.
Follow us for more analysis!!
TRBUSDTBINANCE:TRBUSDT SELL IDEA
⛔"Daily crypto market analyses I provide are personal opinions & not financial advice. Trading carries risks, so do your own research & seek advisor's help.#DYOR"
Don't forget to like and comment

Is TRB in Bull Run?As we can see, TRB has made many climbs and broken many resistances.
By checking the chart, I realized that the serious TRB resistance is where I marked with the red box and there is a possibility of rejection there.
Until the price reaches this price box, sell/short positions are dangerous.
To reduce the risk, we can wait for confirmation after hitting the red box.
The green box is also an important and relatively strong support that can be used for the target.
I specified the invalidation level. Closing a 1-day candle above this level violates the analysis.

TRB 37-40 $ soon.. #TRB Giving a chance for double trading money#TRBUSDT can pump to 40 dollar. but here is a condition ...it must be holds green box(a full candle never close below green box)...

TRB will follow UNFIHello Traders,
IF Bitcoin remains stable, TRB can follow UNFI.
Reasons:
Very low circ supply (Only ~2.5m coins)
Low mc
Similar weekly charts already broke out dynamic resistance.
Keep an eye on it. It will be above ~$20 soon.
Please hit the boost button and follow me for more ideas.
Thanks

Short Entry upon Wedge Breakdown for TRBGreetings, Snipers!
TRB has risen over 200% in less than a month during a bear market
The pump and dump forms a rising wedge
In the shorter timeframe, there is a clear diagonal support
We can short once there is a breakdown of this support.
TP1 at $24.4
TP2 at $16.6
Please ensure risk management and stop-loss (trailing $31, $34, $36 for futures) as this coin has a pump-and-dump nature. There is a price discrepancy with TRB futures, so beware of the funding rate.
Happy Sniping!

A new growth opportunity on last month's retest highTo date, a new opportunity has formed for the growth of violas and it is possible to make refills for the next couple of weeks. At the end of the month, the bulls made an attempt to reverse the monthly candle, but the weak euro did not break through 1750 to consolidate growth, which gave a signal for a retest of 1500. However, due to the opening of a new month above 1600, so far this movement is false for collecting positions of sellers of the previous month. The further goal is to work out the volume of buyers at the end of the month in order to open the second half of the month above 1750 and stop the seasonal drawdown of the market that has begun. With a negative scenario and a new drawdown of the euro, a repeated rebound from 1750 is possible with a possible hike below 1500 as part of a seasonal market decline. With a positive scenario and the consolidation of the euro above 1.075, there is an opportunity to gain a foothold above 1750 on the ether and the further goal will be a hike to 1900-2250 by November. This week, the foreign exchange market has opened positively, which gives every chance to take 1750 until the middle of the month.
Among the coins, only isolated developments are positive so far, but many altos can show dynamics similar to OAX in the next two weeks. Binance has added pros to margin trading, which can lead to strong growth. UFT vib perl cvp, which have similar oax and pros up to 5-7X from the current levels, also remain in priority. Growth up to 150-300% from current levels can show wtc for dock ooki loka voxel vite fis front burger fida chess fio drep hard wing df epx which are well suited for scalping.

Tellor TRBUSDT Price Analysis (1d)Hello fellow crypto traders!
Tellor price action currently appears to be in a state of consolidation, characterized by a mix of bullish and bearish signals. The price seems to be encountering a significant challenge at a long-term resistance level.
For a bullish scenario to unfold and further price increases, it's crucial for BINANCE:TRBUSDT to breach the key resistance level at $18.60. Breaking through this barrier could fuel additional upward momentum.
Conversely, if COINBASE:TRBUSD fails to overcome the $18.60 resistance, we might anticipate the price to remain below this level and potentially retreat towards the critical support level at $10.0. Monitoring price movements closely in this range will be essential to assess the next major direction in Tellor market trajectory.

TRBUSDT Buy Setup!TRBUSDT Technical analysis update
Buy zone : Below $16.80
Stop loss : $15.05
Take Profit 1: $18.30
Take Profit 2 : $22.00
Take Profit 3 : $29.50
Take Profit 4 : $43.50
Thanks
Hexa

a new push of bullsTo date, the market has reached another turning point and there are new positive signals. This week ends the month of seasonal growth and there is the last opportunity for the bulls to take the situation into their own hands. In the middle of the month, the weak euro once again cut off opportunities for the growth of the crypt. At the moment, it is on key support around 1.075 and is ready for a rebound with the aim of returning above 1.1 and turning the monthly candle into a bullish one. Against this background, there is a new opportunity for the reversal of monthly candles on the crypt. According to the mid-month tops, there are signals for a return on the daily and weekly charts, which can work out in the next few days. This month is central in the quarter and its direction is highly likely to consolidate the trend for September-October.
Against this background, akro trb and amb have already shown good growth. According to amb, there is a fairly high probability of continued growth in case of holding 0.0075-85 with the aim of going to 0.015-25 and higher next month. A small position on the coin can be left in operation. Since working out, I have increased my position on gft, which is a haven for saving funds in the long term. There is a fairly large organization behind the token and the price has approached a very powerful support by 0.01. During the rebranding of the beginning of the year, the price reached 100X from the current levels. To date, retests of levels are confident goals 0.025-35-50 . I also increased my position on oax, which, against the background of the general decline in the market, gained potential to 5-7 from current levels.
UFT vib perl cvp pros, asr atm phantokens and low-liquid pnt and torn with targets up to 5-7X still have the highest goals for them. Growth up to 150-250% from current levels can show wtc for dock ooki loka voxel vite fis front burger fida chess fio drep hard wing df epx which are well suited for scalping.
