Trbusdlong
#TRB/USDT#TRB
The price is moving within a descending channel on the 1-hour frame, adhering well to it, and is heading for a strong breakout and retest.
We are seeing a bounce from the lower boundary of the descending channel, which is support at 30.84.
We have a downtrend on the RSI indicator that is about to be broken and retested, supporting the upward trend.
We are looking for stability above the 100 Moving Average.
Entry price: 28.20
First target: 29.00
Second target: 29.87
Third target: 30.84
#TRB/USDT#TRB
The price is moving in a descending channel on the 1-hour frame upwards and is expected to continue.
We have a trend to stabilize above the moving average 100 again.
We have a downtrend on the RSI indicator that supports the rise by breaking it upwards.
We have a support area at the lower limit of the channel at a price of
62.
Entry price 70.10.
First target 77.23.
Second target 86.91.
Third target 97.86.
#TRB/USDT#TRB
The price is moving in a descending channel on the 12-hour frame and is sticking to it very well and is about to break upwards
We have a bounce from the lower limit of the channel at a price of 54
We have an upward trend on the RSI indicator that is about to break, which supports the rise
We have a trend to stabilize above the moving average 100
Entry price 67.00
First target 85.00
Second target 96.91
Third target 114.70
#TRB/USDT#TRB
The price is moving in a bearish flag channel on a 12-hour frame and we have a support area in green at the level of the lower border of the channel at the price of $80.
We have a trend to rise above the Moving Average 100
The RSI indicator has a downtrend that is about to break higher
Entry price 87
First goal 98
The second goal is 113.50
Third goal 151
#TRB/USDT LONG#TRB
The price is moving in a descending triangle pattern on 1 D frame
It is expected that this triangle will be penetrated upward and re-penetrated
With stability above the moving average of 100
We have strong support to rely on at the borders of the lower channel
Also we have oversold on MACD
Current price 113.83
The first goal is 125.77
The third goal is 137.51
The third goal is 150.84
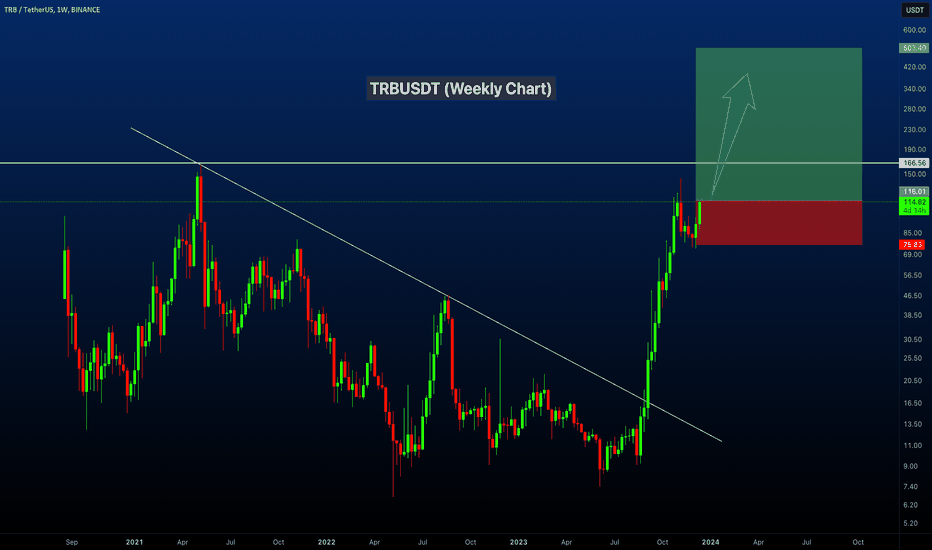
TRBUSDT Next Target 500$.TRBUSDT Technical analysis
TRBUSDT Currently trading at $115
TRB/USDT is on the verge of another breakout and clearly heading towards our next Target around 500$.
As the whole crypto market is currently on the bullish sentiments and expected a new ATH before the halving. So we are confident in the breakout and another clean rally towards 500$.
Fundamentally TRB is one interesting and technology sound project which has the potential to be in the top 50 projects.
Buy level: Above $114
Stop loss: Below $75
TP1: $144
TP2: $220
TP3: $315
TP4: $500
Max Leverage 2x
Always keep Stop loss
TRBUSDT Promising Buy SetupTRBUSDT (4h Chart) Technical analysis
TRBUSDT (4h Chart) Currently trading at $125
Buy level: Above $122.5
Stop loss: Below $104
TP1: $140
TP2: $160
TP3: $180
TP4: $200
Max Leverage 3x
Always keep Stop loss
Follow Our Tradingview Account for More Technical Analysis Updates, | Like, Share and Comment Your thoughts
TRB has great potential. :)Hello, I am publishing today my first idea on the pair TRBUSDT , time frame 2h. As always I will be mentioning a few scenarios and for each I am giving the reasons why I think that way.
FIRST SCENARIO- The market has been hurt these days by BTC. But TRB seems to recover so fast in the area between 87-96.5$. Even though we can clearly see a downtrend in this time frame, looking at the RSI, it shows a small sign of a bullish trend. However a lot of volume is needed, because if not, The RSI may show a bearish divergence. However I expect at first a small drop between 76-86 area, in which is a very buying opportunity. I think there will be at least another drop in price. In that area is a great moment to buy. If you want to have a SL, I would recommend it to be under 74$. But TRB recovers very fast, and to me it has great potential with this movement it is doing.
SECOND SCENARIO- If the daily candle closes as a hammer, probably in a few hours we could see movement in the area between 87-94$. We could be witnessing a trend reversal and the price may hit the TP of 125-127$. However it is critical to see how the daily candle stick will close and if there will be another drop of BTC and all the coins. Trade with caution and be careful while trading. TRB is very good, and recently it has recovered quite better. Be patient. If you do not feel like trading in this volatile market, step aside. Hope you liked my idea and you are free to comment for everything. :)
TRB/USDT - possible triple bottom forming?Hi all !
I like to keep it simple with the top quality alts. Fundamentally, we do not need to spend any words on the Oracle projects like Tellor. These projects are "less risky" if we consider them as a long term players that would achieve new ATH for sure.
After my LINK/USDT analysis which is going according to the plans, I think that if the market keep with the momentum that it had these last weeks, we might see an explosion in the TRB/USDT pair as well. Besides very healthy chart which we can see: healthy push after Binance listing and then healthy retracements to find the natural support are very good signs for sure.
If we keep today's daily lows, we might have triple bottom formed as marked on the chart. That's very bullish sign and if the price confirms that, we could target 145% + profits (Daily Resistance 2) in the coming weeks. However, if that plan does not come through, I would happily follow new signals and keep DCA-ing projects like TRB.
Thank you for your time !
I would also like to hear your thoughts on possible TRB movements in the near future. Your comments and support are much appreciated !
p.s. feel free to check my LINK/USDT idea and tell me your thoughts about it as well.
Happy trading!
TRBUSDT Inverse head and shoulder================ BINANCE:TRB/ USDT ================
TRBUSDT make a inverse head and shoulder pattern
as u can see
TRB HIT THE bottom and will make complete shoulder in next wave
maybe it's time the WEAK UP
and make revearsal pattern to bullish time
the reason
1. inverse head and shoulder and should be up
2. bullish engulfing
.
==============================================
Trading is High Risk
THIS IS NOT ADVICIAL MANAGEMENT
Please use Risk Management and your stop loss
==============================================
support my channel
Thumbs Up, Comment & Follow
Happy Trading
Thank You and GOOD LUCK! :)
=============================================
TRBUSDT: Possible Long (10.09.2020)On D1, a strong divergence has formed between the price and MACD, which indicates the end of the downward movement.
Also, the price broke the borders of the falling wedge pattern.
In the near future, we should expect the price to continue rising in the direction of the upper line of the descending channel.
We recommend buying at the local price correction on H4 and H1.


