TRBUSDT(Tellor) Daily tf Range Updated till 19-10-23TRBUSDT(Tellor) Daily timeframe range. slowly retracing up even on this dull day. at 67.76 it failed twice, there are not much of hold up there if retail interest comes. if not than back to lower levels.
TRBUSDT

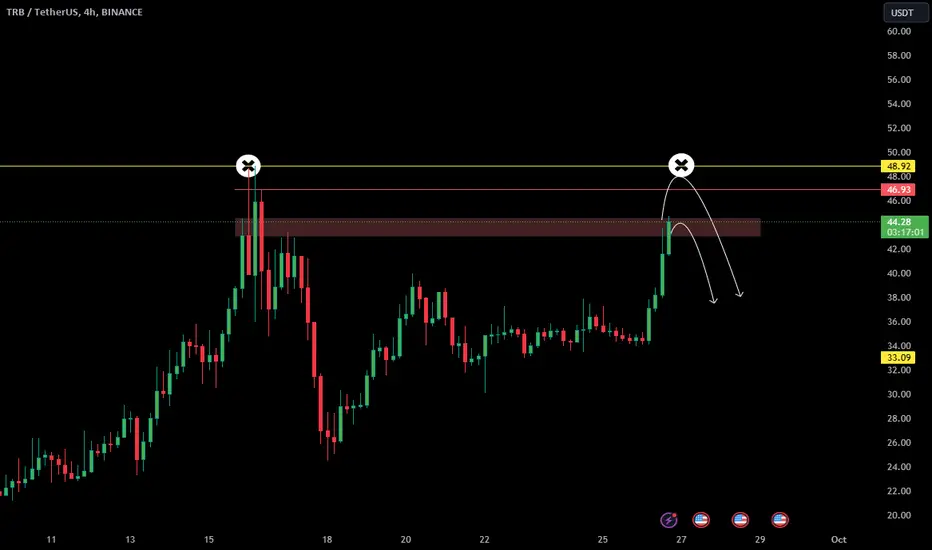
TRB/USDT Crucial Moment for TRB, What's the Next Move TRB ???💎 TRB is currently situated within a weekly resistance area, marking a pivotal moment for its trajectory.
💎 Examining past movements, TRB, just a week ago, experienced a substantial rejection at this level, plummeting 40% to reach a robust demand zone. Presently, TRB is retesting this weekly resistance area, following a notable rebound from the strong demand zone.
💎 A single confirmation is needed: a breakout of TRB through the weekly resistance and a daily candle closing above this resistance. If achieved, this area, once a formidable resistance, will transition into a support zone.
💎 Additionally, a prominent double bottom is visible on the chart, with the weekly resistance serving as the neckline for this pattern. A breakout in this area could effortlessly lead TRB to Target Profit 2.
Entry Strategies:
Spot Buy: Purchase post-TRB breakout and once the daily candle concludes above the weekly resistance area. This strategy is designed to circumvent false breakouts, necessitating a confirmation candle close.
Short Position: Await a bearish candle rejection within the 4h-12h timeframe and establish a short position. This position should be closed if TRB breaks out of the weekly resistance and the daily candle closes above it.

TELLOR $TRB follow up IdeaMore visual context regarding recent TELLOR idea.
Road to ATH!
BINANCE:TRBUSDT BYBIT:TRBUSDT.P MEXC:TRBUSDT.P OKX:TRBUSDT.P COINBASE:TRBUSD BINANCE:TRBUSD

TELLOR $TRB going to pop?TELLOR has been quiet for a couple of weeks after the massive pump it experienced. It has retraced down to $41 and been in a redistribution phase since and has levelled out somewhat. The structure still has bullish momentum being above the aug '22 high around $46, which was resistance. If it continues to hold this level and flips it into support, a further push can be expected. The heavy sell liquidity zone is between $64 and $80 (nov '21 high), therefore the market will likely push TRB up to either make a double top or a new high, potentially followed by a massive crash towards the lower sup zone around $30. If price manages to reach $80 and break above it'll be either wicked up and sold off hard, although that will likely happen before overcoming $80, so say it does get above the main resistance zone, then a parabolic move towards ATH at $165 is not far fetched, which would likely result in an aggressive 60-70% dump back to the new found support around $46. It may sound improbable but TRB only has a $125M marketcap making it prone to insane, almost irrational, value increases. The bearish outlook would be confirmed by break of bullish structure and price breaking below $41, this would send TRB into heavy demand zone around $24-$33. Potentially making a bottom there and/or moving sideways. I do not think a visit of $12-$13 is likely, at least in the short term. Marketcap would sink back to FWB:25M -30M, which is less than average daily volume traded in past 60 days. Considering all in all, TRB is going to provide ample opportunities in the short and medium term! Let's get it ;)
Most important level to break for bulls: $56
Most important level to break for bears: $41 - $43
TP bulls: $64 -> $80 -> $164 ((extended(ATH)
TP bears: $33 -> $24 -> 12.9
BINANCE:TRBUSDT BYBIT:TRBUSDT.P MEXC:TRBUSDT.P BINANCE:TRBUSDT.P OKX:TRBUSDT

TRB#TRB
I will be short about this coin.
High probability that the coin will continue pumping. Last month it closed very bullish.
But, let me write you 2 possible scenarios.
If the coin continues it consolidation above 43$ - 46$ in this case, the retest of 64$ is possible (n.2)
If the coin closes with 1 H candle at around 43$ or below, in this case the coin will continue its downtrend towards to Green lines that I highlighted on the chart. On every level I would recommend to book your profits.

TRB is still falling!As we go further, we can see different scenarios for TRB on the chart.
After hitting TP 1 of the previous analysis, we saw the TRB pump.
By re-examining the TRB, it seems that the bearish triangle is being completed.
This falling triangle whose D wave is time-consuming and has become a diametric is also one of the valid TRB scenarios.
Do not enter the position without capital management and stop loss setting.

TRB's bull run is overTRB has been climbing for a long time and is up around 600%. It has reached an important resistance range that, in my opinion, cannot climb any further.
The red box is a suitable place for SELL/SHORT positions.
I also specified the invalidation level, closing a daily candle above this level will cause an analytical violation.
For risk management, please don't forget stop loss and capital management
I specified two tps .When we reach the first target, save some profit and then change the stop to entry
Comment if you have any questions
Thank You

TRBUSDT again. It's time to go Down #TRBUSDT again. It's time to go Down ..Check my previous analysis about #TRB. That time we are Long but this time we want to stop hunt early buyers..
!! Jai Shree Ram !!
Namaste 🙌

IMP zone for TRBYellow one is an important zone. if bulls win then TRB will go up to 80 dollars and if bears win then, TRB will easily go down to 20 dollars...

Tellor TRB – Last impulse Before a CorrectionTRB Close to a Peak:
TRB had an amazing run but, IMO, it is almost at its peak. These are the reasons why:
1. TRB’s impulsive wave up, beginning on August 25th, shaped into a Rising Broadening Wedge. According to Murphy (1999), the Broadening wedge is indicative of a market top. The wide price and volume expansion represents emotional traders.
2. There is a pronounced bearish divergence on the daily chart. The divergence signifies that the bulls are close to exhaustion.
3. The RSI value on the weekly chart is more than 87. IMO, this level is unsustainable, and TRB will have to correct for the indicator to cool off.
Current Situation:
Currently TRB cleared a weekly supply zone and, it is trying to break through the weekly resistance level of 47.8.
Next Resistance Level:
The next levels TRB has to face are:
1. weekly supply zone between 59 to 73.
2. weekly resistance at 79.2
Wave count:
I do not consider myself an EW expert. However, this count is, IMO, correct. If anyone reading this has any suggestions or corrections, please share.
According to my count, in this impulsive wave, we completed four waves and now we are at the beginning of wave five. The common target for wave five is the 0.618 extension of waves 1-3 which is at 69.85. This fits nicely with the supply zone and the weekly resistance.
From a trading perspective the count doesn’t change much but it has nice confluence.
Short Trade Idea:
I do not have a specific entry, SL, and target, yet.
I will be watching for a violation of the wedge’s support line or at the resistance lines to enter a short trade.
I am curious to know if anyone else shares my opinion. Please share in the comments
Best Wishes


TRB pump to target in 2days as planSuggest you closing 75% positions here
Below is my TRB analysis 4 days ago(price 33)

TRB Looking interestingWhen I checked at TRB, I can see there is a daily bearish OB at $70 that we need to mitigate before we can see any rejection in price that’s why I’m taking a long from here and short when it get to the daily Bearish OB above….

#TRB/USDT 5D (Binance Futures) Big descending wedge breakoutTellor Tributes printed a shooting star which probably marked the local top on that supply zone.
RSI is quite overbought, a retracement down to 200MA at least would make sense.
⚡️⚡️ #TRB/USDT ⚡️⚡️
Exchanges: ByBit USDT, Binance Futures
Signal Type: Regular (Short)
Leverage: Isolated (2.0X)
Amount: 4.7%
Current Price:
38.512
Entry Zone:
38.997 - 44.129
Take-Profit Targets:
1) 30.911
1) 22.890
1) 14.868
Stop Targets:
1) 50.476
Published By: @Zblaba
LSE:TRB BINANCE:TRBUSDT.P #Tellor #Tributes #Oracle #Web3 tellor.io
Risk/Reward= 1:1.2 | 1:2.1 | 1:3.0
Expected Profit= +51.3% | +89.9% | +128.5%
Possible Loss= -42.9%
Estimated Gaintime= 3-9 months

TRB can reach 60 if break out1h time frame
-
TRB has been consolidating for 7 days, this consolidation structure is going to convergence as a triangle structure, which means TRB will appear volatility soon. If breaking out this triangle on upside, this pump momentum can be maintained.
TP: 59.5~65 / 88
SL: 22.3

TRB COIN PRICE ANALYSIS AND NEXT POSSIBLE MOVE !!LSE:TRB Coin Update & Possible Moves Near Me !!
• Almost on All Charts Look Overbought instead 1D Chart ( 1D Chart not Clear )
• You are able To Build position For Short with Tight Stoploss untill its price below 48$.
• RISK Level is High. Don't use High Fund.
Follow us for more analysis!!
TRBUSDTTRBUSDT is trading in fine bullish trend and maintaining well the bullish trendline.
Whenever the price retest the bullish trendline buyers are attacking aggressively, which can be seen from pointed arrows on the chart.
Currently the price is retracing to the inclining trendline and again it is being expected that the bulls are ready to attack.
if bulls take the charge this time too the next target could be 44.

TRBUSDTBINANCE:TRBUSDT SELL IDEA
⛔"Daily crypto market analyses I provide are personal opinions & not financial advice. Trading carries risks, so do your own research & seek advisor's help.#DYOR"
Don't forget to like and comment

Brief Analysis——TRBTRB’s performance over the past month has been remarkable, with the price rising from an initial price of 10 to nearly 50. But yesterday the price fell by almost 50%. Let’s take a look at how TRB’s whale is moving and whether TRB still has a chance to get closer to the highs.
We have used our WTA indicator many times in brief analysis. The definitions of blue, red, green and gray are as follows:
· Blue column: represents the trading volume of entities, described as a large whale.
· Red column: represents the trading volume of whales, described as a whale.
· Green column: represents the trading volume of large investors, described as fish.
· Gray column: represents the trading volume of retail investors, described by shrimp.
We use three rectangles to distinguish the three phases on the TRB candle chart. In the first two phases we use green rectangles. Both phases correspond to price continuing to rise, but the large whales disappearing. While the red and green columns are still there, the loss of the large whales has a greater impact. At this time, large whales are taking profits and closing positions. Long candles often appear at the end of this phases, and then the trend will decay. As for whether to reverse, it needs to be determined based on the shape of the candle, such as the appearance of a long pin-bar, or the appearance of a long candle in the opposite side.
So after the first green rectangle, the bulls decay, but remain fluctuating. After the second green rectangle, the price reached the August 2022 high, and a long upper pin-bar candle appeared accompanied by increased trading volume. A reversal occurred.
In addition, there is a special point on TRB. In the case of other token reversals, the departure of the large whale has been invisible. But in the red rectangle we can see that the blue columns corresponding to the large whale appears. This illustrates the urgency of Whale’s departure. After losing the support of the large whale, TRB may be in a bearish trend for a long time.
Disclaimer: Nothing in the script constitutes investment advice. The script objectively expounded the market situation and should not be construed as an offer to sell or an invitation to buy any cryptocurrencies.
Any decisions made based on the information contained in the script are your sole responsibility. Any investments made or to be made shall be with your independent analyses based on your financial situation and objectives.

Is TRB in Bull Run?As we can see, TRB has made many climbs and broken many resistances.
By checking the chart, I realized that the serious TRB resistance is where I marked with the red box and there is a possibility of rejection there.
Until the price reaches this price box, sell/short positions are dangerous.
To reduce the risk, we can wait for confirmation after hitting the red box.
The green box is also an important and relatively strong support that can be used for the target.
I specified the invalidation level. Closing a 1-day candle above this level violates the analysis.

TRB 37-40 $ soon.. #TRB Giving a chance for double trading money#TRBUSDT can pump to 40 dollar. but here is a condition ...it must be holds green box(a full candle never close below green box)...

TRB will follow UNFIHello Traders,
IF Bitcoin remains stable, TRB can follow UNFI.
Reasons:
Very low circ supply (Only ~2.5m coins)
Low mc
Similar weekly charts already broke out dynamic resistance.
Keep an eye on it. It will be above ~$20 soon.
Please hit the boost button and follow me for more ideas.
Thanks

WHY TRB COIN PRICE PUMP HARD ?? TRB COIN PRICE ANALYSIS !!If You are Confused about LSE:TRB Coin Then Read it and Understand chart Clearly....
• Price is already in overbought zone on 4h, 1D & 1W Chart & Currently testing Now its weekly & monthly strong resistance.
• Sell Your Spot bag or Close Long position if you are holding.
• If we talk about opening short position then try to find only quick scalp with proper trade setup... If unfortunatly you get stucked in trade then...
• Funding fee will kill your portfolio & 2nd whales manipulation liquidate your portfolio.
Like this and follow if you want more free charts .
