Trbusdtsignal
#TRBUSDT remains bullish📈 LONG BYBIT:TRBUSDT.P from $38.35
🛡 Stop Loss: $38.00
⏱ 1H Timeframe
✅ Overview:
➡️ BYBIT:TRBUSDT.P is in a strong uptrend, breaking the key $38.35 resistance level.
➡️ POC (Point of Control) at $34.47 indicates the highest liquidity zone far below the current price, confirming strong buyer support.
➡️ The price has broken through the $38.30 area and is consolidating above, opening potential upside toward $39.30.
➡️ If the price holds above $38.35, bulls may continue pushing towards target levels.
⚡ Plan:
➡️ Enter long after confirmation above $38.35, signaling a bullish continuation.
➡️ Risk management via Stop-Loss at $38.00, placed below the support zone.
➡️ Primary upside targets:
🎯 TP Targets:
💎 TP1: $38.90
🔥 TP2: $39.30
🚀 BYBIT:TRBUSDT.P remains bullish—expecting further upside!
📢 BYBIT:TRBUSDT.P shows strong buying momentum, breaking key resistance levels.
📢 If $38.35 holds as support, the probability of reaching $39.30 increases.
📢 However, if the price drops below $38.00, a pullback to lower levels may occur.
TRBUSDT Can TRB Hold the Line, or Is a Deeper Dip Coming?Yello, Paradisers! Are we on the brink of a major move for #TRBUSDT? Let's dive into the analysis.
💎#TRB has faced a sharp rejection at the descending resistance, signaling a potential downturn. The price now looks set to retest the demand level. For TRB to regain bullish momentum and challenge the descending channel, it needs to rebound from the demand zone. The key confirmation here is a breakout above the critical resistance at $82.5. If successful, this could trigger a significant upward movement, with a high probability of reaching our final target at the strong resistance.
💎However, if TRB fails to bounce within the $56.80 - $51.50 demand zone and breaks down further, it could spell trouble. This scenario would likely lead to a retest of the major support at $41.60—a crucial level that needs to hold to prevent a deeper dip.
💎If TRB sustains itself and rebounds from this zone, the price could stabilize. But, if there’s no strong rejection and the price merely moves sideways, the risk of breaking down the major support increases, leading to a potentially deeper decline.
Stay focused, patient, and disciplined, Paradisers.
MyCryptoParadise
iFeel the success🌴
TRB/USDT It shows the chart will be breakout of the descending!💎 Paradisers, #TRB is indeed a coin worth monitoring closely.
💎 It's currently moving within a descending channel pattern, and the price has successfully bounced when hitting the bottom of the channel (BOS area).
💎 There's potential for the price to test the resistance trendline of the descending channel in an attempt to break out of the pattern. If this breakout is successful, it could signal a bullish momentum for TRB, potentially leading to significant upward movement.
💎 To confirm the bullish trend, TRB would need to break above the CHoch area around the $127 level. This would provide additional confirmation that the trend has shifted back to bullish, increasing the likelihood of reaching our target strong resistance area.
💎 However, if TRB fails to break out of the descending channel and experiences a strong rejection when testing the trendline, it's possible that the price will resume its downward trajectory. A confirmation of this downward continuation would occur if TRB breaks below the BOS area at 108.8. In such a scenario, TRB could revisit the demand area around 88.4.
💎 It's important for TRB to bounce from the demand area to attempt another breakout of the descending channel. If TRB fails to bounce and breaks down below the demand area, it would confirm a bearish invalidation, indicating further downward movement for the price.
MyCryptoParadise
iFeel the success🌴
TRB/USDT Keep an eye on the OB potential significant bouncing!💎 TRB has recently shown significant market dynamics, with potential for a retest of the bullish order block (OB) area before a significant breakout from the descending channel.
💎 However, if TRB breaks the pattern without first retesting the bullish OB area, it could still continue its upward movement and potentially reach our target strong resistance area.
💎 When TRB reaches the bullish OB area, it's crucial for it to bounce and resume its upward trajectory.
💎 Failure to sustain this area, leading to a breakdown, could signal bearish momentum and result in further downward movement for the price.
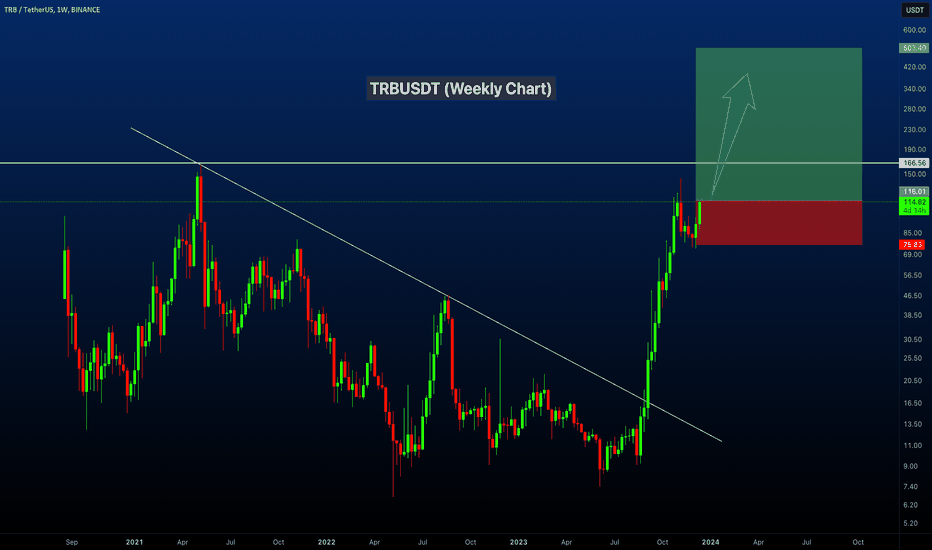
TRBUSDT Next Target 500$.TRBUSDT Technical analysis
TRBUSDT Currently trading at $115
TRB/USDT is on the verge of another breakout and clearly heading towards our next Target around 500$.
As the whole crypto market is currently on the bullish sentiments and expected a new ATH before the halving. So we are confident in the breakout and another clean rally towards 500$.
Fundamentally TRB is one interesting and technology sound project which has the potential to be in the top 50 projects.
Buy level: Above $114
Stop loss: Below $75
TP1: $144
TP2: $220
TP3: $315
TP4: $500
Max Leverage 2x
Always keep Stop loss
START GET TP-1 FOR 1-WEEK AT (TRB)📊Analysis by AhmadArz:
Back to break in low of bear-candle
🔍Entry:149.58
🛑Stop Loss: 157.05
🎯Take Profit: 142.01
🔗"Uncover new opportunities in the world of cryptocurrencies with AhmadArz.
💡Join us on TradingView and expand your investment knowledge with our five years of experience in financial markets."
🚀Please boost and💬 comment to share your thoughts with us!
TRBUSDT Promising Buy SetupTRBUSDT (4h Chart) Technical analysis
TRBUSDT (4h Chart) Currently trading at $125
Buy level: Above $122.5
Stop loss: Below $104
TP1: $140
TP2: $160
TP3: $180
TP4: $200
Max Leverage 3x
Always keep Stop loss
Follow Our Tradingview Account for More Technical Analysis Updates, | Like, Share and Comment Your thoughts
TRBUSDTBINANCE:TRBUSDT
I am not sure, but I am waiting for this movement and the beginning of the downward trend. Currently, the funding fee is still high and there is a possibility of an upward lag, so I want to see if this resistance line will be hit again or not. If this happens, the price can go sharply or gradually up to 70$.
⛔"Daily crypto market analyses I provide are personal opinions & not financial advice. Trading carries risks, so do your own research & seek advisor's help.#DYOR"
Don't forget to like and comment
🔍 Keep an Eye on Trbusdt! 📉**🔍 Keep an Eye on Trbusdt! 📉**
While it seems like a tough time for TRB, here's a suggestion: let's be patient and await a potential small retest this weekend. The upcoming week might pose a bearish challenge for TRB, so watch out.
🚨 Remember, this is just an idea and not financial advice. Always conduct your own research before making any decisions.
Wishing you the best of luck on your trading journey! 🍀📈
TRB can reach 60 if break out1h time frame
-
TRB has been consolidating for 7 days, this consolidation structure is going to convergence as a triangle structure, which means TRB will appear volatility soon. If breaking out this triangle on upside, this pump momentum can be maintained.
TP: 59.5~65 / 88
SL: 22.3
TRB COIN PRICE ANALYSIS AND NEXT POSSIBLE MOVE !!LSE:TRB Coin Update & Possible Moves Near Me !!
• Almost on All Charts Look Overbought instead 1D Chart ( 1D Chart not Clear )
• You are able To Build position For Short with Tight Stoploss untill its price below 48$.
• RISK Level is High. Don't use High Fund.
Follow us for more analysis!!
TRBUSDT Analysis (LOCAL VISION)Hello friends.
Please support my work by clicking the LIKE button(If you liked).Thank you!
Everything on the chart.
Entry: market and lower
TP: 42 - 50 - 60
after first target reached move ur stop to breakeven
Stop: under 29 (depending of ur risk). ALWAYS follow ur RM .
Risk/Reward 1 to 4
risk is justified
Good luck everyone!
Follow me on TRADINGView, if you don't want to miss my next analysis or signals.
It's not financial advice.
Dont Forget, always make your own research before to trade my ideas!
Open to any questions and suggestions.


