SPX - Relief Rally - Stimulus to the Rescue + Bonds/ Gold UpdateQuick SPX update:
~ Expecting a brief relief rally (haven't we all)
~ Target is in between the 38.2% and the 50% Fib retracement (2,650 - 2,800)
~ Looking for a potential move to the 21 daily ema, at which point i will be looking to go bearish again
~ The move will likely be on the back of the "positive" stimulus news, but i am very skeptical of how the markets will respond to this, which ultimately amounts to an admission that Covid19 is crippling the US economy and that one should expect higher inflation moving forward
Additional Analysis:
Gold ---> I believe that there are many key factors moving forward (i will elaborate in a further post), these include the demand for physical beginning to outstrip supply (premiums are reflecting this), the issue of the futures contracts being used to drive prices down as a policy tool (to prevent a further erosion of confidence) and the fundamental drive of higher inflation expectations. Overall i am very bullish on Gold going forward, but i also am expecting to see some near-term weakness.
US Bonds ---> The end goal is zero, make no mistake, US10Y and a host of other maturities will hit the "zero bound" within 12 months or even sooner. This will present a host of challenges, namely it will significantly reduce the attractiveness of US Treasuries as a safe haven, this will most likely drive capital into gold, leaving the only buyers as the Federal Reserve, thus the US will enter a death spiral, furthering their dependence on low/ negative rates.
I believe the best way to play this macro outlook, is to leave US bonds alone, yes there will be capital gains to make, but the yields are already so low, better to let that train leave the station without you, the USD will appreciate, at least in the near-term, so a play on DXY is on the cards. But the better play in my opinion is to use the yields as an indicator as to when to shift focus to gold, as when US bonds hit the zero bound, the carry cost for gold is now a non-issue and the yellow metal is now a much more attractive safe haven. In fact, this may very well be a contributing factor to the growing strength of gold, as other investors will also be keenly watching the yields on US Treasuries.
- TradingEdge
Treasuries

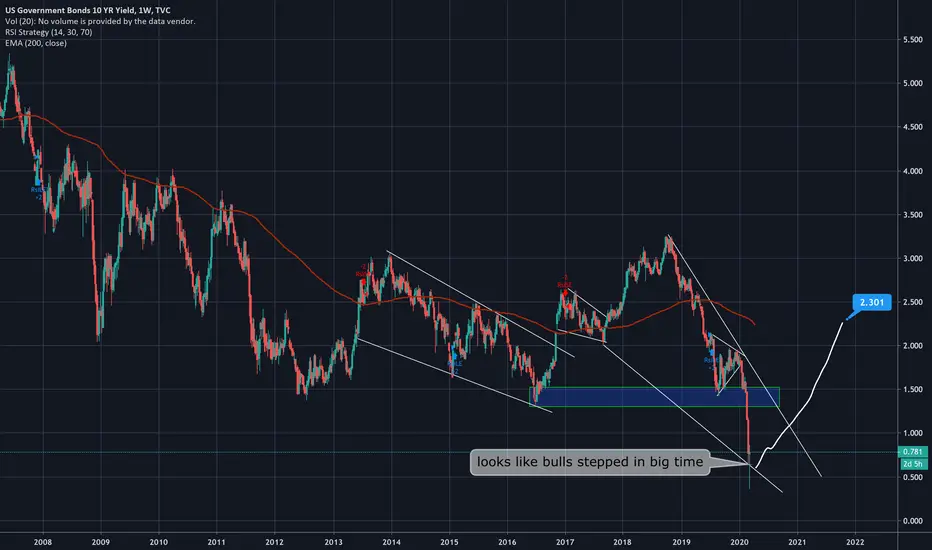
10 yr yieldI honestly think this is a BTFD here fam the 10 yr looks primed to reverse. And this implies the stock market will boom long term heading into 2021-2024 when the yield finally tests the 200 ema and probably fails leading to another big crash. I think a Trump victory in 2020 all but solidifies this narrative that I am looking at here with the 10 yr

Corporate spreads widening means money-losing bonds.In earlier published idea, I indicated that corporate spreads would widen and that indexes (and lower quality corporate bonds) heavily invested in corporate high-yield bonds would suffer. This has since occurred, and will continue.

What is going on with GOLD?Thanks for viewing, I labelled this as "long" despite some as yet unexplained steep price reductions in the short to medium term. I did that because I saw that price drops were coming but that was just a signal to add to purchases, as opposed to sell.
Why do I expect price drops in the short to medium term?
1. Elliot Wave seems to indicate the ending of wave (3) up, it is always hard to be sure, but anyone can see the three sections of price advance (and two declines) in the last two years,
2. There was rather evident bearish RSI divergence (higher price highs vs lower highs on the RSI) that emerged even before this last weeks price drop - indicating a loss of momentum,
3. A couple of rejections in a row from the USD1700 level,
4. Gold appears to be "overbought" on your technical indicator of choice (and it is hard to afford at the moment - many people will be waiting for a pull-back before buying - many many others can't or won't wait however.
5. Just look back a few years, the same thing happened in 2008, there was a steep decline in the price of gold during the last recession (it still gained 23% over the duration of the recession) because the same circumstances applied - some people were forced to sell due to circumstances - the rest had the ability to hold and also clearly saw the writing on the wall).
Why do I remain long?
1. Let me count the ways.
a.It is the perfect investment vehicle for the moment (uncertainty, money markets, debt markets and supply chains freezing up (bullion cannot get through either)),
b.record levels of open market operations announced by the US fed in the past week (otherwise their 30 year bond issue was going to possibly fail to find sufficient buyers - this should be a major salient red flag: the largest, supposedly most credit-worthy country in the world, was a few minutes (about 20 minutes I think) from having a sovereign bond issuance fail to find sufficient buyers if they didn't announce a new round of quantitative easing),
c. negative real fixed interest yields and the increasing possibility of negative nominal yields (this has changed very quickly from yield increases even mid last year) which mean that the "negative carry" aspect of gold (storage fees and no interest income) is less and less of a factor,
d. If you take inflation into account (let alone the comparably much larger increases in the money supply) gold is still significantly undervalue in real terms - yet $1600 sounds like a lot for just over 31grams of gold but not when you consider how worthless the currency has been made and will continue to become. There is a possibility of gold going geometric a la Venezuela, Argentina, Weimar Germany etc etc - some truly unimaginable gold prices are possible. If gold 'appreciates' to account for the money supply (as it has done before in times of crisis) a doubling or even tripling in the price of gold may be a low-side estimate youtu.be If gold had to go to 18,000/oz in 2018 to account for the money supply - imagine what it will have to go to after the printing presses really get going.,
e. I am not an economist by any means but I suspect that we have more in common with Weimar Germany than most realise - inflation is somewhere in the pipeline - but first massive MONEY PRINTING to "solve" all our problems,
f. In the developing country I live in gold has been setting new all time highs again and again (it waited one whole year after the USD 2011 ATH to set new highs in local currency terms) when you have a weak currency the best time to buy gold is always "right now." Gold isn't gaining in value so much as your currency is depreciating in real purchasing power (which is happening to a lesser degree in the US),
g. After reading Ray Dalio's free e-book about big debt crises I was to hear that 'credit spreads were widening' indicating that credit markets were only now reappraising the previously under-appreciated risks of BBB, BB, and B grades of Corporate Debt. Well I hear that a lot now - Last I heard credit spreads for (non-investment grade) BB debt are 815 basis points (8.15%pa above Treasury yields) which is a "very significant and rapid re-pricing in high yield debt youtu.be But significant credit rating downgrades from BBB (lowest investment grade) to BB aren't expected to be significant according to JP Morgan's Jim Casey - feel better? It doesn't make me feel better. The major driver in the US equity markets has been leveraged corporate buy-backs and any buy-backs from the last 12 -18 months are underwater while costing interest - at a minimum this will cause some pressure on Corporate finances and executives,
h. I heard this last week; gold is unsurance (insurance when you "are unsure what is going to happen,
i. gold IS money,
j. I wanted to diversity out of fiat currency as massive stimulus efforts by central banks will devalue all major currencies (maybe not much in relative terms - but in overall terms),
k. Gold demand set new records in 2019 and gold demand has ALREADY surpassed 50% of the 2019 demand - 2020 is on track to DOUBLE gold demand (this sort of thing is never predicted in advance - and hasn't been) - I read this on investing.com I think but haven't got a link for you,
l. Gold is valued in every culture all over the world and has been for thousands of years, I am sure there are more reasons but I have things to do.
But before I go, I just wanted to mention a predicted, predictable issue with sourcing gold and silver bullion. Yesterday, my bullion dealer significantly raised premiums. The premiums on items I regularly buy were raised from 5% to almost 35% in the course of a day. Right now we have futures prices that have become disconnected from the price of physical bullion. Why? Record demand along with supply chain problems - reportedly "several months" to restock supply minted in China. As Mike Maloney likes to say; buy silver now before it becomes unobtanium and unaffordium youtu.be He often recounts large time periods during the last major bull-run where silver couldn't be sourced (for any price) and even gold could only be sourced in a minimum of 1kg bars and had zero supply at all for a few days. He also mentioned that premiums went through the roof at those times - so the historical spot prices don't paint the picture. I believe the next few months might even be the last realistic chance to accumulate gold at reasonably affordable levels.
Stay safe everyone.


Largest Treasury collapse everBuy gold silver platinum zcash
This is what a dollar crisis looks like

BONDS OVER STOCKS 2020With equities looking increasingly volatility and valuations as frothy as ever, long term bonds have been quietly outperforming recently. I expect this trend to continue for foreseeable future and for us to rise 5-13% from here conservatively.
The global climate is shifting to reducing risk and buying safe haven assets. Therefore, 20 year bonds will likely continue to be a source that reaps the benefits of capital outflow from stocks and into US treasuries.

Long The Dips On BondsWith the markets pricing in a 95% chance of a 25bps to 50bps rate cut, longing 20 year bonds seems like one of the highest confidence trades in the market.
I am bullish on 20 year bonds specifically, and will continue to be until we see a rate hike which I believe is far, far away. We are likely heading into a global recession within the next 12-18 months, so I rather be on the long side of risk-off assets in anticipation of a move higher.

Japanification on the way. The US10Y will drop to 0 % soonThe US10Y will drop to 0 % soon. Otherwise the world economy will crash due to the amount of debt. The central banks will continue to print untill the system breaks down.

The market will drop even moreThis chart shows the relationship between the 03 M Y on American treasury bonds and S&P 500. It shows a clear relationship during the last two crises and also shows that the downturn has just started.

US 10Yr Yield Triple bottom has been breached and this is an indicator of economy enter into the downhill.
Governments across the globe are already ready or has started pumping money into their economy to support the impact of the virus.
Strong resistance line of the triple bottom formed by US 10Yr Yield has been breached, mainly fueled by economy greatest enemy - fear.
United States is expecting the arrival of the virus and will this prompt further flee into treasuries?
Let me know your thoughts below.

US 30 YR AT KEY LEVELLooking at 30 year UST yields key levels are at 2.2% and 2.4% on the weekly chart.
Break and close above 2.4% could indicate we have bottomed, but close below 2.2% and we're probably heading lower, meaning the rally in yields (sell-off in bonds) was a retracement of the heavy buying buying before the rally in treasuries continues.

The 2020 GDX OUTLOOK>>YIELDS|STOCKS|FED Policy& GOLD>>(Part 2/4)Short Analysis on GDX/Gold in 3 bullet points; Series on Commodities and the 2020 outlook - 21st of December 19'
Before I get into the analysis, wishing you all Happy holidays! Here's the simpler version of the chart:
1. Few key takeaways: Despite that the current resistance at ~31 is holding , the breakout in GDX is eminent . The question is of the timing . From part 1/4 analysis on yields(Ref #5) it seems that yields are looking somewhat bullish. Of course, this is based on the assumption that "Not QE" will continue and eventually QE-4 will be announced . Nevertheless, this means that equities will continue to be bullish, even in sectors such as materials (Ref #6). If we get another series of rate cuts, GDX could breakout as early as Q2 of 2020. For further discussion on QE and monetary policy, visit part (1/4) on Treasury yields:
2. Recently there has been somewhat of a small bounce in PMI's . This was expected as the global monetary policy stance of CB's took a dovish turn in 2019, and the easing environment affects the real economy with a lag . Taking this into consideration, $GOLD may continue the horizontal path that it is currently on. This bounce in the macro data may be very dependent on the outcome of the trade negotiations , which hopefully we will find more about in January.
3. Not expecting gold to make new highs in the first half of 2020 . As the election cycle unfolds, there should be more volatility depending on the election circumstances. It's still very early, but it doesn't look good for the Democrats, in which case a breakout in both GDX and GOLD may be postponed . It's all labelled on the chart.
To sum up, based on more accommodating monetary policy, the bottom line in GDX should hold above 27$. The horizontal range (27-31.25) should sustain before we get a breakout triggered by either the election cycle or potential economic shocks . This is a perfect iron condor trade setup . Materials as a sector has been very under-weighted and hasn't performed well, compared to the cyclicals . As the global economic slowdown continues, it seems that there isn't any downside in holding gold as a stock market hedge . Either way, balance sheet expansion favors all assets, especially substitutes for the dollar- gold.
Tried my best to keep it short and simple, this it for GDX and GOLD.
-Step_ahead_ofthemarket-
________________________________________________________________________________________
>>I do not share my ideas for the likes or the views. This channel is only dedicated to well informed research and other noteworthy and interesting market stories.>>
However, if you'd like to support me and get informed in the greatest of details, every thumbs up and follow is greatly appreciated!
References & Disclosure:
1. FED rates Super-cycle 1980's-
2. Dollar/Yuan breakdown, trade progress and tariffs:
3. Previous Gold chart:
4. XAUXAG, Gold aginst Silver ratio:
5. Treasuries and QE:
6. XLB Sector, US materials:
Disclosure: This is just an opinion, you decide what to do with your own money. For any further references or use of my content- contact me through any of my social media channels.

US 10-Year Yields Continue to RiseAs global financial markets continue to grind higher and reach new highs, it appears that yields on the US 10-Year Treasury are doing the same.
Yields broke through their previous yearly high of 1.899% (Green Resistance Line), settling at 1.943% (as of Nov 10th), and are trying to make a move higher.
On a technical basis, yields seem to be forming an "Ascending Triangle" pattern, supported by a rising RSI and MACD, indicating that this recent uptrend has some legs to stand on.
This recent bullish action comes as investors are beginning to feel a little bit more optimistic about the global environment as 2019 comes to a close.
If 1.899% can hold as a steady short term support for yields, and its momentum continues, the next stop could be its Weekly Resistance Line of 2.042% (Orange Line).

Bond H&S updateupdating the previous chart to look at how this is behaving. Keeps retesting neckline, yet it keeps getting rejected. If broken, this will rally a bit, but I still expect this to head south significantly.

TLT LongTLT has pulled back to a very key trend line with additonal supports coming in below. On the hourly chart, we have positive divergence on TLT meaning we should see upside soon in the short term. Given the postures of the markets and how treasuries act as a flight to safety asset, it is reasonable to assume they will go up in price as stocks fall.
For this trade, I advise picking up TMF (x3 leverage) with a stop anywhere from 28.00 to 26.60. I also recommend scaling into the position with 2 or 3 batches comprising your total allocation that you are willing to invest.

Gap always get filledI expect us to revisit support at the green line or at least 1.5 soon, perhaps this week or within the next two weeks. Gaps always get filled!

S&P 500 - A Bearish Outlook Heading Into 2020Here is my thought process behind why I have a bearish outlook heading into 2020 - please note that this is the second time that I have ever published analysis and this is just me synthesizing a bunch of ideas. I'm going to start off with the lighter ideas before moving on to the heavier ideas...
1) We are in the late stage of the economic cycle... this is the longest expansion of the US economy since records began. Common sense dictates that we will enter a recession soon.
2) Keeping this in mind, let's look at the state of politics around the world. We have protests and riots in HK (recently a protestor was shot for the first time), we have Brexit which has both Germany and the UK on the brink of recession. The US and China trade war has not improved at all and is constantly seeing tit-for-tats. Finally, literally the other day the US was given the go-ahead by the WTO for $7.5 billion in tariffs on the EU in response to their 15-year long row over the subsidizing of the rival aircraft companies Boeing and Airbus.
3) In recent surveys, over half of economists in the US believe that a recession will hit the US in 2020. The market has also seen the yield curve invert, providing a stark warning (although this usually takes at least 12 months to materialize, this is a bad indicator).
4) There is a ridiculous bearish RSI divergence on the charts, with Fibonacci Time Zones pointing towards significant price action at the start or end of 2020. I believe this is because this cycle was pumped and overrated, running on the crack cocaine of financial markets: Quantitative Easing.
5) Recessions usually occur when there is a sharp fall in liquidity in the cash markets (referring to bank deposits and not trade execution liquidity). In recent times we have seen a bipartisan deal passed through in the US which mandated the US Treasury to "aggressively build up" cash reserves. After lowering the debt ceiling the Treasury plans on borrowing an additional $433 billion during this quarter (about $275 billion more than it had previously estimated) which is roughly ten times (1,000%) more than what the Treasury borrowed last quarter ($40 billion). This would cause global dollar liquidity to dry up fast (foreign nations and banks use excess deposits and reserves to purchase these meaning dollars flow out of the economy into the Treasury).
6) Continuing on from the last point, not only do we have dollar liquidity vanishing in the global economy but we have negative dollar swap spread (those lending USD via currency swaps want higher premiums). This is only getting deeper and deeper. Interestingly, the Bank of International Settlements found that cross-currency swap spreads act as a more accurate measure of struggle in the financial markets than the VIX. This shortage of dollars (highlighted by the premium being charged to lend dollars in swaps) comes at a time when the global economy is already weakening thus is making financial markets more fragile (turning to IMF reports on muted inflation and weaker final demand for goods and services) also referring to previous points
Seeing and analyzing all these factors, the future doesn't look too bright. Disappointing economic data continues to plague our minds. As the Fed continues to cut interest rates they are only giving debt-laden companies one more sigh of relief which will only knock the inevitable crash further down the road when neither corporations nor the government can cope with it (they're throwing away all their ammunition and shooting themselves before the battle has even started). The drop to come will be harder and more brutal than 2008 because asset prices are currently inflated at incomprehensible levels due to quantitative easing as well as the Fed having little headroom to cut rates further. You could only imagine what is to come in countries with much less head-room for monetary policy than the US... What's next? Helicopter money!?
Disclosure: I hold shares in: XSPS IGLT O IBTM


USA 10YR: 1.00 by Mid 2020; Lower is PossibleContrary to what most people believe, 10 year yields have very little to do with the DXY, but rather acts as an outlook/sentiment with respect to the global economy. Of course there are many other things in play, however, in this impending recession that will be the major driving force for the 10 year.
Moreover, plummeting yields from most other nations will lead the US yields artificially lower.
I expect by February or March 2020 we could see a full 1.00. There is potential it could drop further but I am holding firm on a 1.00 prediction at this time.
Eventually, yields will eventually burst upwards and begin to rise which will likely happen in the last (late) quarter of 2020. From this point, precious metals will completely decouple from yields.
- zSplit

10 Year T Note: Triple Bottom. Major long term Buy Opportunity.The 10 year has rebounded off the major 1M Support this month, making a statement with last week's strong 1W candle. This marked a Triple Top formation on the 1M scale (since 2012) and the trend shift becomes obvious. 1D is trading near overbought territory (RSI = 70.811) pushing the 1W towards neutrality (RSI = 42.781, ADX = 58.406, Highs/Lows = 0.0000), detaching it from its previous bearish levels.
We are expecting a major cyclical bullish move in the next 2+ years towards at least 32.00. Shorter term investors should look towards the inner Channel Up (dashed lines) for pivotal sell/ buy entries.
** If you like our free content follow our profile (www.tradingview.com) to get more daily ideas. **
Comments and likes are greatly appreciated.
