UD1! That's where money went...yield curve explainedCBOT:UD1!
The UD1! is on up trend and explains where all the stock market money has gone the past week...lol. I think I understand yield curve, but missed this one. ; )
Treasuries
US 10y Bond1) Due to the zig-zag nature of the yield values, historically, it seems proper to use Elliott-waves.
2) There was a rate-hike environment in the past which seems similar to the current price action. Coincidentally the wave 5 drop corresponds to the year 2020; 2020 is the year many talking heads are calling for a US recession.
3) In recent years bonds and stocks have rallied in tandem, however, which means a recession isn't necessarily the only way to arrive at the 5th wave. A powerful US economy and continuation of recent co-variance could also push yields lower.
4) I do not believe the well-establish downward trend will be broken, and lower yields are likely to exist post 2020.
#TNX 10 Year Treasury Note Yield What's UP big dump coming maybeWhat's up. Well DAX peaked last year S&P500 and Nikkei225 kept going up. The "Make America Great Again" maybe. Big "Dump-Ala-Trump" coming soon maybe. That's what bonds telling us maybe Will Crypto go into deep freeze and bitcoin go down by another half (50%) Time will tell. No hurry. Note these are Monthly charts
The bond bear is not here yet.... use a log scaleThere have been a lot of talks of a bond bear market over the past year. That would be a big problem, but it's not here yet. The biggest problem is that too many chartists are using and circulating charts of trend resistance breaking in bonds that do not use log scales. I get that it seems intuitively dumb for a yield chart to use a log scale, but that's how this has traded for the better part of the last 20 years. Trade what is, not what you think should be.
Turns out we haven't yet hit the top channel here, so we're not in a bond bear. It also turns out that touching the top channel occurred every time the fed quit hiking rates over the past 30 years, which preceded the last 3 recessions / bear markets by 1-2 months at least.
Short term, we're in a rising wedge that the bond market has obeyed quite well. If we rise directly to the top of the channel, that would imply a May 2019 break of this uptrend and a recession / bear market starting around mid 2019 into 2020. Who knows how this actually plays out, but I know we haven't hit a true bond bear yet, and even when we do, it'll probably be far less exciting than people want to believe.
Clear Leading Diagonal - time for a pullback - then up, up, awayThe minute leading diagonal has clearly broken the larger downward wave, which ended in a larger ending diagonal...
Expect a short term pullback to the wave iv level and then a continued rise at least 1.618 times the length of this first leading diagonal wave...
Short term pullback would be consistent with a modest recovery in equities early next week before a larger sell-off in equities as the treasury rates resume their rise...
US 10 year yield will rise to 3.35% within 2-3 monthsRecent NFP report was very positive and this confirms our long term view on US interest rates upside trend.
Now, there is 99.8% probability of Fed rate increase to 2.25% in September and 77.58% probability of rate increase to 2.5% in December.
Prob. has increased for ~10% due last NFP data.
It totally confirms the technical picture that we have.
Rising rates: Why is the 30 year yield so low? The 30 year treasury yield has traded under 3.25% for almost 4 years now.
The Fed continues to hike rates on a quarterly basis and Trump is unhappy about rising rates.
Every day we hear how the economy is 'in great shape', and jobs data is 'as good as it gets'.
More significantly what is pushing up rates are increased treasury issuance and the Fed's accelerating Quantitative Tightening.
So all in all why isn't the 30 year yield closer to 4% like it was only four years ago?
For several years the market has priced in low expectations for the long term.
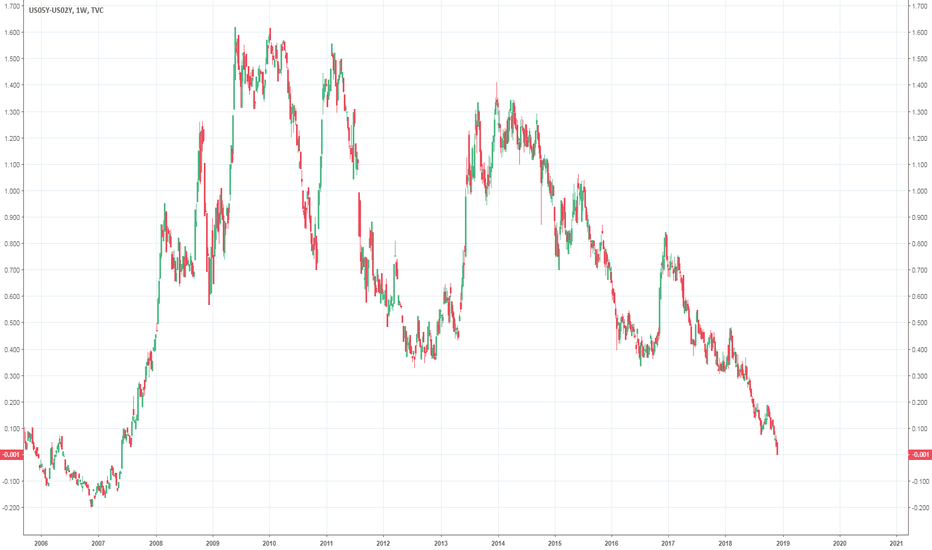
The yield curve continues to flatten towards the lowest spreads since leading up to the great recession.
(28 basis points on the 30-5 spread and 30 points on the 10-2 spread).
At this rate the curve could flatten or invert in 6 to 12 months.
An inverted yield curve historically is followed by economic recession.
What's your thoughts?
TLT: Immediate upside likely...$TLT (or futures) offer a good long entry here, with a relatively big risk/reward ratio if the trade pans out favorably. I'd say odds are 65% it does work, so definitely worth a try.
With stocks and gold down for the day I'm inclined to get some exposure here to hedge my portfolio.
Best of luck,
Ivan Labrie.
US Treasuries yieldUS Treasuries yield reaches the lowest level since near 11-years.Treasuries US yield reaches the lowest level since near 11-years.
Bonds Remain IrrationalRegarding today's bond market behavior, I am reminded of the following words of wisdom mostly attributed to the economist John Maynard Keynes:
"The market can remain irrational longer than you can remain solvent."
From Trump's successful efforts in negotiating an end to a 70 year North/South Korean war, and denuclearization of NoKo, to the Fed raising interest rates hawkishly, to the ECB finally declaring an end to QE, everything seemed to support the bond market collapsing further.
My original profit target in ZN1! was right about where the red arrow is. I anticipated it to retrace the entire move from the FOMC meeting. Perhaps it is because the bond market is historically bearish. Perhaps it is because big players are cashing out of their net short positions, or because insiders know something we don't, but US treasuries have stabilized and have formed a range, if not a bull flag.
The Kovach Indicators (at the bottom) show a solid bullish trend, and we have broken numerous levels of resistance. Perhaps we need more data events like the Empire State Manufacturing Survey, or Consumer Sentiment tomorrow to help this sleeping giant awaken once more.
US 10-year T-notes. Downside could be limited. Target corrected.This idea supports the previous interest rate outlook.
I advise you to book profits on the idea given last September (see related) earlier than set target at 116'07
and this is why:
The long-term trend together with the previous low offers strong support for the price and could reject the drop in the 117-118 area.
In this area the wave C = 1.272 of wave A and this also fortifies the support.
So better close shorts there.
Short Squeeze for the Treasury bearsTypically I have seen that when everyone is on one side of the trade its quite easy for the market to make fools of the participants.
The speculative short position on US treasuries, specifically the 10 year, is massive (and for good reason).
While I remain a longer bear view on these treasuries I think we might end up seeing a short squeeze before we see 3% yields.
The 10 year is showing some signs this could accelerate and hurt alot of bears who need to cover their positions.
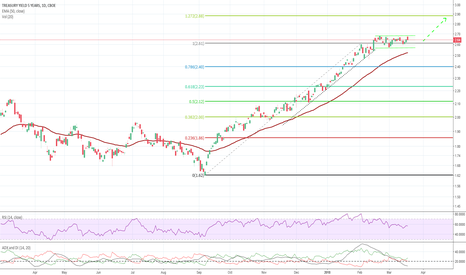
5 years treasuries in bullish flagthe course of the 5 years treasuries have rosen from 1.62$ to 2.60$.
Even if the market expectations for higher interest rates are still active we can see a little consolidation on this level - which is the fib retracement 100.
After the consolidation in this flag pattern we can expect a continuation of the rise to prices around 2.90$ (fib extension 1,272%).
RSI: a little bit weaker but still in buy zone
ADX: DI+ just turned to up, but low momentum
conclusion:
no change in trend, only some consolidation
Range-bound between $117-$122.50After completing Head & Shoulder formation and breaking down below $122 support, reached our $117 targets, and now range-bound. Trends remain bearish, watch for a break below $117 support for continuation lower, targeting $114 (minor) and $110 (major) support levels.
Use Vertical Put Spreads to limit your risk when taking bearish bets. Register for a free 30 Day Trial to OptionsPlay .
USD interest rate growth could be limited by previous top.At the end of last September I called for the drop in the 10-year US T-notes with quite aggressive target (see related idea).
In this and the next update I came to the thought that the drop could be over earlier as rates are reaching important resistance level.
Despite the aggressive tone on the rate rise in US, I think the upside is limited based on this chart.
Wave 5 of (C) already has reached the target zone and approaches the former top at the 3.04% where the wave 5 = 0.786 of waves 1-3.
It is quite possible that when we would reach that area above 3 pct something in the economy could cry out - stop it!
Let's see!
The Bond Bears Paint in RED!The correction from the ATH was inevitable as the Dow broke well above it's long term growth channel. What we've seen in the past few days is hungry hungry bears beginning to feed when the 10 year T Note reaches the 2.85% yield mark with today being no different. What's important to recognize in this relationship is how the DOW bulls are attempting to hold on these downward movements. The 1100 point drop found support at both the 100 day MA and the 0.236. The next two days show a brief brake of this support as well as an attempt to break out of the long term channel again and find higher support at the 50 day EMA. This breaking out of the longterm channel and holding at the 50 day EMA seems to be overly bullish as we had another 1000+ point drop with the market now closing below the 0.236 fibonacci marker. Currently sitting in a tricky spot within both the long term uptrend and short term down trends channels, as well as beneath the 50 day EMA support, with current volatility makes predicting the market a dangerous move, however it seems reasonable to expect that Bonds and Equities will continue their jazzy swing dance range trading within downward channel until a support is found in the short term. The 0.236 and the 100 day MA has been a decent point of resistance up until late today so it is not out of the question a consolidation occurs here with an attempt to breakout of the downward channel, however the 200 day MA and the .382 are also certainly within reason. Consolidation at either of these two areas does not call for a market reversal in the short term, as again they both reside within the current long term uptrend channel, however a break below the 200 day ma could be a much stronger signal towards the idea that this is a reversal of the long term trend, only time will tell.
*This is by no means financial advice and I'm quite new to this, so take the analysis with a grain of salt and use it as a gauge against your ideas, not as a sound prediction from an expert. Furthermore, critiques are also more than welcome.*
TBF heading higher: on the verge of major breakout!AMEX:TBF is poised for a major breakout of its long-term downtrend channel short term bullish wedge. As interest rates continue to rise, TBF is poised to benefit. Both the fundamentals and the chart are beginning to align. I will be taking a position in TBF sometime this week.


