GBP/USD drifting ahead of UK GDPThe British pound is calm on Wednesday. In the European session, GBP/USD is trading at 1.2297, up 0.10%.
The UK economy has been struggling and GDP declined by 0.5% m/m in July. The markets are expecting a rebound on Wednesday, with GDP projected to rise by 0.2% m/m in August. For the three months to August, GDP is expected to increase by 0.3%, up from 0.2% in the previous release.
The IMF report on Tuesday didn't bring much cheer, with the report stating that the Bank of England would need to maintain elevated interest rates into 2024 due to weak growth and sticky inflation. The same day, the BoE's Financial Policy Committee also said that rates would have to "stay high for a long time", warning that would put pressure on households.
The Federal Reserve has kept to a hawkish script, trying to convince the markets that the tightening cycle may not be over. That message has changed in recent days, as the Fed has become more dovish. The reason? US Treasury yields have been rising sharply, with 10-year yields hitting a 16-year high on Tuesday. The spike in yields has made borrowing costs more expensive and could act as a brake on the economy and push inflation lower without Fed intervention.
Atlanta Fed President Raphael Bostic said on Tuesday that the Fed didn't need to raise rates anymore in order to push inflation back to the Fed's 2% target. Bostic is considered a dove, but he has support for this position. Dallas Fed President Lorie Logan and San Francisco Fed President Mary Daly both stated that the increase in Treasury yields could mean less need for the Fed to raise rates in the current tightening cycle.
1.2179 and 1.2097 are providing support
1.2321 is a weak resistance line. Above, there is resistance at 1.2403
Treasuries

Pound moves higher, BoE points to pressure on consumersThe British pound is higher on Tuesday. In the North American session, GBP/USD is trading at 1.2273, up 0.29%.
The Bank of England's financial policy committee (FPC) voiced concern about consumer borrowing. The FPC noted that consumers were taking longer mortgages and increasing spending on credit cards in response to being squeezed by higher interest rates and the cost-of-living crisis. These practices have raised concerns about consumer debt levels. The FPC found that the UK banking system was "relatively stable".
The UK economy has been sputtering, and the IMF raised its 2023 growth forecast for the UK to 0.5%, up from 0.5% in the previous forecast. However, the IMF cut the 2024 growth forecast to 0.6%, down from 1.0% previously. The IMF noted that the BoE would need to maintain elevated interest rates into 2024 due to weak growth and sticky inflation.
US yields have been rising, and that could affect Fed rate policy. On Monday, Fed members Jefferson and Logan said the spike in long-term bond rates could mean less of a need for the Fed to raise rates. The reason is that borrowing had become more expensive and inflation could ease without the Fed needing to raise rates.
US 10-year yield rates rose as high as 4.8% last week, a 16-year high, compared to 4.0% in July. Higher yields on Treasuries have led to an increase in other borrowing costs, including mortgages and consumer loans. This could put the Fed's hopes for a soft landing in jeopardy and are providing support for the Fed to hold rates until next year. The odds of a rate hike before the end of 2023 have dropped to 24%, compared to 39% just one week ago, according to the CME FedWatch Tool.
1.2179 and 1.2097 are providing support
There is resistance at 1.2321 and 1.2403

USD/CAD - Canadian dollar stops nasty slideThe Canadian dollar has steadied on Thursday. In the North American session, USD/CAD is trading at 1.3728, down 0.12%.
The Canadian currency has stabilized after a nasty four-day slide, in which it declined 1.9%. The US dollar continues to look strong against the majors, as "US exceptionalism" continues to make the greenback attractive to investors.
The Canadian dollar is also getting squeezed by falling oil prices, as oil is a major export for Canada. Crude oil prices slid around $5 on Wednesday, its biggest daily drop in over a year, and fell further on Thursday before recovering. The rise in bond yields, which have raised fears of a global economic slowdown are weighing on investor sentiment towards oil.
On the economic calendar, the Canada Ivey PMI eased slightly in September to 53.1, down from 53.5 in August, but easily beat the market consensus of 50.8. The PMI has indicated expansion in economic activity in eight out of the past nine readings. As well, the job creation component rose from 58.5 to 54.8 in August, marking a six-month high.
These are encouraging figures for the Canadian economy, which has run into some headwinds, such as a flatlined GDP in August. Canada's economy contracted in the second quarter, and a repeat in Q3 would indicate a technical recession.
The Canadian dollar could show some volatility on Friday, with the US and Canada both releasing employment reports for September. Canada is expected to have added 20,000 jobs in September, which would be half of the gain in August of 39,900. The Bank of Canada will be keeping a close eye on wage growth, which is projected to rise to 5.5% y/y, compared to 5.2% in August.
All eyes will be on the US nonfarm payrolls, which is showing signs of cracks, with three straight releases below the 200,000 mark. The August release came in at 187,000 and the consensus estimate for September stands at 170,000. Wage growth is expected to tick up to 0.3%, compared to 0.2% in August. An unexpected reading in the NFP or wage growth reports could have a significant effect on the US dollar on Friday.
USD/CAD faces resistance at 1.3806 and 1.3864
1.3695 and 1.3638 are the next support lines

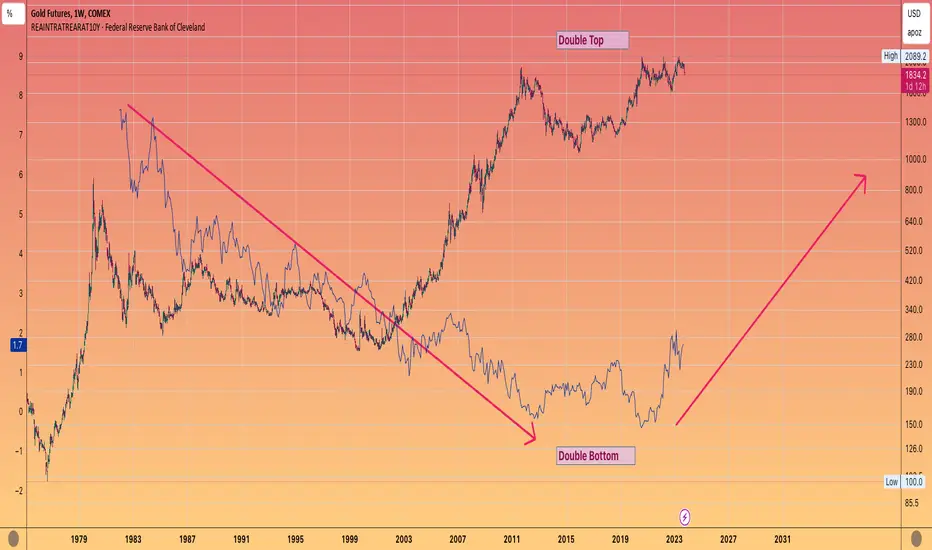
GOLD - Positive real rates is negative for GoldThe attractiveness of Gold is tarnished
When cash instruments yield a positive rate of return
More and more people are getting on board of higher interest rates
(Dimon, Santelli)
But u can see the Gold price has been inversely correlating with the rate of return for decades.
It's bull run in the 2000's along with the commodity bull , coincided with real rates trending to less than zero. Gold Topped a few months prior to that negative reading in 2012!
The current triple top that has been in place for he past 3 years , seems to be in danger of breaking down if rates continue up the next few years.
The key level to watch is last year's lows in October around $1611
Which I believe is a distinct reality if rates head up to 7%
S&P500 Vulnerabilities: from Money Supply to Sectoral ImbalancesAs much as we try not to repeat ideas here, occasionally, an opportunity emerges to harp on the same point.
As we have previously laid out the bear case for the S&P 500 from a historical volatility behavior perspective, this week we will zoom in on other metrics showing why we think the S&P may struggle from here.
The first and most interesting measure, in our opinion, is the S&P 500 when adjusted by the money supply. Once again it appears to have peaked and is on the path of reversal now. The S&P500 / Money Supply has reached these levels not once, not twice but thrice, stopping at the same level before reversing. More importantly, overall, we see the S&P 500 clearly climbing up in line with the level of money supply.
Money supply has been on a decreasing trend since the start of the Federal Reserve hikes. While the downtrend has been paused momentarily with money supply slightly increasing in early 2023 it now seems to have resumed the downward path. This could spell bad news for equities given that the S&P has broadly followed money supply and the clear resistance observed on the S&P 500 / Money Supply chart.
As yields creep higher, investors will eventually second guess whether it still makes sense to put more into the equities when cash now yields more. The 6-month treasury yield is now higher than the S&P 500 earnings yield, a phenomenon not experienced since the turn of the millennium. A federal reserve resolute in keeping rates higher for longer might just be the kicker for investors to turn to these shorter dated treasuries while waiting out equity volatility.
With a series of better-than-expected economic data, the Federal Reserve once again gains greater headroom to maintain its higher for longer stance, which is causing discomfort in the equities market. All eyes will be on the Non-Farm Payrolls numbers coming out tomorrow for further confirmation if the US economy can indeed take this regime of higher rates.
Within the S&P 500, the Technology sector remains the significant outperformer compared to other sectors like Financial, Consumer Staples and Energy. With the Technology Sector / Financial Sector ratio extending far beyond the trend from 2017.
The combination of money supply metrics, yield comparisons, and sectoral imbalances, among other factors, makes a compelling case for a bearish outlook on the S&P 500. For investors seeking targeted strategies, CME E-MINI Select Sector Futures offers a refined approach, allowing for an overall bearish view on the S&P 500 while building positions in certain sectors through a relative value strategy. To express the bearish view on the technology sector relative to the financial sector, we can take a short position on the E-MINI Technology Select Sector Futures and a long position on the E-MINI Financial Select Sector Futures. Given the contract size differences, to roughly match the notional, we will need 3 E-MINI Financial Select Sector Futures at the current level of 405 to match 2 E-MINI Technology Select Sector Futures.
3 x E-MINI Financial Select Sector Futures Notional = 3 * 405 * 250 USD = $303,750
2 x E-MINI Technology Select Sector Futures Notional = 2 * 1678 * 100 USD = $335,600
Each 0.1 index point move in the E-MINI Technology Select Sector Futures is $10, while each 0.05 index point move in the E-MINI Financial Select Sector Futures is $12.5.
The charts above were generated using CME’s Real-Time data available on TradingView. Inspirante Trading Solutions is subscribed to both TradingView Premium and CME Real-time Market Data which allows us to identify trading set-ups in real-time and express our market opinions. If you have futures in your trading portfolio, you can check out on CME Group data plans available that suit your trading needs www.tradingview.com
Disclaimer:
The contents in this Idea are intended for information purpose only and do not constitute investment recommendation or advice. Nor are they used to promote any specific products or services. They serve as an integral part of a case study to demonstrate fundamental concepts in risk management under given market scenarios. A full version of the disclaimer is available in our profile description.
Reference:
www.cmegroup.com
www.cmegroup.com

TLT ~ Weekly Swing Chart (Oct 2023)NASDAQ:TLT chart mapping/analysis for med-long term swing trade strategies.

Will $TNX catch up to shorter term yields?G-Morning!
Shorter term yields haven't moved much as of late.
Demand has slowed down & this coincides with the expectation that the #fed will be cutting rates soon.
The 2Yr #yield recently caught up with the strength of the shorter term #InterestRates & looks to be settling in the area just like the others.
On the other end the 10 Yr #yield has been pumping.
HAs been strong & hasn't been this overbought since Sept 22.
Many compare #InterestRates to GFC (Great Financial Crisis) but they were on their way DOWN vs now, they are on the way up!
Back then this was not much of an issue because #debt was SIGNIFICANTLY lower. Compared to Trillions now.
TVC:TNX

Bitcoin Has Absorbed $26,500 but What's This?Traders,
In my last post I stated that BTC must absorb the price of 26,500 for the bulls to come back out and play again. It did. Now, we are running into the 50 day moving avg. which is acting as resistance and should give those of us seeking re-entry into longs a bit of time to make those entry decisions.
However, I spotted something sus on the U.S. treasuries chart and it seems that nobody is really talking about this. Both the 10yr and the 2yr experienced a massive spike! What caused this? TBH, it is causing me some hesitation. Could this be pre-indicative of a credit event of some sort? Thoughts, links, data are appreciated in the comments below.
Stew

$TX 10Yr has done well while short term yields stagnant, oh ohIt's important to keep and eye on the 10 & 2Yr yields.
The inverted #yield curve has huge prediction probability.
BUT
The strongest aspect of this is when it normalizes.
We're not far from that as the10yr has been pumping and the shorter time frames have been pretty stagnant. Now, there's 2 ways this happens.
Soft landing, economy slowly recovers
OR
Lower rates, usually = consequences
Guess which is the historical?
TVC:TNX

$TNX, 2Yr Yield, $DXY, $VIX analysisThe 10Yr - TVC:TNX and the 2Yr #yield have held pretty steady the last few days.
Won't be shocked if it doesn't do much until the DJ:DJI & TVC:NDQ , "coincidentally", break out of the patterns we've spoken about.
TVC:DXY losing a lil bit of steam. Is it topping again?
The only odd man out is the $VIX.
It's closer to the lower end of range. IMO this is just something to look at and not of much use until it is.
September will go out with a BANG!!!
One way or another!

3x Inverse TLT ETF: Breaking Out of Descending Broadening WedgeThe Inverse ETF for the 20-Year US Government Bond is currently breaking out of a Descending Broadening Wedge and is looking to go much higher perhaps between the 61.8% and 78.6% retraces which would be about a 500-1,400% percentage gain which also means that longer end bond yields are going much higher.
I previously said I would repost this chart after the split so that the numbers would be accurate, and now that split has happened. I have my eyes on the $36 to hold and am currently looking to get some calls for that strike price expiring next year.
It's worth noting the Partial-Decline we got before breaking out of the Broadening wedge, which makes it more likely to play out.

TBT- a bearish treasury ETF LONGTBT on the 30 minute time frame shows a trend up in an ascending parallel
channel now at the bottom of the channel where it could go up or breakdown
and go under the channel. The ZL MACD suggests some bullish divergence while
the dual TF RS indicator and the ADX oscillator are non-commital.
The immediate recent short term volume profile with a POC line above price
suggests a lot of trading above price and likely short sellers. A longer time
interval volume profile shows the POC line more than $1.00 below current price.
Price could easily gravitate in the direction of that price magnet.
Overall, I see a bias for a bearish move and will watch this to confirm. i will play
this with put options to leverge the amplitude of the move albeit at higher
risk.

US 10 Year Treasury vs USD/JPYTLDR:
The US 10-Year Treasury Yield and the closely correlated USD/JPY pair can be determinants or signals of market risk. With both breaking their three decade long trends, you have to wonder is a major secular shift upon us.
The USD/JPY currency pair has traditionally had a close correlation with U.S. Treasuries.
The pair shows how many yen are required to buy one U.S. dollar
The pair's exchange rate is one of the most liquid, not to mention one of the most traded, pairs in the world. That's because the yen, just like the U.S. dollar, is used as a reserve currency.
When yields on Treasury bonds, notes, and bills rise, the Yen tends to weaken relative to the dollar. When interest rates head higher, Treasury bond prices go down, which lifts the U.S. dollar, strengthening USD/JPY prices
The US 10-Year Treasury Yield and the closely correlated USD/JPY pair can be a determinants or signals of market risk. With both breaking their three decade long trends, you have to wonder is a major secular shift upon us.

$TNX has been pumping while short term yields fizzleGoing to bring this up AGAIN.
Short term #yields have been stagnant for some time now. Most are trading within a VERY TIGHT RANGE.
3Month - 1Year yield has been relatively flat.
The 2Yr had nice bump but is struggling to go over 5%.
HOWEVER, we pointed this out some time ago, the 10YR has BEEN PUMPING! TVC:TNX

As Deflation Hits the Economy The Price of TIPs Should FallEarlier in 2022 I got some Bullish Exposure to Deflation by positioning Bearishly against TIPs (Treasury Inflation-Protected Securities) as can be seen here:
Fast-forward to today and we can now see the CPI declining and the TIPs declining even faster, This ETF Tracks the price of these TIPs and we can see that it is breaking through support even though the CPI has only retraced half way. If the CPI continues on this path and the Bond Market continues to price in Long Term Deflation, we should then see the pricing of this TIPs based ETF come down crashing in a big way. If that does happen, I would target at least the 1.618 Fibonacci Extension.

US debt ceiling debacle and US 10-year yieldsUS 10-year bond yields have been trending lower since Oct 2022 after touching high around 4.250%. The rise in the 10-year yield from the past two weeks saw yields stop just short of the blue 61.8% Fibo level of 3.885%. Yields are currently testing the 200-day MA rate of 3.649% and a break below will allow bonds to rally further towards the 50-day MA rate of 5.525% which coincides with the black 61.8% Fibo rate of 3.474%.
I expect bond yields to get intimidating soon as the bond rally runs out of steam. Here follows the main fundamental reasons why I believe 10-year bond yields will soon climb above 4.00%.
1. Global financial conditions are easing, and excess liquidity is rising. Short-term rates seem to be peaking not just in the US but globally. Once global rates have peaked, it will allow the market to price in a future cyclical upturn for the US economy. Longer-term yields will capture this sentiment by moving higher as investors will prefer riskier assets to reap the rewards on buoyant liquidity conditions.
2. Inflation is becoming entrenched. Bonds are not a good inflation hedge which will further motivate the sell-off in longer-term treasuries. Heightened inflation expectations are the canary in the coal mine warning that bond holders may soon demand extra yield to lend money.
3. Bond issuance will rise when the debt-ceiling debacle is resolved. Additionally, the debt ceiling has brought scrutiny to the US’s fiscal situation which will dampen investor appetite for US debt (safe haven or not). Furthermore, foreign reserve holders have begun to diversify their holdings, while elevated short-term rates have raised FX hedging costs and kept buyers like Japan away.

Yields Prepped to Spike Higher after a Confirmed TLT BreakdownThe TLT has broken down an Ascending Broadening Wedge and given us one Bearish Confirmation back test; now we are looking for a second lower high within the range of the breakdown to truly get convicted on the move. However, for the time being, I do think this chart should be watched, as I have a suspicion that a lot of the shorter- and midterm bond yields are going to spike higher along with the US Dollar for reasons I already explained in this post here:

TMV leverage inverse ETF for treasuries SHORTTMV on the one-hour chart tested two standard deviations above the mean VWAP in
both late May and early July it fell to one standard deviation below VWAP but then rose
sharply into beyond the two standard deviations line ( thick red ) ascending into a YTD high.
I believe that this is due to the recent federal debt creditworthiness downgrade.
The threatened rise of BRICS reserve currency and potentially adversely affects the
value of the dollar ( DXY) while supporting gold prices. I see this as a good continuation play
no matter the overextension of price. Both the dual MTF and the zero lag MACD however
suggest a pullback. The mass flow indicator does as well. As a result I will look at TMF
to go long trusting the indicators to give me a directional bias.

TMF ( 3X Treasuries)beatdown completed reversal underway LONGOn the one-hour chart, TMF a triple ETF of long-expiration treasuries has finally
completed its downtrend or ten days given more bearish momentum with the federal
debt downgrade of creditworthiness as well as the rise of BRICS as a reserve currency.
Three indicators show bullish divergence with a MACD cross under the histogram. The
30 minute RS line rising before the 2 hr RS line reacts and importantly a mass index
signal rising into the reversal line and then a drop. While none of this is a Holy Grail,
I am confident that the bias here is bullish. I will trade long if you are interested in
the stop loss and targets let me know. If you would lke my idea of an options setup, let
me know as well. If this idea is helpful, please like and subscribe. Trade well !

The Overnight Reverse Repo Facility Looks to be Bottoming OutMoney that has been parked at the Fed's Reverse Repo Facility due to the attractively high interest rates the Fed has set for money parked there has been on a steady decline since late 2022, and recently, this year we confirmed a breakdown of a Bearish Dragon, which led to a BAMM move down to complete a Harmonic M-shape.
This then represented an influx of liquidity exiting the facility and effectively hitting circulation, which led to that money chasing assets and commodities. This chasing of assets and commdoities effecctively backed the 2023 Stock Market Rally.
The target I had set for this move was down to the 0.886 of a Bullish Bat and now months later we can see that we came very close to it, but it would seem that rather than getting a full 0.886 retrace we are instead getting a confirmation-styled RSI reaction as price Bounces from the 1.618 Extension, which just so happens to align with an AB=CD formation it's made on the way down.
I see this as an indication that the liquidity will soon stop flowing out from the facility and that liquidity will now begin to flow back to the facility, effectively taking money out of circulation, which would likely result in a decline in asset prices and a decline in the trading of Short Term Debt on the open market, which could then lead to Short Term Yields rising overall along with the US Dollar as institutions once again begin to lock up their dollars in this facility and chase yield rather than assets.
Recently, I have been seeing a lot of weakness in the banking sector. That weakness may act as a catalyst for these institutions to once again park their money with the Fed, just as it did before. As always, my target for an ABCD is back to the Level of C, so we should see this rising back up about 30% before we can start looking for signs of this topping out again.

TMF Bull Treasuries Triple Leveraged LONGTMF as shown on a 15 minute chart shows TMF in consolidation at the beginning of the weeks
followed by a downtrend when the fed news of the rate hike came out. Today the general
market dropped after some federal financial data came out and a treasury auction was a dud
with little buyers confounded by Bank of Japan actions inconsistent with the path of the US Fed.
The mass index indicator has signaled a reversal as the signal rose above the reversal zone
and then dropped below the zone thus triggering. The Relative Trend Index documents
the end of the downtrend with the signal line nearly returning above zero. Overall, I think
this leveraged ETF overreacted to the federal news and the catalyst from Japan. I believe
this to be an good point to enter long using the pivot low as the stop loss. Targets are 7.20
just below the mean anchored VWAP and 7.45 just below the lower boundary of the high
volume area of the intermediate term volume profile. This offers modest potential profile
for a relatively low risk.

TLT Short term Treasuries Bullish LONGTLT as shown on a 30 minute chart shows TLT in a narrow range last week and then a pivot
down to begin this week followed by a downtrend and a small correction until then the fed
news of the rate hike came out. Today the general market dropped after some federal financial
data came out and a treasury auction was a dud bond auction with little transactions occurring
confounded by Bank of Japan actions inconsistent with the path of the US Fed.
The mass index indicator has signaled a reversal as the signal rose above the reversal zone
and then dropped below the zone thus triggering. The Relative Trend Index documents
the end of the red downtrend with the signal line nearly returning above zero. Overall, I think
TLT traders overreacted to the federal news and the catalyst from Japan. I believe
this to be a good point to enter long using the pivot low as the stop loss. Targets are 100.5
just below the mean anchored VWAP and 101.5 just below POCl line
volume area of the intermediate term volume profile. This offers modest potential profile
for a relatively low risk. However, I intend to trade this intraday as a same day expiration
(0DTE) option striking 101. I will set a set a stop-loss on the option of 15% while expecting
potentially 50-200% ROI making for an acceptable ratio.

Unveiling the Secret Relationship: US 10-Year Treasury and GoldAs you may already know, the US 10-Year Treasury is a government bond that benchmarks long-term interest rates. Investors often turn to this instrument as a safe haven during times of economic uncertainty or market volatility. In contrast, gold has long been considered a store of value and a hedge against inflation. It is highly sought after in times of economic distress, making it a popular choice for investors looking to diversify their portfolios.
What's truly captivating is the observation that the US 10-Year Treasury and the price of gold tend to move in opposite directions. When the yield on the 10-Year Treasury rises, indicating increased investor confidence and potentially higher interest rates, the price of gold often experiences a decline. Conversely, gold prices tend to increase when the yield on the 10-Year Treasury falls, signaling economic uncertainty and the potential for lower interest rates.
This inverse relationship can be attributed to various factors. Firstly, rising interest rates make fixed-income investments, such as bonds, more attractive, diverting funds from non-yielding assets like gold. Secondly, as the US dollar strengthens with higher interest rates, gold, priced in dollars, becomes relatively more expensive for foreign buyers. Lastly, lower interest rates often lead to increased inflation expectations, making gold an appealing investment due to its historical ability to preserve purchasing power.
You might wonder how this knowledge can practically apply to your trading strategies. Well, my friend, here comes the call to action: I encourage you to closely monitor the direction of the US 10-Year Treasury to predict potential movements in the price of gold.
By staying informed about the yield fluctuations of the 10-Year Treasury, you can gain valuable insights into the overall market sentiment and potentially anticipate shifts in gold prices. This knowledge can help you make more informed trading decisions and position yourself advantageously in the market.
Remember that while the inverse relationship between the US 10-Year Treasury and gold has proven to be a reliable indicator, conducting a thorough analysis and considering other factors that may influence gold's price is essential. Market conditions are ever-changing, and no single hand can guarantee success. Therefore, combining this knowledge with other technical and fundamental analysis tools is crucial to maximize your trading potential.
In conclusion, understanding the inverse relationship between the US 10-Year Treasury and gold can be valuable to your trading arsenal. By closely monitoring the direction of the 10-Year Treasury, you can gain insights into potential movements in gold prices, allowing you to make more informed trading decisions.
