EUR/USD eyes eurozone and German services PMIsEUR/USD is drifting downward on Tuesday. In the North American session, the euro is trading at 1.0898, down 0.15%. The US markets are closed for the July Fourth holiday, and we can expect limited movement from EUR/USD for the remainder of the day.
After disappointing German and eurozone Manufacturing PMIs on Monday, it's the turn of Services PMIs on Wednesday. Although the Service PMIs are expected to weaken, both are expected to point to expansion, with readings above the 50.0 level. The eurozone PMI is expected to dip to 52.4, down from 55.1, while the German PMI is projected to slow from 57.2 to 54.1. The euro didn't show much of a reaction to the Manufacturing PMIs, as the prolonged decline in manufacturing was not a surprise. I don't expect the Service PMIs to weigh on the euro unless the releases are below expectations.
The markets will be keeping a close on the Fed minutes from the June meeting, which will be released on Wednesday. The Fed delivered a 0.25% hike at the June meeting and the markets are widely expecting a repeat in July, which would bring the cash rate to a range of 5.25%-5.50%.
The markets have fallen into line with the Fed's aggressive stance, and investors are no longer expecting a rate hike or two before the end of the year. Fed Chair Powell has hinted at one more rate hike after July before the end of the year and there are growing concerns that if the Fed continues to increase rates the economy will tip into a recession.
The spread between 2-year and 10-year Treasury note yields hit its widest level since 1981 on Monday, raising fears of a recession. A yield curve inversion is considered a reliable indication of a recession and the current inversion has been in place since July, stoking concern about the direction of the US economy.
EUR/USD is testing support at 1.0908. This is followed by support at 1.0838
1.0980 and 1.1050 are the next resistance lines
Treasuries

The Overnight Reverse Repo Facility Looks to be Breaking DownMoney that is being parked at the Feds Reverse Repo Facility due to attractively high interest rates the fed has set for money parked at the facility has been on a steady decline since late 2022 and we have now confirmed a lower high and are looking to break down below a Bearish Dragon trend line that could be the initial trigger that gets it started to going down all the way to an 88.6% retrace or lower even. One can only speculate that the money exiting this facility will lead to more trading of short term debt on the open market, which could eventually lead to yields coming down overall and for all of this excess liquidity to chase Equities instead as the value of the US Dollar declines due to the shock of all this newly added supply of liquid cash to the open market thereby causing a loosening of market conditions.

Short Term Bond Yields Setting Up to Crash along with the DollarThe 3 Month Bill is currently breaking down and backtesting a Rising Wedge after Bearishly Diverging at some extreme highs while the DXY has also broken below a long term trend line and is backtesting the S/R Zone and Moving Averages as Resistance.
I have expectations that both of them will crash majorly in the coming weeks to months.

US 10 Year Yield On The Cusp of Breaking DownThe 10 Year Yield has been trying to hold this B point level as Support for the longest time but everytime it tries to bounce it gets pushed right back down and in the most recent try we saw it come up to test the moving averages while it Bearishly Diverged and began a Death Cross. If we can get a serious BAMM Breakdown from here it coulkd go down all the way to 1.4% which would likely coincide with a huge decline in the DXY and a rise in the stock market.

10 Year Futures - Bear FlagAnother bear flag on the ZN monthly, but this one is massive with lots of volatility. The next leg down might be ugly.

Is the yield curve about to turn? The 10Y-03MY yield curve is the lowest ever. It looks like it cannot go any lower. Is it about to turn? And will it bring DXY up with it? An option is to buy AMEX:MINT or LSE:IBTE to play that trade.

TMF 20 year 3x Leveraged Treasuries ETFTMF completed an uptrend from 3/28 to 4/6 and then a retracement of it.
It is now positioned above the 0.5 Fibonacci level also the VWAP of the anchored
multisession VWAP indicator in the fair value ( and high volatility ) area also
near to and importantly above the POC line of the intermediate-term volume
profile. This high confluence yields strong support for the continuation of
an uptrend targetting $10.00 the pivot high this past February with a stop loss
of $8.92. For those looking for a high reward entree with the requistite
risk appetite a call option with a strike of $9.00 or $ 9.50 expiring 5/19
or 6/16 might be what is on the menu.

% BONDS & INTEREST RATESThere's obviously lots of discussion about interest rates and where they are headed. Today, I'm going to look at long-term interest rates based on the well-known ETF: $TLT . Long-term interest rates are useful as a guide for most people who get a home-loan or longer-dated loans and is usually less prone to manipulation (by Central Banks) than short-term rates.
Bond prices move inverse to interest rates. A rise in bond price means a lower interest rate and vice versa.
📈📉 Let's have a look at the long-term chart. I'm using the weekly timeframe to remove the day-to-day noise.
You can see that since the January 2020 peak, bond prices have fallen. This was when interest rates bottomed and started rising. The bear market in bonds extended to Oct 2022. Subsequently, we have seen a rally in bonds and therefore a drop in interest rates.
The multi-trillion dollar question is: Was Oct 2022 the BOTTOM i.e. has interest rates peaked?
My technical view is that the bearish trend in bonds is still the dominant force. So far the bounce off the bottom does not yet signal a trend reversal. For this to be the case, I need to see TLT move higher beyond 114.
IF price moves beyond 114, I would be more confident in stating that at a minimum there has been a Change in Behaviour. At that price level, the size of the upward move would be the largest since the Jan 2020 top. Larger than the upward bounce that began in Mar 2021 and ended in Nov 2021.
A Change of Behaviour signals that market participants are starting to have differing opinions. It is this change in opinion that sow the seeds as the first step required for a trend change.
If the bond price falters prior to reaching beyond 114, it is highly likely that we have not seen the bottom and higher interest rates should be expected.
Clearly the next few weeks will be crucial in that determination. I will update my thoughts as the price evolves.

TLT: Trade Idea Before More Fed QEThe signal I was waiting for to start buying bonds was whenever the Federal Reserve stopped or slowed raising interest rates. The Fed held another rate policy meeting this week and only raised the Federal Funds Rate by +.25% instead of the +.75% that had been the trend. We've gone from seeing a +.50% hike in Dec, to +.25% in Jan to +.25% this week after 4 prior straight +.75% hikes in mid to late 2022. Now that banks are failing and layoffs are starting to tick up, this weeks rate hike was likely the last for a bit unless inflation doesn't stay flat or go down before the next Fed rate meeting. You can search "2023 FOMC meetings" for the full schedule.
My thought here is that within the next 12-18 months the Federal Reserve will lower rates and begin buying treasuries again(aka money printing), and I think the time to start front-running that trade in to bonds is now for those who like to accumulate a larger position over time. The best way for the average trader or phone app investor to get into bonds is via "TLT", the iShares 20+ year Treasury Bond ETF, which tracks the 20-year treasury bond price rather than the interest rate on the 20-year bond. As rates go up, bond prices go down and vice versa. Right now I'm betting on rates having topped out(or close to it) and that bond prices are going to go back up over the next year or so as recession fears kick in and stock prices go lower. We've had a deep and long yield curve inversion to boot and those almost always precede a US recession. I have a recent post showing the yield curve inversion vs stocks vs US recessions for reference.
TLT price is trading at decade lows and holding above $100 after a dip down to $90. Seeing the price of any asset hold above nice round numbers is always a good sign, psychologically traders like round numbers.
The lower PPO momentum indicator is showing signs of a potential reversal in momentum from negative to short-term positive, and this is a monthly chart so it would be a significant event. A bullish crossover is what we want to see which is when the green signal line crosses above the purple base line in the lower PPO indicator. That would indicate a short-term return to bullish momentum on a monthly basis.

Recap of my trade for today on ZB1!Good afternoon and good evening dear traders!
At the morning I shared a post where I said to sell ZB1!, it's too late but you still have made some profits if you got in early. For my clients and I it was a good day in ZB1! and NATURAL GAS, we could make some good profits on the 4% drop of the NATURAL GAS and on the 1% of the ZB1!, I didn't share the NATURAL GAS one since I already posted the ZB1! one and I can't give the trades I give privately.
See you tomorrow on another forerecast!
If you got any question don't hesitate to ask!

SELL ZB1!Good morning dear traders!
I'm sharing with you one of my trades for today as I usually do.
I managed to share with you the TREASURY BONDS one, as you can see on the chart the price broke the channel for the fist time as a fake breakout, the 2nd time it did the same thing but it managed to come back down ad give us the confirmation to sell, my customers and I got in an hour ago, now since the market is on the move I shared it with you since I can't share them to pu lic at the same time I give it to my customers whom pay for signals.
TP and SL set them at your own risk
If you got any questions don't hesitate to ask I'll answer with pleasure

Recap of my trade for todayGood afternoon and good evening traders!
I'm sharing with you a recap of my trade for today, actually we caught the 1st up trend after breaking the support line with a quite high volume, then after having the highest volume of the day on the candle I put the 2nd arrow at we added another position to finish the trade on the market with 2 contracts and a respectful profit after seeing a squeeze of buyers and closed at the end of the red candle I put an arrow on. After that the price broke the support line of the channel I shared the trade with you too early to make some profit of it.
For more questions don't hesitate to ask and I'll be answering with pleasure.
PS: The autocorrect changed the FUTURE to FEATURE on the post I posted this morning

SELL US TREASURY BOND FEATURES Good morning traders, today I'm sharing with you my trade on TREASURY BONDS, you can see that it crossed the parallel channel with a quite high volume.
TP and SL set them at your own risk
In case you got any question don't hesitate to ask.

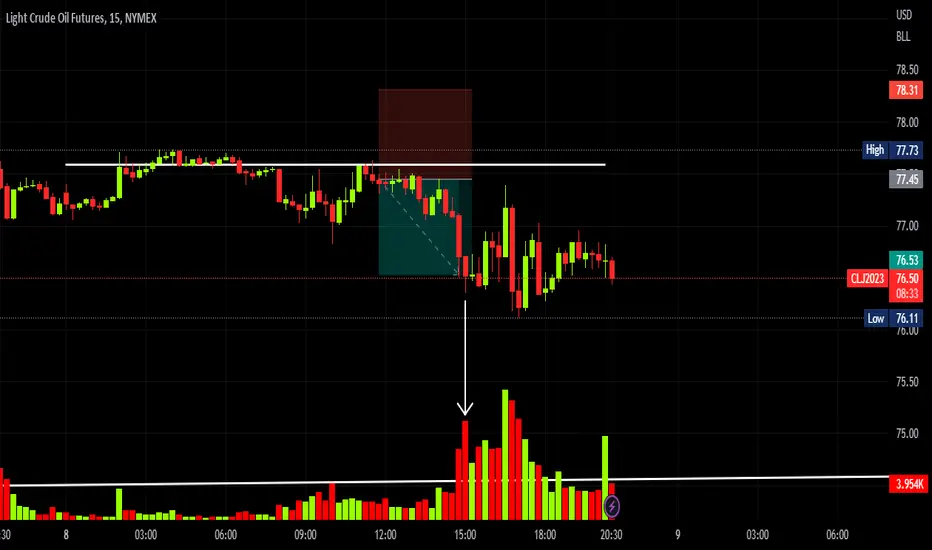
Recap of my trade for todaygood afternoon and good evening traders, I'm sharing with you the recap of my trade for today on CRUDE OIL, today I posted it too early than usual since my custommers and I got in multiple markets and were already on profit at the moment we got in this one.
The reason why we sold is theprice pulled back on thet resistance line which is provided by a tool I can't share to public, after we got what we call a squeeze on the trading system I follow we closed and ended the day with good profits, however yesterday was perfect, I didn't post since I got new custommer I was setting the chart with.
See you tomorrow on a new signal !
In case you got any question don't hsitate to ask!
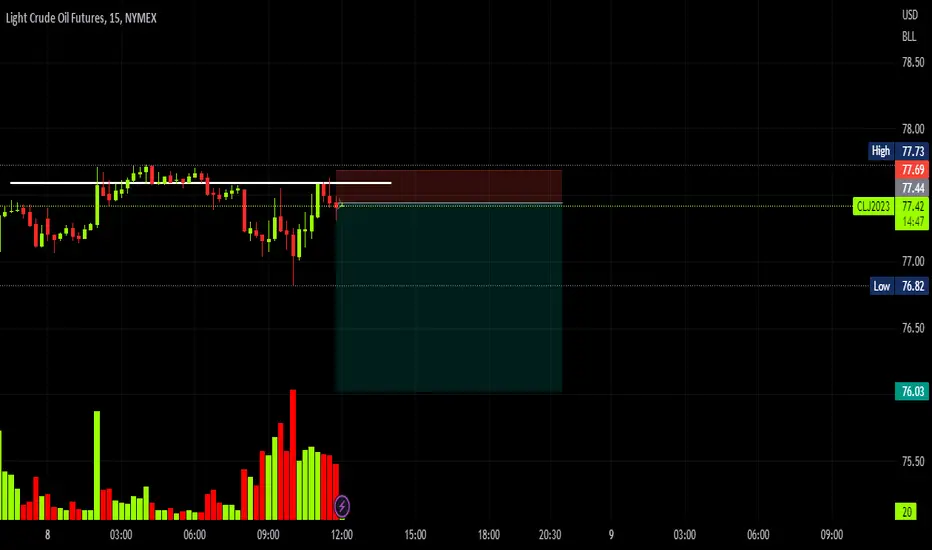
SELL CL1!Good morning traders, today I'm sharing with you a quick analysis on CRUDE OIL for day traders, as you can notice on the chart, we have a resistance line provided by a tool my mentor developed (I only share it with my private clients), the price came back up to retest on it to continue its way down.
SL and TP set them at your own risk
For more questions don't hesitate to ask.
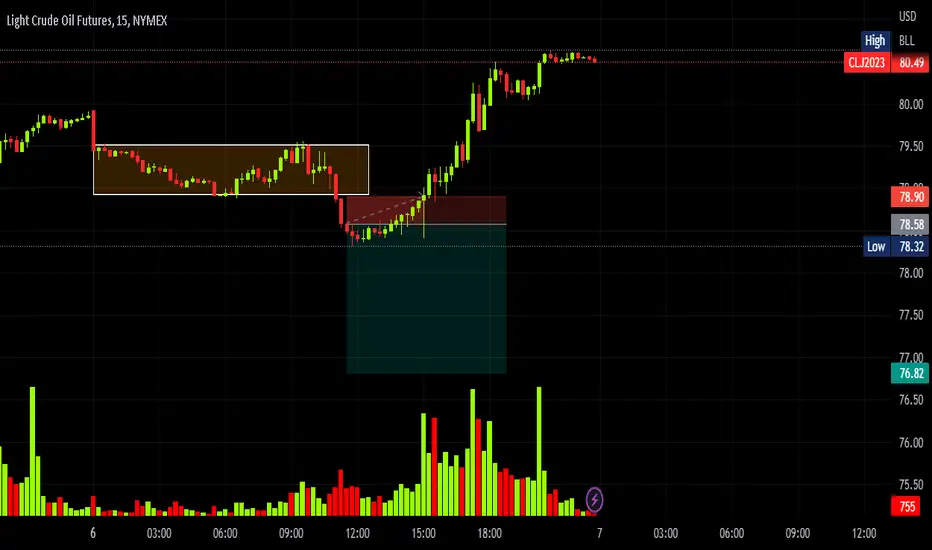
Recap of my trade for todayGood afternoon and good evening traders, for today on CRUDE OIL it went sideways and on the other 2 markets we traded and it's okay since this is how trading works, today's not our day so we stopped at the morning after losing 1.5K and we'll recover it in the following days.
I don't only share my wins, losses also must be shared so beginners know that trading isn't always winning sometimes it goes against you and also advances traders also have bad days in trading. Learn from your losses and never quit !
See you tomorrow in another signal.
In case you got any quesion don't hesitate to ask!
My Thoughts on Treasury Yields and Why You Should Care5% of on a 1-year US Government Bond Yield?
I never thought that I would see the day.
Many of us have grown up in a low rate world. Today, you buy a US Treasury bond, hold it for a year, and get 5%. That's more than most stocks yield in dividends, probably nearly double or triple the average. However, it's said that the S&P 500 averages 7% a year or so. Nonetheless, factor in recession fears and the trade becomes even more interesting.
What are government bond yields?
A government bond is a debt security issued by a government to raise money. When you buy a government bond, you're effectively lending money to the government in exchange for interest payments. The yield on a government bond is the return you'll receive on your investment, expressed as a percentage. So if a bond has a face value of $1,000 and a yield of 3%, you'll receive $30 per year in interest.
Why are government bond yields rising?
I can list out those reasons for you below:
1. Inflation
2. The Fed is purchasing less Treasuries
3. Economic growth is slowing, which means taxes will be less
What are the major implications?
Opportunity costs.
I'll say it again: Opportunity costs.
Everything that is bought, sold, and/or traded now must be weighed against this 5% yield. Do you want to buy Apple for the next year at its current valuation or take a risk to get 5% on a Treasury bond? You can substitute Apple for anything and everything that comes to mind from construction investments to crypto.
Do I own any bonds?
NO. I missed it and am only now paying attention. Will I potentially add some to my portfolio? 5%? It's possible. That's why I wrote this idea. I want to share my thoughts and add a few of these symbols to my watchlist.
I look forward to reading your comments!

Yield Curve InversionThe chart above is a yearly chart of the ratio of the 10-year Treasury yield (US10Y) to the 2-year Treasury yield (US02Y). The chart is meant to highlight how extreme the yield curve inversion is getting. Typically a yield curve inversion is indicative of an impending recession.
Usually, the 10-year treasury should have a higher yield than the 2-year treasury since there is more risk involved when you invest in a longer-term treasury. Just recently, the 10-year treasury yield has reached a record low ratio of only about 85% of the 2-year treasury yield. In other words, investors are being compensated less for taking more risk.
As the chart below shows, the rate of change (on a quarterly basis) in the 2-year Treasury yield has been parabolic.
Below is the rate of change (on a quarterly basis) in the 10-year treasury which is typically more stable than the rate of change seen in shorter-term treasuries. The chart shows that the 10-year treasury yields have also been moving up at an unprecedented quarterly rate of change.
Many analysts look to an inversion of the 10-year yield with the 3-month yield, which has not yet occurred. The failure of the 10-year yield to invert relative to the 3-month yield is likely due to the unprecedented rate of change in the 10-year yield, which has historically remained relatively stable. If the 10-year yield is moving up at a higher rate of change than the 3-month yield, this can delay or prevent an inversion altogether.
Check out my analysis from July for a more in-depth discussion on why the failure (or delay) of the 10-year yield to invert to the 3-month yield might be signaling that we've entered into a new supercycle, in which higher yields may continue for the long term:

SELL ZB1!A bonus trade for you, Currently I'm in a short trade on TREASURY BONDS, we got in after breking through the support we have in 125'02, now since we just added another contract and the price has already moved I said why not to share it with you to touch some profits.
I don't share trades at the same moment I get in it since I have customers I give signals to privately
SL and TP set them at your own risk

BUY ZBGood morning and good afternoon for european traders, as you can see on the Treasury Bonds chart the price broke the resistance and pulled back on it to give us a confirmation to buy it.
I don't use SL and TP, set yours at your own risk

Two Big Indicators to Watch This WeekTraders,
There are two cautionary indicators that I want you to be aware of and to watch closely this week. One of them has to do with U.S. treasuries which lead our dollar strength/weakness. The other has to do with the 200 week moving average on the Bitcoin chart. Let's dive in and take a look at these two very important lead indicators.
Stew

10-Year Treasury Yield Ready to Extend Advance to 2022 Highs?The 10-year Treasury yield has been rising since the end of January in the aftermath of a Bullish Morning Star candlestick pattern.
Now, prices are approaching the December high at 3.905 after confirming a breakout above a falling trendline from October.
Meanwhile, a bullish Golden Cross is set to form between the 20- and 50-day Simple Moving Averages, further offering an upside technical bias.
Confirming a breakout above the December high exposes the 78.6% Fibonacci retracement level at 4.118 towards the 2022 peak at 4.335.
US10Y

Buy ZBI'm sharing with you the other trade I'm getting in this morning on ZB, you can notice on the chart again that we have a breakout of the channel with a high volume candle followed by another high volumed one which is a confirmation on the trading system I follow.
Set SL and TP on your own
