long US30 treasuries hereUS30 treasuries are hitting a resistance line, 50 MMA and a high RSI and MACD. It seems like a good risk / reward to buy some treasuries here.
If the recession is starting it should put a downward pressure on inflation and treasury rates.
I will buy some TLT ETF and SPPX ETF.
Treasuries

Forget All Other ChartsIgnore all the other charts right now. They are based on DOLLARS. The dollar is permanently unstable and your imperialist overlords are here to take away your spending power. We're due to see bearish action similar to April 5th (pink dot). The question is, will we see a lower high in relative yields, or will we set a higher low and possibly become uninverted, and return above 1.0 once again? Consider that we just set a higher high in the S&P medium term and it could have simply been a move to fool the crowd. On the other hand, debt is at all time highs, and rates even at this level mean systemic insolvency. Raising rates further means quicker insolvency. I say just get it over with or don't do it at all. Inflation year over year is, realistically, 20-40%, each year since 2020. Key interest rates aren't even 10% of that. There is no way they will be able to control this in any way, shape or form, or manufacture a so called "soft landing".
Rates rise >1.0 = total collapse, then easing
Rates bounce <1.0 = unrealistic rally blow off top, more tightening to trigger the crash
I think I used too many arrows but hopefully it makes sense.
Good luck and don't forget to hedge your bets.

Dollar and treasury yields are back on the marchU.S. Treasury yields moved higher on Friday to their highest since July 21 and U.S. stock futures fell by almost 1%, along with similar losses in Europe. The yield on the benchmark 10-year Treasury note was up 8 basis points at 2.967% as the Fed indicated July meeting minutes that it would continue hiking rates until inflation slows down significantly, although the central bank could soon decrease its pace of tightening.
The 10-year Treasury yields above its 100-day exponential moving average, yields may extend its strength to 3.00% mark with the dollar's rally.

S&P vs UST YieldsYields are going crazy right now. Everything seems like a disaster. Oddly enough, when these particular yields invert (gray boxes), the 10/2, it is historically not the best time to go short, but rather you would have benefited if you had shorted AFTER yields uninverted above 1.0(red dots). Now, okay, maybe this time is different, a ratio of 0.87 isn't exactly sane at this point and maybe the whole thing comes crashing down. It's also true that about a third of this chart represented a fundamentally bullish and arguably much more healthy market, and this is true, we could have samples that don't exactly reflect current conditions. What I'm not so certain about is the idea that the market being bearish or bullish is somehow a barometer of what's going to happen next. At the end of the day, monetary policy rules market prices and perhaps this can be taken as sign that perhaps we don't *really* know what's going on behind the scenes, which strings are being pulled, and how hard. The market is not the economy. The FED has a trading desk at the NY Stock Exchange. Let us ask this question: if it is not absolutely necessary in their eyes to have such a trading desk, why would it exist? Could it be the case that it's simply there and yet they aren't using it? I think that is the less probable scenario.
Take it as you will. Considering the sharp cataclysm of yield inversion, I'm not sure this could constitute trading advice, but I thought it was interesting, as it could be considered bullish evidence for a "last rally" into a mammoth sized selloff.
What do you think? Still bearish? Bullish all the way? Even more confused now!? Have I gone completely crazy?? Let me know!
Thanks for taking a look, take care, and don't forget to hedge your bets.

US02Y/US10Y bonds signals end to market rally. Bear FlattenerUS02Y up ~6%
US10Y up ~0.12%
Definition of a Bear Flattener = market go down.
Is it a perfect indicator? Of course not. But the tendency is that bear flatteners mean money is coming out of the market and going into short term bonds where it can come out of the quickest if market turns around. So the short term bonds act as a kind of pump/dump for the market. We are getting bear flattener headwinds ahead of CPI print next week.
Next week maybe market flattens out, momentum dies, slow stochastic falls below 80, and price sets up to go below prior "higher lows".
Keep on alert.

Update on long duration bondsHello everybody! I wanted to make a quick update on where I think the 10y and 30y bonds will be headed in the next few months, as in the past, I've been talking quite a bit about deflation and a recession being close. We have seen TLT rise significantly, yet I think there is more upside. In the short term, I can see a further pullback, but in my honest opinion, the drop over the last two days was caused mainly by Pelosi visiting Taiwan and bonds getting overbought on lower timeframes.
The 30y yields were rejected at the monthly pivot, while the 10y yields bounced at support and were denied at resistance. Yields are still in a short-term bearish trend, and there is no confirmation of a reversal yet, although the trend might have changed. It all depends on the situation between China and the US, as the more the tensions between those countries increase, the higher inflation will be, and therefore the higher rates will be. If China starts aggressively selling US bonds, this could create chaos in the funding markets. If the US starts banning Chinese imports or exports, the US bond market could explode, and yields go to the moon. This would force the Fed to step in and do unlimited QE / yield curve control. Essentially we are stuck in a scenario of mutually assured destruction here, and there is no way either one will come out as a winner in the short term.
I believe that we are in a deflationary/disinflationary period, which could be disturbed at any moment if China invades Taiwan. The Russia/Ukraine war pushed inflation higher at a time when inflation was about to start slowing down, and a China/Taiwan war could push inflation higher at a time when inflation was about to slow down. TLT could quickly reach 125-135 in the next few months. However, I don't believe bond yields are going negative soon. It will be challenging for the market to have negative nominal yields when inflation is so high and at a time when the Fed might be forced to intervene and do YCC.

Monster Bear Flattener AheadHistorically - inflation has never been defeated except when a long term bond (in this case the 30 year) yield is above the rate of inflation. The collapse of supply has meant too much money chasing too few goods. This means more and more capital is sucked into a blackhole of wage-price spirals. Currently the US has trapped itself against a wall and a hard place in that the 30 year treasury yield is well below the inflation rate. A situation which hasn't happened to the US in 100+ years (I can't speak for the Civil War Era, I haven't found data back that far). You can see the 30 year yield history by searching Google for "Fred 30 year yield" (Can't post links yet).
The only logical path to achieve this is a bear steepening when people realize that inflation cannot come down otherwise and then begin a sell-off.
Yield curves will stay inverted since the FED has put a floor on interest rates which the treasuries are already starting to get close to.
"Restrictive rates" = = a bear flattening environment. We are currently in a "bull steepener" attempt which will fail.

The Real Cost of Fed Rate HikesCBOT_MINI:10Y1! CBOT_MINI:2YY1!
The Federal Open Market Committee (FOMC) is scheduled to meet on July 26-27. Market widely expects a 75-basis-points (bps) Fed Funds rate increase, from current target of 1.50%-1.75% to 2.25%-2.50%. The call for a 100-point hike, while still feasible, is weakened after U.S. gasoline price dropped 70 cents per gallon in the past month. New data hints that the runaway inflation may be contained.
Federal funds Rate is the interest rate that banks charge each other to borrow or lend excess reserves overnight. It is the most important global interest rate benchmark, as it directly or indirectly influences the borrowing cost for governments, corporations, and households. By the end of July, Fed Funds would have gone up by 2.25% (assuming 75 bps hike in July) from zero before March. The Fed is not afraid of raising rate even higher until inflation moves back to its 2% policy target.
How much will a higher interest rate cost for government, business, or household? I will illustrate the impact of 100bps rate increase in this analysis. All data comes from either the Fed or USdebtclock.org, unless otherwise noted.
Total Debt : By the end of Q1 2022, the total debt outstanding in the U.S. by both public and private sectors is $90.1 trillion. Mind-boggling. What does the number mean?
• U.S. GDP was $23.0 trillion in 2021. Debt-to-GDP ratio is 3.92. It would take all Americans four years to pay off their debt, without spending or paying interest.
• US population is 332,403,650 as of January 2022 per US Census Bureau. Debt per capita is $270,949. Each time a baby is born, he or she already owes more than a quarter million dollar.
US National Debt : $30.6 trillion based on USdebtclock.org real-time calculation. This is just the debt owed by Federal government and various federal agencies.
• National Debt to GDP ratio: 133%.
• Federal tax revenue is estimated at $4.4 trillion in 2022. If our government just levies taxes and does nothing else, it will take seven years to pay off the debt.
• Federal budget is $6.0 trillion in 2022, with budget deficit running at $1.6 trillion. Interest on debt is $440 billion, the fourth largest budget item. If interest rate goes up 100 bps across the yield curve, federal government will have to come up with $306 billion extra to service the debt.
• Federal budget in 2022: $6.0 trillion
o budget deficit $1.6 trillion
o Interest on debt $440 billion (4th largest budget item)
o Remark: $306 billion extra to service the debt, if interest rate goes up by 100bps
• When all the rate hikes are over, annual debt interest payment could be over $1.0 trillion. It would become the 3rd largest budget item, behind Medicare ($1.4 trillion), Social Security ($1.0 trillion) and ahead of Defense ($751 billion)!
State and Local Government debt : $3.3 trillion, of which $2.1 trillion from state governments and $1.2 trillion from local governments.
• If interest rate goes up by 100 bps, state and local governments will have to come up with $33 billion extra to service their debt.
• We may expect tax hikes from state and local governments, while public services may be cut back at the same time.
US Corporate Debt : $11 trillion, which includes all debt issued by non-financial corporations domiciled in the U.S.
• If interest rate goes up by 100 bps, American businesses will have to come up with $110 billion extra to service their debt.
• We may expect higher prices for goods and services, as businesses pass on the interest cost to consumers.
• Companies with high debt ratio may increase the chance of delinquency.
US Household Debt : $23.5 trillion. This includes mortgage, auto loan, credit card loan and student loan, etc.
• Personal debt per citizen is $70,304. If interest rate goes up by 100 bps, each person will have to come up with $703 extra a year to service their debt.
• American families are fighting with a higher cost-of-living on multiple fronts. If the U.S. falls into a recession, their financial situation will worsen significantly.
• Mortgage delinquency is expected to rise significantly.
The remainder, approximately $21 trillion, is outstanding balance of credit instruments issued by banks and other financial institutions.
Believe it or not, we have only just scrubbed the surface of our mounting debt problem. Most government liabilities are unfunded or underfunded. Each year, the Federal Government borrows new money to pay off the maturing debt.
Medicare, Medicaid, and Social Security are pay-as-you-go programs. Government taxes current workers to pay for the benefits of retirees, without any money saving up for current workers. No one has a crystal ball if the benefits are still there when they reach retirement.
With such a depressing future ahead of us, are there any trading opportunities? The answer is yes. I am counting on the inverted yield curve to return to historical normal.
Yield curve plots the interest rates on government bonds with different maturity dates, notably three-month Treasury Bills, two-year and 10-year Treasury Notes, 15-year and 30-year Treasury Bonds. Bond investors expect to be paid more for locking up their money for a long stretch, so interest rates on long-term debt are higher than those on short-term. Plotted out on a chart, the various yields for bonds create an upward sloping line.
Sometimes short-term rates rise above long-term ones. That negative relationship is called yield curve inversion. An inversion has preceded every U.S. recession for the past half century, so it’s seen as a leading indicator of economic downturn.
On July 21st, the yield on two-year Treasury notes stood at 3.00 percent, above the 2.91 percent yield on 10-year notes. By comparison, two-year yields were one percentage point lower than the 10-year yields a year ago.
Why are we seeing yield curve inversion now? Short-term yield directly responded to Fed rate hikes. It has gone up 225 bps in five months. Longer term yields are determined by credit market supply and demand. The prospect of an upcoming recession held off lending by businesses and households alike, keeping the yields relatively stable.
In my opinion, yield curve inversion could not sustain for long. Borrowers would flock to lower rate debt, pushing up demand for longer term credit. Market force would revert the yield curve to a normal one with interest rates on long-term debts higher than those on short-term ones.
Are there any instruments we could leverage to trade the reversal of yield curve inversion? Long the Spread of CBOT Micro 10-Year Yield (10Y) and 2-Year Yield (2YY) .
Traditional Treasury Futures are quoted in Treasury Notes price, which can be viewed as the present value of future payments that bondholder will receive – interest payment every six months and the return of principal at par value at maturity.
Micro Yield Futures are more intuitive. They are quoted in yield directly. On July 22nd, August 10Y Yield Futures (10YQ2) was settled at 2.819. August 2Y Yield Futures (2YYQ2) was settled at 3.06. The 10Y-2Y spread is -0.241.
The 10Y-2Y spread has been positive in recent years. It turned negative in the beginning of July as we experienced the inverted yield curve. I expect the spread to return to historic normal - a positive number, in the coming months.
To trade Micro Yield futures, margins are $240 for 10Y and $330 for 2YY. A long spread can be constructed by a Long 10Y and a Short 2YY positions.
The great thing about a spread trade lies with the fact that you don’t have to be right in predicting the direction of interest rates. Spread will be widened if 10Y rises faster than 2YY. Even in a falling rate environment, if 10Y fell less than 2YY, the spread will be enlarged too.
Happy Trading.
Disclaimers
*Trade ideas cited above are for illustration only, as an integral part of a case study to demonstrate the fundamental concepts in risk management under the market scenarios being discussed. They shall not be construed as investment recommendations or advice. Nor are they used to promote any specific products, or services.

DXY: BULLISH ASCENDING 🔺BIAS: BULLISH
TECHNICAL PROJECTION:
On the Daily, we have a bullish bias that price will carry its bullish momentum to 107 then 112 target.
FUNDAMENTAL PROJECTION:
Market could be pricing further 75bps hike tightening to come & balance sheet reduction to continue at $60b & $35mbs over the three month timeframe.

Time to buy short-term treasuries?A recession is incoming, the yield curve has turned negative and the euro is collapsing.
Three good arguments for buying short-term treasury notes.
And you still get 2,8 % return for a very safe investment.
I think it is a strong buy.

Uranium the anti-COVIDThanks for viewing.
No, not as a treatment - please don't inject uranium as a treatment (if Uranium came in a bottle it would need a warning for Americans).
Competition? What I mean is that Uranium has been on a run starting from when the equity markets showed weakness - and has yet to show signs of slowing. I'm not sure what the relationship is yet, as crude, coal, and natural gas are down in 2020, which would make them more competitive as energy sources.
Energy Security? It could be that crude, coal, natural gas, wind turbines, and solar panels all have rather long, and as we have seen, potentially vulnerable supply chains. Maybe, it is about energy security. Uranium needs for the US aren't all mined at home so that wouldn't account for it - although adding supply from long-standing allies like Australia could probably supply the needs of North America while having security of supply.
Is it about the environment? That could be part of the picture - as long as everything is well managed. There is that "catastrophic and uninsurable" hazard if things go wrong. The energy itself is clean, although the capital expenditure is considerable. Finding a long-term storage place for the waste hasn't been solved yet in the US.
Hard assets? Expectations of future inflation in light of historic levels of quantitative easing and currency printing are possibly driving the search for hard assets with use-value. As I look around the markets, very little appears undervalued. Equities, bonds, treasuries, gold all appear to be, if not over-valued, then not cheap. The most popular store of value in the world, and the destination of huge amounts of funds: treasuries don't even seem to be worth a second look at the moment and any up-tick in interest would wipe out a significant portion of those positions.
Expectations of an up-tick in military demand? I certainly hope not.
End of the bear? Maybe it has been long enough after Fukushima that people see an undervalued commodity. There has been a significant rise in plans for new nuclear power plants.
Anyone have any plausible fundamental analysis to add?

10-Year Treasury Yield Trendline Breakout Faces Next TestThe 10-year Treasury yield confirmed a breakout under a near-term rising trendline from March, opening the door to reversing the uptrend since then.
Rising concerns about a recession in the United States, also amid a general slowdown in global growth expectations, are pressuring bond yields lower.
Ahead, the 10-year rate is facing the May low at 2.705 where the 100-day Simple Moving Average is fast approaching. The latter could still reinstate the dominant upside focus.
Otherwise, more pain may be in store. Below is the 61.8% Fibonacci extension at 2.3667. Resuming the uptrend entails a push back above the current 2022 high at 3.497.
TVC:US10Y

How long could deflation last? What about bonds?As most commodities are currently collapsing, it is very hard to keep believe that inflation is going to go higher from here. June could be the first month with a negative MoM CPI print, but it probably won't be the last. As deflation is taking inflation's seat, bonds have been looking attractive for some time. Essentially we got a blow of top in yields (capitulation bottom in bonds), and now bonds are rallying. It's totally normal as bonds took out the lows, and are now showing major strength at a time where the dollar is strong, while commodities, stocks and real estate looking weak.
The truth is that there is no escape from a major global recession. Commodities could fall a lot more until Central banks reverse course. There is too much debt and the only way to get out is by printing, while all the rate hikes will only eventually result in a crash. It's just that rate hikes have a delayed effect and most investors haven't realized what is coming yet.
Is the inflation story over? I don't think so. We are just in a very a nasty recession, that could lead to a deflationary collapse. Essentially a liquidity crunch that would cause investors to capitulate, and then force the Fed to step in to save the system. There is no way the Fed will hike rates more than 0.5-1% from here, and there is no way the Fed won't be forced to cut rates and resume QE by June 2023. The bond market reversing like this is an indication that the Fed is about to make a mistake by raising rates once or twice in the next few months, as bond yields are already coming down.
It's interesting that bond yields rose more than in 2018 before they reversed and fell below the Fed Funds Rate (FFR), yet FFR is currently 0.75% lower than when the Fed paused in 2018. Could easily see FFR getting down to 0 in the next 12-24 months as the financial system faces collapse yet again, but I don't see bond yields going as low as they did during Covid.
What I see is long duration bonds going up to the key breakdown zone, around 130-135 on TLT or bond yields going up to 2.4-2.6% before moving higher again. Essentially I do see a major deflationary episode ahead, I do believe bonds can go up, I don't believe the Fed will ahead of the problem and that there isn't much they can do. However at the same time I don't believe that the inflation story is over, as I do see higher inflation coming once we are done with this episode. Why? Because a lot of production of stuff will go offline, while governments print a ton of money to save the system. Less goods, more money... No way inflation won't happen again. The debt bubble is popping and long term this is inflationary.
So far we've seen bonds divergence from their long term trends, first with a blow off top, and then with a rapid decline that swept the lows. Could we get back into the main trend? It's possible, but I don't think so. All I see is a similar retest to what we go in 2021, where bonds broke down and then retested the breakdown level before going lower. TLT will fill the gap and then decide where it wants to go. Definitely wouldn't be surprised if bonds chopped in a certain area for a while, but ultimately I think we are going lower. Of course we could go lower even during a deflationary period, as everyone is liquidating whatever they can. If people need dollars, they will sell anything for them, including dollars. At the moment bonds are still very attractive, yet this doesn't mean that if people need cash they will hesitate to sell them.

Bonds Rip!!Bonds have soared, blasting through resistance at 118'04 and crossing the vacuum zone to 119'01. We anticipated resistance at 118'04, but momentum came through and we have broken through 119'01, meeting resistance just above this level confirmed by a red triangle on the KRI. The Kovach OBV has picked up, and should momentum continue, we should be able to hit 119'23, the next level. If we retrace, watch the vacuum zone below to 118'04.

US Inflation is Nearing a Harmonic PeakIf we are to base our views of this chart like we would any other price chart, the harmonics we see forming here would imply that US Inflation is reaching a peak and that we will see Inflation come down signfiicantly over the the coming years. If i were to give a target i'd say we'd wanna see it come down to atlest 3% as a first target but it could go down even more depending on how tight things get.
The smaller harmonic is a Bearish Butterfly with a reversal zone between the 1.272 and 1.618 and the bigger one if we get that high is a Bearish Shark. Ideally we'd like to see the Butterfly playout and us not to have to go as high as the Shark.

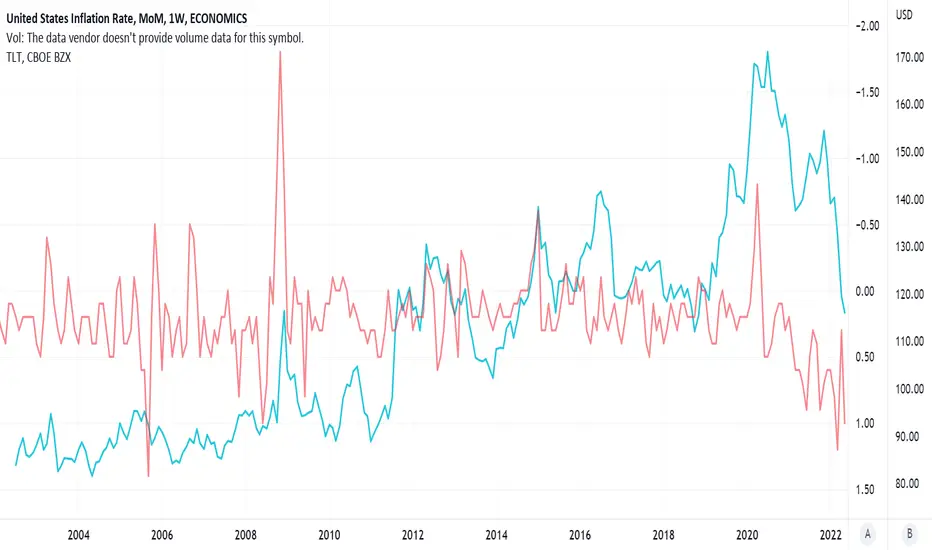
Inverted TLT compared to month-over-month inflation rate in U.S.Pretty clear that TLT trades opposite inflation.
The governments and central banks of the world are all trying to kill inflation.
Yields are pulling back but the move is likely corrective.US 10Y yields are pulling back after testing twice the 3.5% area but the move to the D/S is unfolding in a corrective manner for now (descending channel). 3% is the closest support area (also a psychological level) but a move towards 2.8% before resuming the upside is likely. We know it seems far but 4% is a level we expect the market to eventually hit while remaining in this bull run.

Bonds Edge HigherBonds have continued their rally, with ZN piercing through the 117's to hit our target at 118'04. A brief retracement has taken us back to 117'19, which was a previous target. The Kovach OBV has steadily risen, but has since leveled off a bit, which could suggest we are due for a retracement or some ranging. We should have support at 116'20 if we retrace further. If we are able to breakout, then there is a vacuum zone to 119'01, which is our next target.

5 Years of the Yield Curve
2018 - Flattening curve throughout the year with some slight inversion towards the end.
2019 - Complete inversion early in the year lasting awhile. Entire curve beginning to fall.
2020 - COVID Fed response slams the short end to the ground with the longer end having a pretty muted reaction.
2021 - Curve starts to stretch with short rates being extremely low and long rates showing pretty strong upside.
2021 - So far, the short rates have become unhooked from the 0 line and launched towards long rates. The curve has inverted again and there are no signs of slowing on the short end.

When this trendline breaks, Japan may hyperinflateJapan's central bank is buying unlimited amounts of Japanese debt in order to maintain yields around 0.25%. This ratio shows yields over the central bank's balance sheet. When this trendline breaks to the upside, it essentially means that Japanese debt is being sold faster than the central bank can buy. Japan may be going through some serious financial events very soon.
www.cnbc.com
The bank of Japan is selling US treasuries in order to buy more Japanese treasuries. This may cascade into US problem of rising interest rates and unsustainable debt levels being that Japan is the largest foreign holder.
www.bloomberg.com

Dead Cat Bounce for Bonds?Bonds have pressed higher following the Fed's 75bps rate hike. We have broken out of 115'29 back into the 116 handle, topping out at our level at 116'20. A red triangle on the KRI suggests that we are facing resistance here. We do appear to be seeing a bull wedge consolidation pattern, but the Kovach OBV has leveled off, so it is likely we will fall from here. Watch 115'29 or 115'03 for support. If we are able to break out further, the next target is 117'08.

US 10Y Treasuries Short Term BearishCurrently watching the 10Y Treasury Yield to hit resistance and pull back.
3% should be a big resistance level for now.
Short term Fibonacci target of ~2.6%.
This will be bullish for equities.
The recent pivot low broke structure to the left, where the low in late April was broken.
This is now a bearish retracement towards the highs, and will be watching for fib levels or a double top as resistance.
The bigger picture monthly chart (below) shows a big supply zone resistance at 3%. This area of supply has been hit, and a further reaction to the downside expected.
Also, the yield is stretched away from the monthly 21ema, with the 21ema currently below the 200sma.
The stochastic momentum index (SMI) is also on overbought zone with bearish divergence.

USDX Daily TA Cautiously BullishUSDX Daily cautiously bullish. *Equities are down, cryptos are down, commodities are down (yes Gold included), real estate/housing market down, inflation up and the US dollar (as well as Russian ruble)... up. The Fed is expected to announce anywhere from a 50bp-100bp rate hike this Wednesday if they want to be in line with their promise to go "beyond neutral" to ring in still growing inflation; 50bp would likely assuage markets in the short term and stall the dollar, whereas 75bp+ would likely send markets lower and keep pushing up the dollar.* Recommended ratio: 90% USDX, 10% cash. Price is currently in Discovery as it is currently printing a new ATH at $105.05 amidst a big push back into treasuries (10y/30y). Volume remains Moderate (high) and is currently on track to favor buyers for a fourth consecutive session if it can close in the green in today's session. Parabolic SAR flips bearish at $101.36, this margin is mildly bearish. RSI is currently breaking above 63.78 and is trending up at 68.60 as it fast approaches overbought territory. Stochastic remains bullish and is currently on the verge of testing max top (where it can potentially coast in the bullish "autobahn zone" for a while). MACD remains bullish for a second consecutive session and is currently trending up at 0.39, the next resistance is at 0.46; if it blows past 0.46, it will likely test the uptrend line from August 2020 at around 0.80 resistance. ADX is currently trending up at 23 as Price continues to rise, this is mildly bullish and becomes very bullish if it can maintain this same correlation above 25. If Price is able to continue in its Discovery, the next psychological level to watch for is $110. However, if Price retreats from here then it will likely test $103.77 support. Mental Stop Loss: (two consecutive closes below) $103.77.
