Bonds SlumpBonds have sold off into the mid 118's after smashing through 119'01. We have gradually drifted up from there, but are meeting resistance at 119'01. It will take some momentum to break through this level and right now it does not seem that ZN can muster the strength. The Kovach OBV has edged upward, but appears quite weak. If ZN is able to somehow break out, then 119'23 is the next target. If we sell off further, then 118'04 is the next target below.
Treasuries

Bonds Test Higher LevelsBonds have edged up higher, with ZN hitting our target of 121'00. This is a strong psychological and technical level. We are seeing a bit of a divergence between the price action and the Kovach OBV so unless more momentum comes thorugh, anticipate a dip or some ranging between 120'14 and 121'00. If we dip further, 119'23 should provide support. If we are able to break out further, then we have a fairly wide vacuum zone to the next level and target at 121'28.

US10Y Will Go Down! Sell!
Hello,Traders!
US10Y has retested a strong horizontal resistance
And we are already seeing a bearish reaction
So I think that the move down will continue
With the target being the broken falling resistance
That has turned into a support level
Sell!
Like, comment and subscribe to boost your trading!
See other ideas below too!

Bonds Pick UpBonds have found support and made a run for higher levels. The ten year dipped 119'23 into the 118's, finding support just above our level at 118'04. We then saw a rebound to 120'14, which we have been identifying as the next target after 119'23. It will take some momentum to break this level however, since this is a relative high from back in April. We are already seeing steep resistance here confirmed by a red triangle on the KRI. The Kovach OBV is gradually trending up, but is a oscillating with the dips, suggesting we need to see more momentum to come through to sustain the rally. If we selloff further, then we should see support at 119'01 then 118'04.

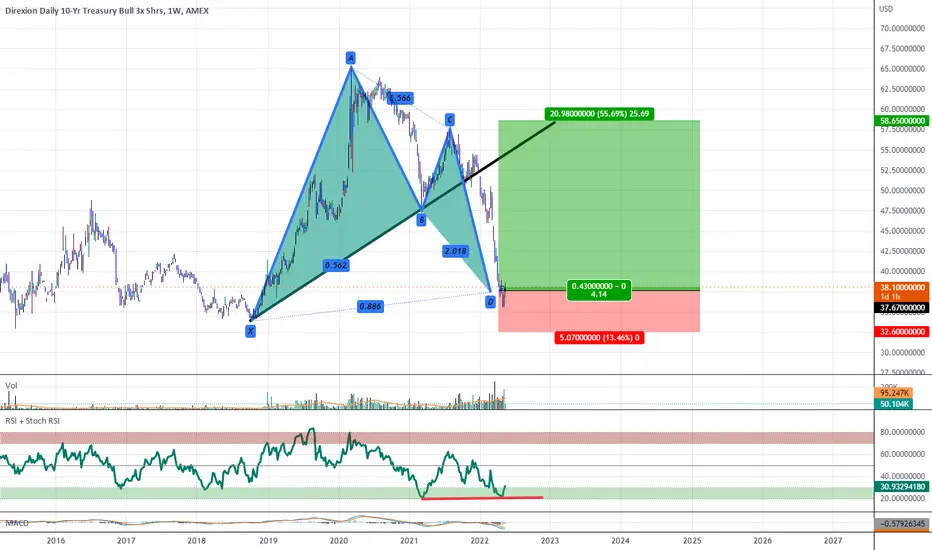
US10 YR Treasury ETF: Bullish Divergence at PCZ of Bullish BatThere is RSI Bullish Divergence at the PCZ of a Bullish Bat that's Visible on the Weekly Timeframe. This may also signal the beginning of a moderate pullback within the DXY as initially, I expect the DXY to show a Negative Correlation with Rising US BOND prices.
Bonds Benefit from Risk-On OutflowsBonds have picked up, breaking through several of our upside levels. We set a target of 119'23, and that is exactly the level we've reached. We are seeing signs of resistance here from several red triangles on the KRI. The Kovach OBV has picked up however, but it is doubtful momentum will take us much further, given the market conditions. If we are able to break out again, then we should see resistance at 120'14 and 121'00, who relative highs. From below we will have support from 119'01 and 118'04.

Japanese yen hits 20-year lowThe Japanese yen is slightly lower at the start of the week. In the Asian session, the yen fell as low as 131.35, which marked a 20-year low.
The speed of the Japanese yen's depreciation has been remarkable, falling 12% against the US dollar in just three months. The formula for the yen's slide has been relatively simple - US Treasuries have been moving higher, while the BoJ has fiercely defended its yield control curve, capping the 10-year yield at 0.25%. Since the yen is extremely sensitive to the US/Japan rate differential, the dollar has pummelled the yen.
Moving forward, the BoJ isn't about to change its stance and allow JGB yields to increase. The central bank is committed to an ultra-loose monetary policy and has been using debt financing, with the government's debt currently at a staggering 250% above GDP. This means it becomes a huge expense for the government if JGB yields move upwards. US Treasury yields continue to move higher, with the 10-year yield inching higher on Monday to 3.13%. The risk on USD/JPY remains tilted upwards, but the question is whether the BoJ will continue to sit on the sidelines and allow the yen to sink.
Does the BoJ have a 'line in the sand' when it comes to the exchange rate? There had been talk of the 130-level triggering intervention, but that hasn't happened, as the BoJ and Japan's Ministry of Finance (MoF) have limited themselves to jawboning that they are monitoring the situation and are deeply worried about the yen's rapid descent. According to a BoFA note on Monday, 140 is a key line that could trigger yen intervention. The 140-level has held since 1998, and if breached, the MoF could respond and buy yen in order to stabilize the currency. In the meantime, the yen will likely continue to lose ground, with the Federal Reserve expected to continue to tighten at an aggressive pace.
USD/JPY faces resistance at 1.3136 and 1.3218
Ther is support at 1.3000 and 1.2918

The Bond Selloff ResumesAs anticipated the bond rout continues. We saw a brief relief rally after the FOMC, as the hikes were largely priced in. However, 119'01 provided prohibitive resistance, and ZN immediately rejected it. We found brief support at 118'04, but have broken through this level, and are currently clinging onto 118'00 by a thread. The next target is the level below at 117'19. The Kovach OBV is extremely oversold, so watch for a relief rally, which could test 119'01 again.

Opportunity to buy US Treasuries and a failing fiat system?The 2/10 treasury yield spread is approaching an inversion.
All of the previous yield curve inversions were associated with catastrophic event many of which stemming out of a fiat monetary system that seems very obviously to be failing.
We are seeing the failing fiat monetary system if we look at the amount of money being created out of thin air by the FED (and ECB, Bank of England, Bank of Japan).
The FED is expected to raise interest rates at its May 3-4, 2022 meeting.
More rate hikes are expected to follow, with the goal of reducing inflation.
The markets anticipate that the federal funds rate will exceed 3% by early 2023.
The dollar is showing great strength across other leading currencies.
If you invest in treasury you can get a fair interest rate of 3% (and assuming with more rate hikes even more), as US treasuries bond are available at a great rebate.
Do consider the currency devaluation possible if your base living currency is not the USD.

All Treasury Yields - Convergence at highs = lows comingPut together a chart to illustrate what happens when government treasury yields converge at the same amount at a market peak.
They consistently roll over and tank.
When yields tank, bonds go up in value.
Looks like a good spot to pick up some TLT.

Don't Misunderstand YieldsChart to illustrate the inverse relationship between government yields and government treasury/bond funds.
Yields go up, treasuries/bonds go down. Yields come down, treasuries and bonds go up.
This is going to matter a lot very soon.

US02Y-US10Y 🎯Wells Fargo Chart of the Week 🎯💰🤔Hey Fam. 😊🙏Just wanted to share this information with you all.. I found it very interesting.. This was a chart of week that Wells Fargo shared on there site. I thought it was interesting how they saw a 4 week inversion roughly 43 weeks on average in regards to our last seven Recessions before they happened (Shaded Areas on chart) Before a US recession officially started.. which is roughly about 10 months..🎯💰🤔👌🙏😊

The Bond Rout ContinuesBonds have leveled out after a brief relief rally tested 120'14. We saw prohibitive resistance confirmed by two red triangles on the KRI, then immediately fell back down to 119'01, where we are seeing support. The Kovach OBV picked up slightly with the rally, but fell back down to bearish territory with the rejection. If current levels don't hold, we are sure to bottom out again at 118'04.

NZ dollar drops to 22 month-lowThe misery continues for the New Zealand dollar, which is down almost 1% on Thursday. NZD/USD has fallen below the 0.65 level and has plunged 6.54% in the month of April.
ANZ Business Confidence was unchanged in April, with a reading of -42.0. That means close to half of New Zealand businesses are pessimistic about the economic outlook over the next 12 months. The problems identified by businesses are nothing new, with shortages in materials and workers and inflation driving up costs. New Zealand inflation hit 6.9% in Q1, a 30-year high. In addition to the surge in inflation, businesses expect inflation to continue to rise - in April, inflation expectations rose to 5.9%, up from 5.5% in March.
The upside risk in inflation expectations is a paramount concern for the RBNZ, which faces a massive battle in wrestling inflation to lower levels. Today's weak Business Confidence report will exacerbate those worries and will support aggressive rate tightening from the RBNZ in order to get a handle on spiralling inflation. A back-to-back hike of 0.50% at the May meeting is a strong possibility.
Even with the RBNZ in aggressive mode, the US dollar continues to pummel its New Zealand counterpart. The Federal Reserve is poised to deliver another half-point hike at next week's meeting and has hinted at more oversize rate hikes in order to curb high inflation. US Treasury yields are moving higher, which is supporting the US dollar rally. Yields rose on Thursday, even though US GDP surprised with a contraction in Q1, the first negative growth recorded since the pandemic recession in 2020.
NZD/USD has broken below the 0.6504 line. Next, there is support at 0.6381
There is resistance at 0.6569 and 0.6692

How Joe Rekt the EconomyOverview of the yield curve indications on potential liquidity crisis occurring in the near future and leading to downturn in equities.

10 year treasury yieldspotential double top around 3.23% on 10 year treasury rate, coincides with resistance of multi decade down trend (yellow). on a logarithmic price chart.. or do we break out of a multi decade trend and see rates go higher? even if we did break out, could the Fed respond with YCC to stop long end rates going up, which could break the financial system..? thoughts and comments welcome.

The Bond Rout ContinuesAs anticipated, bonds faced steep resitance from 121'00 and sharply retraced. We have fallen back to 119'23, one level above lows at 119'01. The Kovach OBV ticked up slightly with the rally, but has fallen sharply at the moment. At this point it is clear that any rally is purely technical and the bear rout is still at play.

Hard for stocks to rally with US Dollar & 10-Yields at 52W HighsAfter taking just 1 day off the US Dollar and 10-YR Treasury Yields are back to pushing 52W highs.
Need to see these two back off for any type of convincing equity market rally to take place.

The #1 Chart to WatchLadies and Gentlemen, please take your seats.
(...the music stops)
Okay, thanks for playing. Good luck to all of you!
The investment strategies that have worked for the last 40 years will no longer work. The true bear market is here. This will absolutely 100% NOT be a recession that will be forgotten easily.
It most likely will be a depression via stagflation which we have never really experienced long-term.
Our leaders won't admit it but *News Flash* the Supply Chains are NOT getting fixed like they were before. China has no incentive or interest to fix them and we are the world's biggest debtor. We got 20% of all our imports from them in 2021. That doesn't sound like a lot but that 20% is involved in the supply chains of 70-80% of our goods. The Chinese gov has already warned its people of the incoming food shortage and have been far more honest with their people than our Western leaders have been.
Good luck in the New World Order!
Courtesy of the World Gov. Summit 2022, the IMF, World Bank, etc.
(Not Financial Advice, Just what I see.)

Bonds Sell Off on Hawkish Fed MinutesBonds are back to hugging lows, after a brief attempt at higher levels. We found immediate resistance one level above at 121'00. Even the rally to that level encountered serious resistance at every step, confirmed by red triangles on the KRI. We are back to lows again at 120'14. The Kovach OBV is very bearish so we can expect an imminent breakdown to lower levels. Our next target is 119'23, which is significant as we will have given up the 120's all together.

Will the Bond Market Continue to Sell Off??Bonds have reached a relative high at 123'01 to the tick then promptly rejected this level. A red triangle on the KRI confirmed resistance and we headed straight back down to through the 122 handle to finally find support at 121'28. We are currently seeing some support here, confirmed by a green triangle on the KRI. However the Kovach OBV has taken a steep dive south suggesting the bear rout is about to pick up again. If so, the next target is 121'00, then 120'14. If we are wrong, we must break through 123'01 before we can consider higher levels.

IEF Long IdeaIEF (7-10 Year Treasury Bond ETF ) is hitting a monthly uptrend line which is very likely to cause a short term bounce. On almost all time frames, IEF looks oversold. We are long EIF. - HH

Long-Term Regression Trend Breakout on US 10Y TreasuriesLong-term regression trend on 10yr treasuries just broke above +2 StDev at 2.2%.
Assumption: Fed raises rates to eventually bring them back down in a year or two.
