Long-Term Regression Trend Breakout on US 10Y TreasuriesLong-term regression trend on 10yr treasuries just broke above +2 StDev at 2.2%.
Assumption: Fed raises rates to eventually bring them back down in a year or two.
Treasurybonds

$US10Y Breaking Out OF 40 Year TrendHistorically, in the absence of QE (Quantitative Easing), the US10Y (US 10 Year Treasury Bon) exceeds inflation. This means that bond yields must rise to exceed inflation for non-Federal Reserve buyers to enter the market place. Non-Government buyers will not buy a bond below inflation as their real returns would be negative.
A SIGNIFICANT CONCERNS/CONSIDERATIONS:
How The Fed May Reduce The Balance Sheet:
- If they flood the market, we could see a squeeze on the bond market as the FED represented 2/3 of the bond market prior to ending their aggressive purchasing of bonds last week.
How The New "Standing Repo Facility (S.R.F)" Will Effect The Bond Market:
- Unclear, as it is untested in this Quantitative Tightening (QT) climate.
- The premise is that the S.R.F is a tool that FED now has to avoid what happened in 2019. The goal is to help prevent a spike in bond yields.
Explanation from Federal reserve website:
www.federalreserve.gov
"When the Federal Reserve conducts an overnight repo, it buys a security from an eligible counterparty and simultaneously agrees to sell the security back the next day. The difference between the purchase price and the sale price of the securities implies a rate of interest earned by the Federal Reserve on the transaction. The FOMC sets the S.R.F minimum bid rate, which is the minimum interest rate the Federal Reserve is willing to receive in an S.R.F operation; if the amount of bids exceeds the operation limit, the actual interest rate that a counterparty pays is determined through an auction process. The securities accepted in S.R.F operations include Treasury securities, agency debt securities, and agency mortgage backed securities."

Inflation, bond yields, the dollar and the Fed! Macro series pt1Part 1 Hello everyone! It's been a few weeks since my last update on the markets, and this one is going to be a very special one. Will go through many different aspects of most major markets, by using both technical and fundamental analysis. It will be an in-depth analysis with lots of charts of several instruments, that have the potential to give us a clear picture of where we are and what is going right now in the global landscape. Because there are so many things I'd like to mention, I've broken the analysis down in different parts, all of which you will be able to find on the links down below.
The first and most important pieces of the puzzle are the US Dollar and interest rates, as together they are one of the largest components in essentially every market as they partially determine the liquidity and demand, by ‘setting a price for money’. In 2020 many forecasters predicted that the value of the dollar would collapse and said it was dead as it had lost 10-15% of its value relative to other fiat currencies. Yet they were very wrong in 2021 as the dollar bottomed and started rising along with interest rates, despite inflation skyrocketing in the latter part of the year. At the same time many claimed that the bond market would collapse, yet even though long term US bond yields had been rising from Aug 2020 up until Mar 2021, just to barely get to pre-pandemic levels where bond yields were already really low. Then went sideways until the end of 2021, where they started rising again. During that time short term US bond yields were close to 0 and only started rising at the end of Sep 2021 as inflation started climbing fast and the market started anticipating the Fed raising rates. Therefore, as those yields were rising due to inflation going up, so did the USD which might seem counterintuitive. Why would it go up if it’s losing purchasing power?
Well fiat currencies are trading against other fiat currencies and the world is heavily interconnected, so it’s a relative game and inflation wasn’t just US phenomenon. However most importantly it was clear that inflation didn’t come due to the Fed doing QE or lowering rates, but due to several other factors. To name a few 1. Government spending, 2. Credit creation during Covid, 3. Deferred loan/rent payments, 4. Wealth effect due to stocks/housing going up, 5. Supply chain issues, 6. Supply shortages due to labor shortages or businesses closing, 7. Pend up demand, 8. Higher demand for goods than services, as well as demand of new types of goods, and finally and most importantly 9. Issues in the energy sector and particularly due to the fact that many oil and natural gas wells got shut and weren’t reopened. Now you might be thinking ‘wait a second, where does QE fit into all of this?’. Unlike what most people believe about QE or low interest rates, the Fed doesn’t print money. It simply creates reserves which the banks can’t use to buy anything and low interest rates are a sign that the economy is in trouble as banks aren’t willing to lend to anyone other than big institutions. QE isn’t inflationary as it is just an asset swap and the Fed doesn’t determine anything aside from short-term rates. So, what does the Fed actually do? Essentially, they are trying to push banks to lend, yet banks refuse to do so, and in turn the Fed tries to manage expectations. It all boils down to the Fed making people believe they know what they are doing and that they are a powerful institution that can either create or fight inflation. Therefore, in the list of factors there is another one (no. 10) which is that the Fed convinced everyone that they flooded the world with cash and that affected the spending/investing habits of the people that believed them. Yet there was a market that hasn’t really believed them, and that is the bond market.
The bond market keeps indicating that we are stuck in a low growth environment where inflation isn’t a long-term issue, just a short term one. It is also telling us that there is too much debt and too many problems, many of which policy makers haven’t been able to solve. Not only that, but many of the policies have been making things worse and worse, and that in 2022 it looks like inflation is probably going to slow down. Hence if markets and the data are telling us inflation isn’t going to be a major issue in 2022 and the sources of inflation are elsewhere, why will the Fed raise rates? Can it raise rates? By how much? What impact will that have on the economy?
For the first question there are some pretty clear explanations. One of them is that Fed wants to raise rates is so that people keep believing in that they can control inflation and that they aren’t just there to pump the stock market. Many believe in the Fed put, which is the belief that the Fed doesn’t want to do anything to upset the markets and that if things go bad the Fed will support the stock market because it can. However, another one is that there are also many people who are upset about inflation and want someone to do something. These people demand the Fed to act, as the Fed itself claims to have the tools to fight inflation and that it created the inflation in the first place. Hence at the moment the Fed is stuck between a rock and a hard place, as markets are at ATHs, housing at ATHs, the economy is slowing down and overall is in a pretty bad place, while for most people the costs of living are up by 10-20% compared to 2 years ago. By the Fed’s own mandates and admissions, inflation above 2% is high (CPI was at 7% YoY) and their reasoning for QE + low rates has been their goal of full employment… and as we’ve reached a point where unemployment is very low and there are even labor shortages as many people haven’t gotten back to the labor force since the pandemic begun. This in turn puts pressure on wages and inflation, hence the Fed has to act based on its own ‘goals’. Yet if they act, and especially if they act quickly, the markets could crash and this could have even more implications on the economy. It is pretty clear that they have to walk a fine line, except it’s also pretty much impossible for their actions not to affect the markets which are overleveraged and are showing signs of weakness. On the one hand they need the markets to come down a bit, in order to slow down the wealth effect which affects inflation, as well as prevent excess speculation from going even further… and on the other hand they must not overdo it because the whole system could grind to a halt.
Keeping all of the above in mind, it seems pretty hard for the Fed to significantly raise rates. Yesterday when Powell started answering questions, he was pretty hawkish because people aren’t taking the Fed seriously, but there is a long way between them talking about being serious and them actually doing it. Doing both QT and raising rates more than 3 times this year, something that the market seems to be expecting at the moment seems a bit farfetched. Like Alex Gurevich said on his recent appearance on ‘The Market Huddle’ podcast (and I am paraphrasing a bit), the most likely scenario for the Fed is to raise rates once. In his view they could do one and not hike again for a decade. Maybe they get two or more, but 1 is more likely than 2, and 2 are more likely than 3… and so on. He also mentioned that he thinks we in the late stages of this cycle, and I happen to agree with both views. My reasoning is that the inflationary factors mentioned earlier seem to be weakening substantially and slowly giving their place to the disinflationary/deflationary factors like supply chains issues being slowly resolved, less government spending, debt accumulated during the pandemic having to be repaid and so on. Inflation in 2021 was really high, though towards the end of the year several data points started showing that it was slowing down and in 2022 we could have 2-3% inflation or even outright deflation. To sum it all up, the Fed will start raising rates too late, as real rates have already started coming up and could go up even higher inflation starts going lower. The impact this could have on an overleveraged market is substantial, something that could force the Fed to stop raising rates and even stop its talks about reducing its balance sheet… or maybe even force them to go back into cutting rates and doing QE.
Up to this point we’ve only talked about rates, but haven’t mentioned anything about the USD and how it could affect entire financial system. This is another very important factor that the Fed needs to be aware off, even if they haven’t been explicit about it recently. The USD is the global reserve currency and most of the world’s debt is denominated in USD, which means that when it goes up relative to other currencies, then debt repayments become harder especially for those who don’t earn USD. At the same time when US interest rates go up AND the USD goes up relative to other currencies, that creates immense pressure on the financial system. That’s because people/institutions have to pay more interest on their loans, while the currency they are earning and need to convert into dollars to repay their debt, is worth less and less. These two factors create some serious deflationary pressures as someone might be forced to cut their spending or even outright sell assets in order to keep up with his obligations. Of course, in a situation where the entire globe is doing well and rates go up because the economies are booming, debt is low, and it just happens that the USD is going up as it happens that the US is doing better than other countries, then the dollar going up isn’t really an issue and neither are rates. However, the dollar going up, especially along with interest rates really is an issue when the world is drowning in debt, economies aren’t doing well, markets are overleveraged and optimized to work well in a low-rate environment. Another thing to keep in mind is that the dollar going up might create a vicious loop by accelerating the sell-off in traditional markets as more and more people sell in order to meet their obligations, or take a risk off stance or to take advantage of higher interest rates or to take advantage of its rise relative to other currencies. At the end of the day the US isn’t an economy that functions in isolation and it isn’t the only one that uses or CREATES dollars. That’s something crucial that many people forget, as even if the US economy is doing great and higher rates might be appropriate for the US, the actions by the Fed could create issues in other parts of the world, which in turn could damage the US economy.

TLT Seemingly trading higher.TLT ETF seems to be in a good place to trade higher.
Fundamentals back the technicals which is a really sweet spot for this particular ETF with the 20yr TB's.
Expect a rise out of it over the coming weeks back to the previous highs and beyond but only look to "hodl" should price provide us with a bull breakout of the AP which is the previous weekly highs.
If price rejects the highs then we suggest staying clear until the breakout takes place on the proviso you would have already removed any potential risk exposure previously accumalated.

Relative Momentum of Various Asset ClassesRelative Momentum of Various Asset Classes
SPY - Equities
GLD - Precious Metals
VNQ - Real Estate
TLT - Long Term Treasuries
JNK - High Yield Corp Bonds
SHY - Short Term Treasuries
MUB - Municipal Bonds
BTCUSD - Crypto-Currencies
DBC - Commodities

STX buy signal a huge momentum breaks channel with force. we 75% of probability we will see a bullish trend after pull back

UST10Y Daily Timeframe Supply And Demand Analysis-Price has shown evidence of buyers by breaking downward trend lines, removing opposing pivot point zones, quality DBR created.
-Strong imbalance of buyers stepped in so I'm looking at them potentially stepping in again.

high probability to rise on the ZB I think the ZB will reach 166' but don't enter with too many contracts good luck guys

$ZB_F: Uptrend signal activeWe now have a good signal here indicating bonds can rally substantially in the coming weeks. I've bot a bull call spread to capture the upside here, expiring on Dec 10th, for the March contract.
It allows me to fine tune risk and maximize gains if the trade works in a way that an outright futures long position wouldn't. If you can, join on Monday on dips, if making a higher high, be ready to pay up. It's a good hedge for your portfolio in case of carrying long oil positions like I do.
Cheers,
Ivan.

sse composite sell shortCurrently, based on MY STRATEGY we have a strong wick and volume, that's a pretty strong indication that SSE COMPOSITE PROBABLY WILL GO DOWN next week
65% of probability

DAR ALARKAN REAL ESTATE DEVELOPMENT.CO SELL LONGwe have a pullback situation this is the time to sell. we have a 65% of probability

EMIRATES NBD BANKTrying to reach this level and we have 75% of probability will break the resistance and we will see highiest prix

total energy buy forcewe have an opportunity here buy with force we have a peak of volume and huge momentum

dollarthe dollar so far is normal but should not cross this support if it breaks with the volume we will see a huge shot

US10Year YieldIn my most novice opinion, the correlation of the the yield to SPY correlation has been off a bit due to a mix of tax sell offs and maybe some Omicron fear. However, although we are in a area in opinion, we should still be careful and watch how the correlation moves as we close out the end of 2021 and as we head into next year. GDP growth is slow but has been steadily recovering. Now it's a battle between new fear and prior recovery boost. It's been a movie. Let's see what happens!
US Treasury Yield - Bearish Trend is Recession!US 10 years treasury Yield touched it's weekly trend line and bounce, and if bearish trend will continue it's a sign of recession.

Why the correlation btwn US trsry bond yield and BTCUSD 2020/21I noticed the treasury bond yields are almost identical to the bitcoin/usd chart for 2020 and 2021 ever since the black swan event in March '20, but not in any other period prior to this cycle. Anyone have any insight into why this is and why this wasn't before?

Bearish Looking 10Y US Notes Can Push USDJPY HigherHello traders!
Today we will talk about 10Y US Notes and its negative correlation with USDJPY.
10Y US Treasury yields keeps pointing lower, as we see a bearish triangle formation within wave 4 correction that can send the price even lower for wave 5. If that's the case, then respecting correlations, USDJPY can see more gains for wave 5, as we also see a bullish triangle pattern within wave 4.
As you can see, triangle, a continuation pattern can be approaching the end, as we see the final subwave "e" in progress, so ahead of NFP report, be aware of that final 5th wave before we will see reversals.
Be humble and trade smart!
If you like what we do, then please like and share our idea!
Disclosure: Please be informed that information we provide is NOT a trading recommendation or investment advice. All of our work is for educational purposes only.

Elliott Wave Analysis - US 10Y YieldWho sets interest rates? Is it the central banks... or is it the free market?
Given that the FED's dovish approach clashes directly with this forecast, it would suggest that it is the latter.
My opinion: the FED isn't a leader, but a follower of the worst kind. Consistently making mistakes at the tops and bottoms of markets. If the market pushes rates higher for long enough, the FED will follow.

Naughty Nas Had a Bad Day! Why?!Shares of Goldman Sachs (GS), JPMorgan Chase (JPM) and other financial firms are advancing along with bond yields. The rate on the 10 year Treasury note is up 1.48%. If you did not know, those higher rates are pulling down shares of tech companies that benefit from lower borrowing costs. All the FAAMG stocks had experienced a red day due to this. When trading indicies always keep up with the fundamentals alongside your technicals. If you do not know what the 10yr Treasury Note is, I suggest googling it and get a better understanding of its fundamentals.

10 yrIf rates do not get blocked by that weekly 200 ema and reject from the 1.64 lvl then I would say we are heading into some serious pain for risk assets with a C wave target of 2.14 basis points. IDK guys but im thinking 1.64 holds and SP500 completes my C wave around 4250. Then back up to 5,000 EOY

US 10 YEAR TREASURY - Outlook over next 8 monthsLots of volatility for the next eight months on the US 10 year treasury. Overall rates are moving up, but a couple dip opportunities to lock in your borrowers rates, not a financial advisor, just my thoughts.

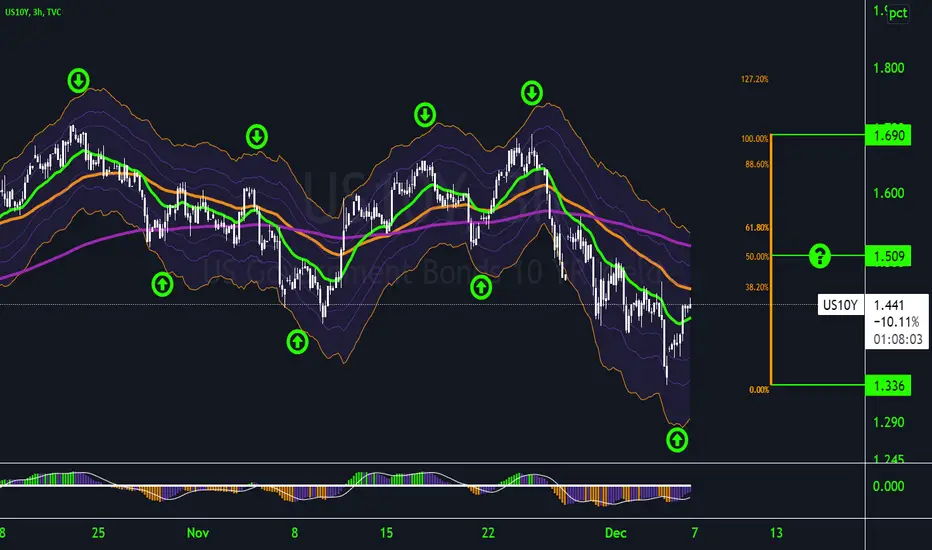
ZB1! Daily TimefameSNIPER STRATEGY
This magical strategy works like a clock on almost any charts
Although I have to say it can’t predict pullbacks, so I do not suggest this strategy for leverage trading.
It will not give you the whole wave like any other strategy out there but it will give you huge part of the wave.
The best timeframe for this strategy is Daily, Weekly and Monthly however it can work any timeframe above three minutes.
Start believing in this strategy because it will reward believers with huge profit.
There is a lot more about this strategy.
It can predict and also it can give you almost exact buy or sell time on the spot.
I am developing it even more so stay tuned and start to follow me for more signals and forecasts.
