Gold Short Term BUYGold hit a big support level and rolling fibonacci bands support this level.
If treasury bond yields hit a panic high yesterday,which I think happened we will at least have a slight softening of real interest rates for a while.
banks can easily buy T Bonds with yields at this level and hold them for a while as they are financing at zero rates so they will be buyers for a month or so at least.
Ultimately the FED cannot control rates over 10 years but the market tanked too much in the T bond future.
This does not mean total relief for equities as they are not good if inflation returns and earnings are impaired.
Gold however can still be financed at close to zero and European rates are still below zero for Bunds.
Although this is a short term view,it may also have been a medium term low but right now just in for a trade.
Treasurybonds


10 yrIH&S pattern broke up the 200 weekly ema. Bond yields will most likely be testing around 1.66% and as long as the markets stay up I think we will enter a blow off top.
I can see 1.66% on the 10 yr or maybe even higher with sp500 making a monster run blow off top to 4200 plus B4 any larger correction.

10Y T NOTE FUTURES (ZN1!) SwingAfter a downtrend since yesterday, now the market will keep going up
i just put my own prediction on the chart
Target A: 136'01'05
Target B: 136"07"01
Stop loss also mentioned on the chart
If you have any questions please leave it in the comment section :)

Treasury Bill multi-day increases as predictor of S&P 500 SellThroughout the rally since April, Treasury Bill multi-day increases like the one we are seeing now have typically predicted corrections in the S&P 500 by 1 week to 2 days.
Strategy: short ES (when other signals such as VIX confirm) and long 10-year Treasury futures.


10Y T NOTE FUTURES (ZN1!) SwingBUY Signal for my prediction
Stop loss and take profit mentioned on the chart


10 yrdaily wick formed a bearish hammer IMO. Looks like yields want to retest the break out around .95. From there we watch, this means a pull back is likely coming to stocks at some point we r talking 16 basis points so could do some damage.
But the DXY looks a bit mixed up and also looks like downside should continue.
The 4 hour 10 yr chart looks strong so this will likely be very choppy and not a straight drop, my original target of 3880 top in SP500 looks questionable. Im basically day trading pulling quick profits until I think this drop is complete.
Still long my crypto XLM XTZ as DXY weakness is apparent and my TP $88.50 still not tested so I can't really be sure today whether the DXY gets massive support & bounces off said level or if that level fails as support. But the correlation between stocks & 10yr is much stronger than stocks DXY IMO. That being said The 10 yr chart looks very similar to DXY.

YIELDS GO UPZN futures broke the 200 EMA for the first time since the end of 2018.
Higher yields on the 10y treasuries are on their way.
But let's be clear. Government debt isn't a bad sign in general, but it will be interesting to watch how the FED will (or if they will) react to this new development.


Bond Yields point to recession....or this time it's different?The 10y-2y bond yields are important because it is the long-short of market expectations; that is, how people view the near-term market vs. their perceived evolution of the market (that also anticipates the FOMC's likely reaction. It's several signals in one). The 10y2ys (blue) is the 10 year Treasury constant maturity (now at 0.96%) Minus the 2-Year Treasury constant maturity (now at 0.19%). When the spread increases, it means there's falling demand for long-term Treasury bonds, which means investors prefer higher risk, higher reward investments. Investors think interest rates will now rise in the short term.
Currently, the 10y-2y is at 0.8 and rising which last happened in December 2007, April 2001, December 1990, July 1986, October 1971... you get it. It's a reliable indicator, and in the past, a negative 10-2 spread has predicted every recession from 1955 to 2018 (SOURCE), but has occurred 6-24 months before the recession occurring. The last time it went negative was in August 2019.
THE ANALYSIS
Notice that we're approaching a golden cross (yellow 50ema crossing the white 200ema). The last time this happened was January 2008, and May 2001. I've overlaid the S&P- you can see it's crashed.
So is this a new paradigm of monetary policy? Or does nothing change? Is this time really different?
Here's the historical US Yield Curve source.
MORE ABOUT THE YIELD CURVE
Bond prices and yields move inversely of each other. When bond prices go up yields go down, and vice versa. The reason that lower yields in the long term are a indicator for the economy is because longer term bonds are seen as safe investments meant for preserving wealth; while stocks, forex, and derivatives are riskier and used for growing wealth. When investors have a good outlook on the economy, they will sell their long term bonds and put that money into the riskier investments listed above. This flight from longer term bonds to riskier investments causes demand for the longer term bonds to fall, causing bond prices to fall ,and yields to increase. In times of bad economic outlook, people will start moving their money from stocks into the longer term bonds as a way to protect themselves from potential future downturns. This flight from stocks to longer term bonds causes demand to increase, causing bond prices to increase, and yields to go down. The change in bond yields is based on bond price, which is based on supply and demand .
HISTORICAL CONTEXT:
The 10-2 spread reached a high of 2.91% in 2011, and went as low as -2.41% in 1980. During recession, central banks lower rates pushing down the i.r. curve. When the spread starts contracting, market expects a coming cut of the i.r. and a future lower curve. For this reason, real world curves (vs academic ones) are decreasing on the long terms: a kind of economic cycle is implied. You may also read the spread under a credit risk point of view: a tight spread means "if an issuer can survive 2y, it is very likely that it will survive also 10y therefore a small extra premium is required". This is very clean in distressed bond issuers: implied yields usually form a reversed term structured (decreasing like an hyperbola).
See more:


Bullish Looking Treasury Bonds May Push USDJPY Even LowerHello traders!
Today we will talk about 10Y US Notes and USDJPY, their price action from technical point of view and wave structure from Elliott Wave perspective.
As you may already know, 10Y US Notes(treasury bonds) and USDJPY are in negative correlation. So, after recent big sideways price action and corrective consolidation, the pattern is becoming clearer and clearer.
Well, what we see is that USDJPY can be forming a bigger bearish running triangle formation, which can sooner or later push the price below 104 level, ideally towards 103 - 102 area, mainly because of current bounce on 10Y US Notes, which seems to have a completed flag pattern, from EW perspective, an a-b-c corrective decline, where wave "c" completed an ending diagonal.
Be humble and trade smart!
If you like what we do, then please like and share our idea!
Disclosure: Please be informed that information we provide is NOT a trading recommendation or investment advice. All of our work is for educational purposes only.

10Y T NOTE FUTURES (ZN1!) SwingWe have a Buy Signal for my prediction
Stop loss and Take profit Mentioned on the chart


10Y T NOTE FUTURES (ZN1!) SwingBuy signal for my prediction
Stop loss & Take profit Mentioned on the chart

10Y T NOTE FUTURES (ZN1!) SwingWe Have a Buy Signal
Stop loss and Take profit Mentioned on the Chart

10Y T NOTE FUTURES (ZN1!) SwingWe Have a Buy Signal
Stop loss and Take profit Mentioned on the Chart With
- Risk/Reward Ratio=1.2
- The market have the Potential to achieve the Orange Line ( That Why I Close the trade manually following my strategy.

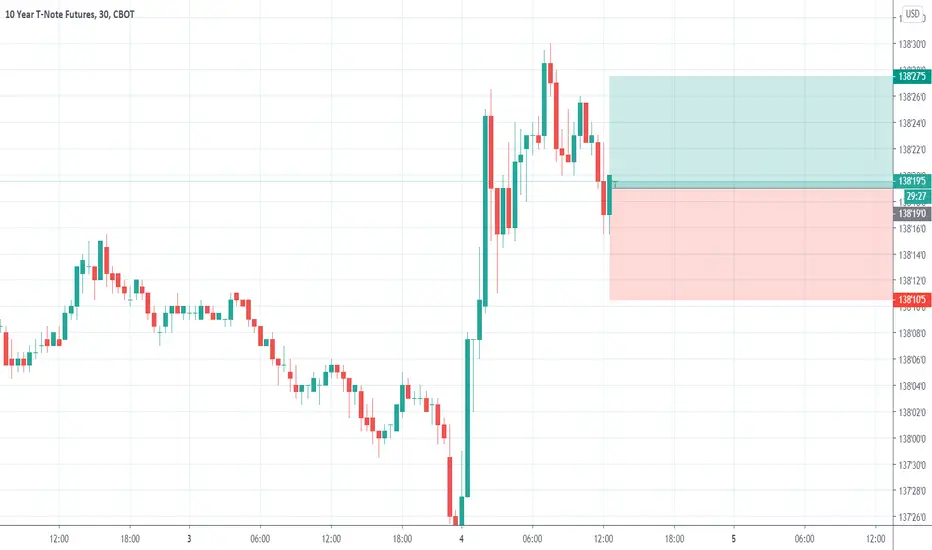
10Y T NOTE FUTURES (ZN1!) SwingWe have a SELL Signal
Stop loss and Take profit as Mentioned on the chart :)
Note: risk / reward: 1.43

10Y T NOTE FUTURES (ZN1!) SwingWe have a Sell Signal
Stop loss and Take Profit Mentioned on the Chart
