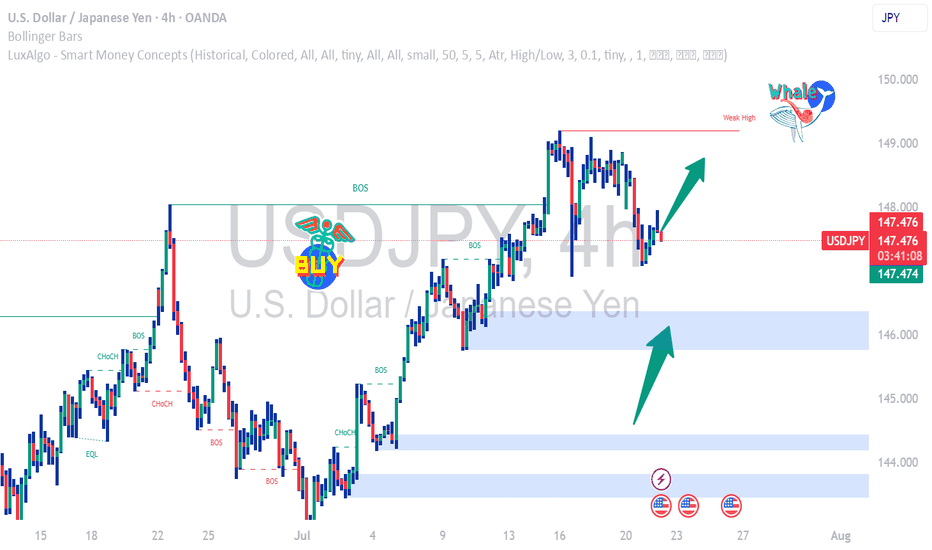
USDJPY Falling Fast Bearish Momentum or Reversal Zone?USDJPY has dropped significantly and is now trading around 147.730, nearing a key historical support zone near 147.20 – 147.00.
This area previously acted as a strong demand zone and may trigger a bounce or a breakdown depending on market sentiment.
🔹 Technical Overview (4H Chart):
• Current Price: 147.73
• Support Zone: 147.20 – 147.00
• Resistance: 149.00
• Breakdown Target: 145.80
• Possible Bounce Target: 148.80 – 149.30
📊 Bias:
I'm watching this zone closely.
• If price holds above 147.00 with bullish candle – Long Setup toward 149.00
• If price breaks below 147.00 and closes on 4H – Short Setup toward 145.80
⚠️ Use tight SL below support zone if buying.
Trebdline
GBPJPY The market had a pullback on the vwap since the candle before the last one shows a significant wick that confirms this idea also the volume that is superior to all the previous ones of this day
Therefore I believe if the market breaks the support of the pitchfork indicator we should sell GBPJPY
ADA Bounce off long term trendADA weekly is looking to bounce off long term support trend line. You can see it has touched and rejected this trend line multiple times since the start of the year. Still early to say as the week is only past the half way point, we are looking at the first green candle from over 5weeks now. Could this be the reversal ADA holders are looking for?
MACD showing signs of a swing and RSI has kicked up. Last time RSI was at this level was all the way back in March last year.
Let's see how this pans out at the end of the week.
GLTA and have a Merry Christmas!
Binance May Get Stuck in a BTC SituationBNB is facing fierce resistance from an old trend line that connecs the last 1 major peaks across 2 different bull cycles. So far, it failed to penetrate it twice and the momentum is decreasing accordingly. OBV is showing almost horizontal levels despite the increase in the price, while RSI si signaling decaying momentum. In face of this resistance, there are 2 main lines of support: horizontal, historical resistance, and the trend of the low prices. The latter forms a triangle pattern with resistance and is a strong support if compared to the horizontal line I mentioned.
The Fib fan shows that we arwe exactly at the original trend line after the correction in February. This is good news. The bad news, however, is that we may find support again below both of the aforementioned trend lines at the first Fib retracement around the 500 price. If it happens, then we will witness something similar to the current BTC graph, which would be interesting for an alt coin which was growing exponentially a short while ago.
For now, for the short term, the direction is downwards.
BTCUSD: Bullish trend continuationDear trading enthusiast,
Price action in the coming days is rather important for determining the overall direction in the coming weeks and months.
Looking at the current trend:
- Price is contracted in a falling wedge (green) and testing the bottom of the yellow channel.
- RSI is printing hidden bearish divergence.
I expect to see price brake out upwards out of the falling wedge (green) and re-test the upper resistance (blue) shortly after.
A closure (on the weekly) candle below 8000 would be rather bearish (short-term) and require a new analysis.
TheNDK
*** This post is for your entertainment only and not trading advice ***
BCHSVBTC is Primed again BCHSVBTC is a buy once again with good RSI support and a similar bullish formation forming once again. With FIB support being right underneath current price right now it is a safe time to place a buy order for 39 percent potential return.


