NZD/JPY short opportunity!Hello traders! I find this nice short opportunity on nzd/jpy. The price tested the 83.75 price and got a strong rejection. There are no buyers interested. Trade with care!
Trend-analysis

US/SPX500 SHORT opportunity!Hello traders! Watch price action. It can form a correction on this level. If the price break the trend line and have a strong impulse down, then it can be a good short opportunity. If touch the trendline and reverse than it may go for a new high. Don't just jump into the trade!!!

$ETH Supports/Resistances - A possible bull run$ETH/USD is looking great and breaking a lot of supports. Currently pullback to around 250 is likely, but its pushing upwards fast. On last resistance breakout we are back fully bullish.


$BTC Supports/Resistances - The king is BackCurrently very bullish on BTC after breaking it's ATH in a fashionable 10% rise, I suspect on the next breakout we would see a similar move, to about 3500-3700 range. Stoch RSI on 2H is bullish on the breakout may happen on this round.

Just Another Ammateur IdeaMy first chart analysis. Quite simple logic. Please, don't invest following this... I'm just trying to learn with the community!
Good luck guys!

GBPUSD Long Position (4Hr Timeframe)-Long bias due to ascending channel
-MA crossover in daily
- fib retest on 38.20% suggesting long
- wait for long breakout before taking the position

Bitcoin UP! Out of bear channel! Now what?BIP 91 looks to be locked-in now. As hypothesized in my last post, this has given us enough boost to push our way through some MAJOR resistance points. Bitcoin's behavior here is extremely bullish! At the time of this writing, BTC is currently wrestling with resistance at $2599. Once through, it's on up to $2670 or the bottom of our bullish GREEN channel, whichever comes first. Once we get there, I am not sure how much energy the bulls will still have. If we do end up getting to the bottom of the bullish GREEN channel today, I don't think the market will be able to power through.
My analysis today is that we either tap out at $2600 or somewhere around $2670. Tomorrow is another day but I don't see us breaking back into our bullish GREEN channel today. And, if you are a day trader (which I am NOT), these are excellent areas to short back down to the 50 MA or even possibly the $2420 support.
Happy trading folks!

Litecoin continues to hold $45 and probably will continue holdNot surprisingly, Litecoin (LTCUSD) is holding it's $45 support today. While it is possible that it could go lower, my suspicion is that it won't. Instead, while Bitcoin (BTCUSD) continues to unravel until our Aug. 1 target date, I suspect Litecoin (LTCUSD) will bounce around in here between the $45 support and $50 support until our middle Bollinger Band or 20 MA comes up a bit to give us a boost. Once this happens, it may provide just enough steam to propel us back over $50 which is now currently acting as resistance. Then onto $60-$75 for Litecoin!
Happy Trading friends!


GBPUSD Short gartley, we are in a downtrendGBPAUD is in a downtrend, and is forming a bearish gartley pattern. The D completion is just around the round numer - 1.70000.
1.272 fib ex. alligns with the round number, which is also good, if you're looking for a short.
Stops above X.
Targets are:
1st. .618 retracement of C-D
2st. If we are to reach 1st target, I will move stops to breakeven, and take off half my position. Now I try to see how long this short can go.
Happy trading

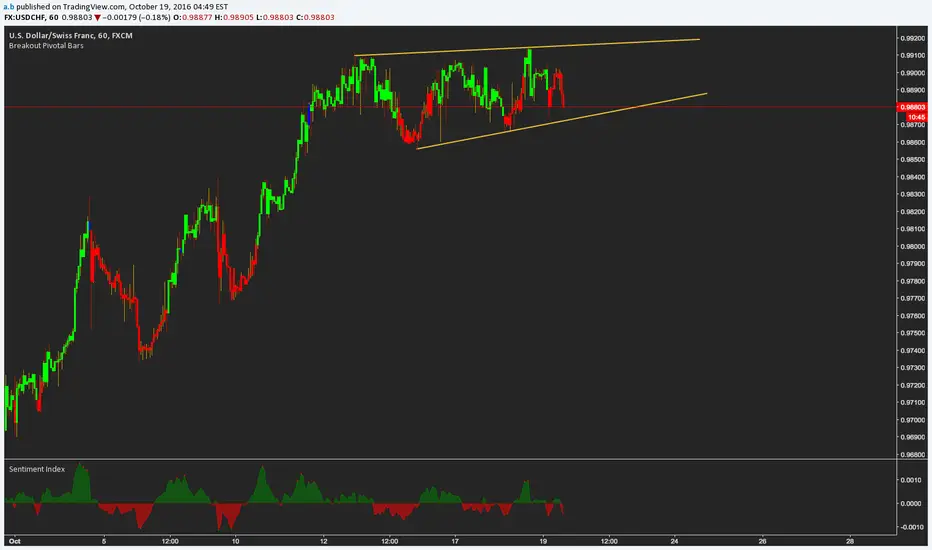
USDCAD switching trend shortly! 1.3300I guess, we will be seeing trend change on H1 USDCAD, hitting 1.3300

NZDUSD Try Nr. 2As my long went into SL, the trend line is being broken.
As soon as the break will be confirmed, SHORT everything out of it.
Hourly chart: Uptrend Line broken
Daily chart: Failed at old trend line resistance

NZDCAD Long!Using trend analysis, this should be a good trade. Stop is under trend support, TP1 is the next trend resistance. If TP1 is hit, look for a move to the previous high around .96350

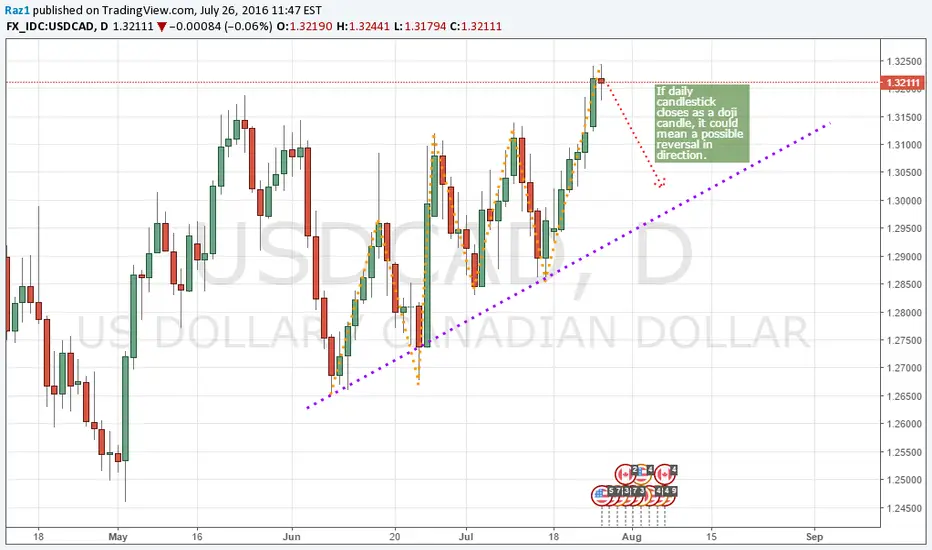
If USDCAD ends in a doji, reversal in direction?Here is a daily chart of USDCAD, as you can see, it seems to be making a trend cycle. If the daily candlestick ends as a doji it could be a possible turn in direction and a chance to short. If this happen, this short would probably be a retracement before continuing up.
Please trade using your own discretion.
EURAUD heading higherWith the crazy ECB announcements, there might a bullish trend reversal on the pair. After a clear break of a bearish trendline, I expect EURAUD to head higher in the near future. However I am expecting a small pullback before it makings it's next big move. Trade with care.
For more daily signals and analysis, please follow me. As well don't be afraid to leave a comment either you agree or disagree. Happy trading!
