HBAR - Riding The Beast!Hello TradingView Family / Fellow Traders. This is Richard, also known as theSignalyst.
📈After breaking above the $0.1 mark, HBAR surged by almost 400%.
Currently, HBAR is in a minor correction phase.
Moreover, the green zone is a strong demand.
🏹 Thus, the highlighted blue circle is a strong area to look for buy setups as it is the intersection of the demand zone and blue trendline acting as non-horizontal support.
📚 As per my trading style:
As #HBAR approaches the blue circle, I will be looking for bullish reversal setups (like a double bottom pattern, trendline break , and so on...)
📚 Always follow your trading plan regarding entry, risk management, and trade management.
Good luck!
All Strategies Are Good; If Managed Properly!
~Rich
Trend-break

FITFI NEW INCREASE VOLUMEFITFI seems to enter a new uptrend volume which has the chance to break in the coming time frames.
Fitfi shows interesting trend for next high volume trend.

HOT CAN SHOW HISTORICAL INCREASEHot seems to have an interesting volume, which could increase with the coming time frames, we will follow the trend to see for new changes in data.
will the trend follow FLoki, SHIBA's last hype? The chance is there high.
we did update before about Floki with same update

AUDJPY continue moving down after break a decreasing channel AUDJPY continue moving down after break a decreasing channel SELL!
after break and retest i think the price gonna move down!

Bitcoin close to a crucial long term support zoneBitcoin price hitting a 7 year long daily support zone. I don't see a single day candle closed below it. Maybe this time we break under it and break the trend, or bounce from here and keep the trend.

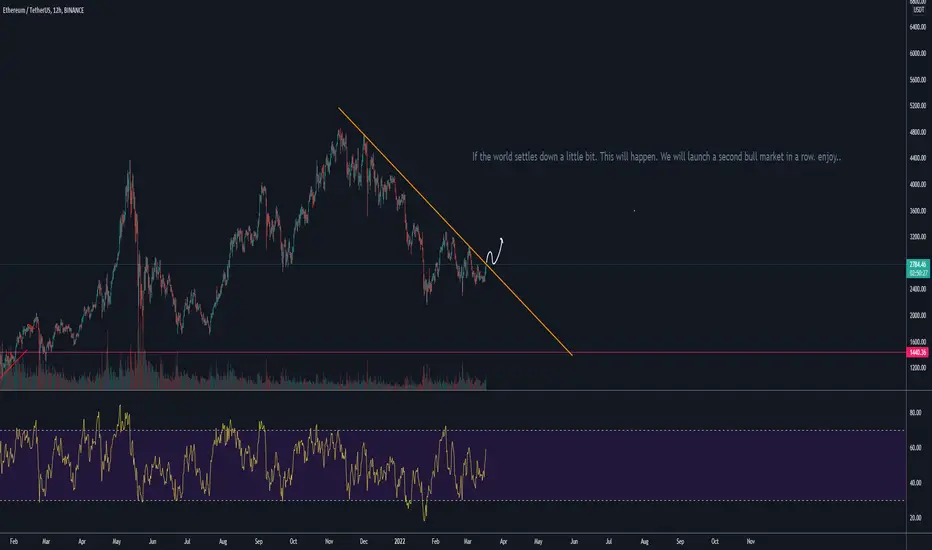
ETH waiting for a piece of good world news -> kickstart altsznMy thoughts are that we will break this down trend, with just one good piece of good world news.
ETH will gain a lot, alts will gain more. Bitcoin will be the boss: surviving wars and energy deficits.
not financial advice
EURGBP buy tread1) Strong support level
2) RSI
3) down trend is break
I think this is going to go up

Sell opportunities Price forming double top plus daily resistance and reject by trend line, price currently break trend line. Enter at your own risk


EUR/NZD Fibonacci Span long termIn my opinion we are still in an uptrend in the market, the last span placement has a clear high low. It is trending bearish on lower time frame. You can clearly see how the market reacts to previous fib span lines. Simply go to the smaller time frames to check for break of resistance & retests to find which line has more bearing. Then, you can return to the weekly & come up with your own projections. I save the charts in this format, then make copies when I go the lower time frames for mark ups & the typical 5 - 15 minute trades I usually make.

GBP/NZD - Short Position AnalysisThis pair has fallen around 220 pips since an initial entry was identified.
Price broke this ascending trendline, retraced to a key level in price on the LTF coinciding with trendline rejection with wicks forming to the upside.
Zoom out and you'll see GN is at the top of the range and through cross analysis you can identify that this currency pair is strength vs strength.
Any questions feel free to drop me a private message.

Don't miss this amazing EURGBP break!Hey there, EURGBP is going to break the downtrend from upper line, it is following an small uptrend even in price and rsi and I'm expecting a 0.70% (60 pips) rise on break as first movement. After that, the price will keep going up and up, we can't know how much it can go but you can use my safe pivots trading.
SL == break below 0.85847
TP1 == 0.86691
TP2 == 0.87223
TP3 == 0.87930
This is not an investing advice, please calculate your risk and margin trading.

NZD/USD - Evolved Structure and LevelsWe can see price has now reversed - we expected dollar strength and this is what we're continuing to see through London this morning. Lets see how price develops on the pair through New York in around 4 hours time.
Identify key trends, key breaks, key structure levels. We're expecting more downside movement on the pair.
Happy Trading! Hope you all have a great week. Remember, any analysis questions drop me a message!

EURJPY Short?I have spotted a breakout of the trend line with a retest, possible downwards move from here. What do you think?


EUR/USD - 700 Pips Down Potential!Hello traders,
I bring you here an interesting view LONG TERM on EUR/USD.
In this chart we can see EUR/USD is about to become a long time bear.
We have a bearish cross on MAs, Broke an almost 2 year old support trend line and now after retest the trendline a Shooting Star Candle.
This trade has big downside potential and for those who love swing trading will certanly appreciate this analysis.
I personally am more of a Daily trader, but i spotted this oportunity and wanted to share with you all.
If you find this post useful dont forget to leave a like :)
See you on next trade,
ForexAcademyClub

EURUSD Break retestEUR USD long, break and retest from 4 Hour trend line.
Technical analysis, any news going to ruin this?

Difficult market? Two important price action concepts help!BTC has moved sideways now for some time, prices swinging up and down. A lot of choppy behavior with several tricky moves.
There are two important "secret" concepts that can help you find entries in nearly every market condition.
By having these skills you can often avoid having the market confuse or trap you!
Concept A): After the break of a trendline, there will be one or two legs to a new low/high.
Why is that working? It just traps people who entered after the break, looking for a reversal.
When a new high/low occurs they might get stopped out and think the trend continues, just when the real trend reversal begins!
Additionally other traders enter when prices brake out to a new high and low, only to see prices reverse. Now they are trapped to the wrong side.
Concept B): Second entries. This is just two pushes (two legs) against the trend direction.
When prices pullback in two legs and then make a second attempt to go in trend direction it is a second entry.
Why do these work so well? In an uptrend people see a lower high, then a lower low. Now many think bearish and suspect a reversal, the beginning of a new downtrend. New shorts also come in, hoping to catch a new downtrend early. Of course then the uptrend continues, hitting stops of shorts. Also skilled traders go long, driving prices further up.
These two vital concepts require some experience, but you can find such entries constantly, because trends also occur inside broader ranges/channels as we can see in the Bitcoin chart.
I have numbered 5 entries which can be based on these concepts + other clues:
Trade 1: Short -> Concept A + bulltrap
Trade 2: Long -> Concept A +B + retest support from breakout
Trade 3: Short -> Concept A + pullback to EMA + trend channel test expected
Trade 4: Long -> Concept A + B + successful retest of uptrend channel
Trade 5: Long -> Concept A + B + pullback to EMA + retest support from breakout
What is happening right now?
We have seen a strong breakout and two legs up. Prices have also overshot the broader trend channel!
Now it looks like a new steeper two tiered channel is in play (with a midline).
We are trading at the upper end of this channel, so maybe BTC will retrace to 9500 again, but do not look for short entries in such a strong trend!
Feel free to comment or ask questions! Or just follow me ;)


Looking to buy AUDUSD on supportMain trend is still up and confirmed by the false break of the trendline.
i'll wait to the pullback and buy on support - low risk high reward in this trade.
Further details on the chart.
please leave comments what do you think :-)
Best of luck :-)


USDJPY getting ready to breakFX_IDC:USDJPY is getting ready to break. We can expect both ways but because the trendline was broken we can expect move to the upside.
USDJPY was downtrending for more than a half year without any bigger moves upside so we can expect a break.
Good luck with trading.
