XAUMO Strategy – GOLD (XAU/USD) for Monday, Feb 12, 2025 Market Overview – The Smart Money Play
🔹 Gold (XAU/USD) trading around $2,860-$2,861 – Bulls still in control on higher timeframes but showing signs of exhaustion.
🔹
Liquidity traps above $2,875-$2,880 – Institutions baiting late buyers.
🔹
Volume decreasing at resistance – Smart money unloading positions.
Translation? Market prepping for a trap & reversal play before the next expansion.
📌 XAUMO SESSION BREAKDOWN & EXECUTION PLAN
🔴
1) Asia Session: Market Balance & Trap Setup
Price Action: Tight consolidation, low volatility, setting up liquidity grab.
Volume: Diminishing – classic pre-move buildup.
Liquidity Zones: Buyers trapped above $2,875-$2,880.
Key Levels:
Support: $2,850-$2,855
Resistance: $2,870-$2,875
🚨 Game Plan:
If price spikes into $2,875-$2,880, look for a reversal short.
If price drops to $2,855 and holds, expect a bounce.
✅ Trade Setup:
📉 Sell Limit: $2,875
🎯 Target: $2,855 > $2,845
❌ Stop Loss: $2,883
🟡
2)London Session: Expansion & Trend Confirmation
Price Action: Market picks a direction – we trade the retest.
Volume: If RVOL spikes, expect breakout move.
Liquidity Zones: Order blocks forming at $2,850-$2,855.
Key Levels:
Bullish if price holds $2,855, expect $2,880+.
Bearish if rejection at $2,875, expect $2,840-$2,830.
🚨 Game Plan:
Watch for fake breakouts at session highs/lows.
VWAP & POC confirm bias.
✅ Trade Setup:
📉 Sell if $2,872 rejects
🎯 Target: $2,850 > $2,835
❌ Stop Loss: $2,881
🟢
3) NY Session: Institutional Moves & Volume Surge
Price Action: The real move happens here – Smart Money decides direction.
Volume: If RVOL > 1.5, trend continuation is confirmed.
Liquidity Zones:
$2,875-$2,880 – Bull Trap Zone
$2,840-$2,830 – Sell-Side Liquidity
🚨 Game Plan:
If price fakes out above $2,875 & dumps, SELL HARD.
If NY session defends $2,855, BUY THE DIP.
✅ Trade Setup:
📉 Sell below $2,850
🎯 Target: $2,830 > $2,815
❌ Stop Loss: $2,860
📈 Buy if price reclaims $2,860 after fakeout.
🎯 Target: $2,880 > $2,885
❌ Stop Loss: $2,852
FINAL XAUMO EXECUTION STRATEGY
If price spikes to liquidity levels, fade the move.
🔸
If VWAP & Delta confirm direction, ride the trend.
🔸
Use session highs/lows as liquidity magnets.
🔸
If RVOL confirms strength, scale in aggressively.
Trend

CHILLGUY/USDT BACK TREND TO $0,27?This coin has had a huge breakdown since the start of the coin launch, are we going to see a recovery for this coin that can have a comeback?
This is exactly what we are going to follow.
If this coin is able to have the recovery in the coming time, then it would be an interesting change of data.
If there is an increase coming.. then this could be the confirmed bottom.

SOYBEANS to 1.035 bullish trend for Frist Quarter 2025The fundamental factors affecting soybean prices in 2024 have shown mixed developments, with weather conditions and global demand playing crucial roles. For 2025, the direction of prices will depend on China's economic recovery, weather conditions, and agricultural policies in the U.S. under the new Trump administration.
On the technical side, there is an accumulation of positions and manipulation in sell stops at the monthly level. I would like the price to reach the equilibrium of the range in the first quarter of the year; depending on the evolution of the fundamentals, we could even see a value of 1,100. If this idea is invalidated, I would expect prices of at least 927.7.
Monthly chart for context:

SUI DAILY First retest of the 1D 200 EMA since September '24, and a fill of the FVG area. A very strong reaction off that level but the overall trend of Lower Highs and Lower Lows signals a bearish trend.
For that reason a golden pocket rejection could be the play if price reacts off that level, SUI would then target a move to fill the wick if breaking it can break under the 1D 200 EMA.
I would look to go long if the Lower High is taken out and 1D 200 EMA is confirmed as support.

Gold might revert to the trend line following a rising riseHello everyone, today I'm ready to provide you with Gold analytics. A few days ago, we saw a big upward movement in the market, but before that, Gold traded near support 2, which coincided with the support zone. Then it rebounded and surged to 2727 points before correcting even below support 2, but then it reversed and began trading inside the wedge. Price plummeted below the trend line and immediately rebounded, shattering the second support level and continuing to climb higher along this line.Gold ascended for a long time along this line, but on the fourth touch, it rebounded and reached the first support level, which corresponded with another support zone. Then it corrected to practically the trend line before quickly rising back to the first support, breaking it, and exiting the wedge. It then retested and increased its score to 2880 points. Now, I expect XAUUSD to make a correction to the trend line, which is positioned within the support zone. That's why I set my target at 2800 points, which corresponds to them. If you appreciate my analytics, please support me with a like or remark.

ONDO - The Sweet Spot!Hello TradingView Family / Fellow Traders. This is Richard, also known as theSignalyst.
📈After rejecting the $2 round number, ONDO has been in a correction phase and it is currently approaching the lower bound of its rising broadening wedge marked in blue.
Moreover, the green zone is a strong support and round number $1.
🏹 Thus, the highlighted blue circle is a strong area to look for buy setups as it is the intersection of the $1 round number and lower blue trendline acting as a non-horizontal support.
📚 As per my trading style:
As #ONDO approaches the blue circle, I will be looking for bullish reversal setups (like a double bottom pattern, trendline break , and so on...)
📚 Always follow your trading plan regarding entry, risk management, and trade management.
Good luck!
All Strategies Are Good; If Managed Properly!
~Rich

TRUMP/USDT BACK TO $20?Trump showing on a low time frame new uptrend volume, This volume can build a new low time target for Trump as $20 USD +

BTC Correction Nearing Key Support – What’s Next?Bitcoin has been in a corrective phase over the past two days, retracing from recent highs and approaching critical support levels. Let’s break down the current market structure and identify potential trade opportunities based on confluences from multiple technical indicators.
Key Support and Resistance Levels:
1. ) Golden Pocket Zone – $95,535 to $94,994
The 0.618 Fibonacci retracement is a widely recognised level where strong reactions often occur.
This level aligns with a previous consolidation zone, making it a key demand area for potential long entries.
A bounce from here could indicate that bulls are regaining strength.
2.) Deeper Support – 0.786 Fib, Monthly Order Block, and Yearly Open (~$93,576)
If the golden pocket fails, the next key area of interest is around $93,576.
Here, we see confluence with:
The 0.786 Fibonacci retracement, often the last strong retracement before a reversal.
A monthly order block, which has previously acted as a strong support area.
The yearly open, a crucial psychological and technical level that often holds significance throughout the year.
3.) Next Major Support if Yearly Open Fails – $88,000 to $86,000 (Swing Low & Weekly Support Zone)
If price drops below the yearly open with confirmation of bearish momentum, I would look for the next buying opportunity at the swing low or weekly support zone, highlighted in the yellow box around $88,000 to $86,000.
This area holds strong confluence as a higher timeframe support level, making it an attractive zone for potential accumulation.
4.) Resistance Levels – Open Price and Psychological Barrier at $100K
$97,700 – This is the weekly open resistance level. If BTC struggles to reclaim this level, it could indicate further downside.
$100K – A major psychological resistance where sellers could step in. Breaking and holding above this level would be a strong bullish signal.
Trade Setups Based on Current Structure:
1.) Long Trade Setup – Golden Pocket Zone ($95,535 - $94,994)
Entry: Between $95,535 and $94,994 (Golden Pocket Zone)
Stop Loss: Below $93,500 to protect against further downside
Take Profit 1: $97,700 (weekly open resistance)
Take Profit 2: $100K (psychological resistance)
2.) Deeper Long Setup – If 0.618 Fib Fails ($93,576 - Yearly Open Zone)
Entry: Around $93,576 (0.786 Fib + Monthly Order Block + Yearly Open)
Stop Loss: Below $92,000
Take Profit 1: $97,700
Take Profit 2: $100K
3.) Alternative Long Setup – If Yearly Open Breaks ( FWB:88K - $86K Zone)
Entry: Around $88,000 to $86,000 (Weekly Support Zone)
Stop Loss: Below $85,000
Take Profit 1: $93,500 (yearly open retest)
Take Profit 2: $100K
Final Thoughts:
Bitcoin’s current structure suggests a healthy correction within a larger uptrend. The golden pocket ($95,535 - $94,994) remains a key level for potential long entries, while a failure to hold here could see price testing the $93,576 region. However, if price drops below the yearly open and confirms bearish momentum, the next major buying opportunity lies at the Swing Low or Weekly Support Zone at $88,000 - $86,000.
New Free Indicator – Multi Timeframe 8x MA Support Resistance Zones
I’ve just released a free indicator called Multi Timeframe 8x MA Support Resistance Zones, which is now live and ready to use! This indicator provides dynamic support and resistance zones based on multiple moving averages across different timeframes, helping you identify key areas for potential trade setups with better precision.
Feel free to check it out, give it a try, and let me know your feedback! 🚀

XYRO/USDT NEW VOLUMEXYRO/USDT NEW VOLUME
High riks coin, same time its a coin which can show new volume coming time

RUNE/USDT DAYTRADE VOLUMERUNE/USDT DAYTRADE VOLUME
It can start a new uptrend volume in the coming hours

Gold (XAU/USD) 4H: Bullish with Possible Pullback?Gold (XAU/USD) 4H Chart Analysis: Bullish Trend with Possible Pullback
Key Observations:
1. Price Action & Trend:
The price is currently trading around $2,817.685.
The trend appears bullish, with a strong upward move.
There is a marked internal liquidity (Int. LQ) taken, indicating that liquidity has been absorbed, which could lead to further upside.
A market structure break (MB filled) suggests past resistance turned into support.
2. Technical Indicators:
Exponential Moving Average (EMA 200, red line) is at $2,709.123, which is significantly below the current price. This suggests that gold is in a strong uptrend.
Relative Strength Index (RSI, 14 close) is at 68.56, nearing the overbought zone (70) but still has room for potential upside.
3. Projected Movement:
The chart suggests a potential pullback (small consolidation) before further upward movement.
Fair volume ranges (marked in red) indicate levels where price may slow down or consolidate before continuation.
Price is above key liquidity levels, which may act as support.
Conclusion:
The trend remains bullish, and the price could continue rising after a minor consolidation.
Key levels to watch:
Support: Around $2,800 (former liquidity level).
Resistance: Next potential target is $2,840 - $2,860.
Risk Consideration: RSI is approaching overbought levels, so a short-term correction could occur before another push higher.

ETH - One More, No More!Hello TradingView Family / Fellow Traders. This is Richard, also known as theSignalyst.
📈 ETH has been bearish trading within the falling channels.
🏹As ETH is hovering around the lower bound of the channels, which lines up perfectly with the $2,500 round number, it would be an attractive zone (at least for me) to look for longs.
🏹On the other hand, for the bulls to take over long-term, a break above the upper trendlines and $3,000 round number is needed.
For now, we wait! ⏱️
📚 Always follow your trading plan regarding entry, risk management, and trade management.
Good luck!
All Strategies Are Good; If Managed Properly!
~Rich

SUAI/USDT NEW TOKEN : AI AGENT 5-10x?SUAI/USDT NEW TOKEN
This is a high-risk coin, which can show some possibilities in the coming time.
There is no data about this coin, and the only reason for checking is the first TA confirmation includes some trend following.
Can this coin gain to $0,08?
This is exactly what we are going to follow.
Never hold high-risk coins, but you can follow them with the right SL.
This coin is added at the mexc exchange
This is not trading advice, manage always the risk since crypto is risk full.

Bitcoin (BTC/USDT) 4H Analysis: Critical Support Test –(caption)🚀 Bitcoin (BTC/USDT) 4H Chart Analysis (Feb 2, 2025) 📊
🔍 Key Observations:
1️⃣ Strong Support Zone (Red Box) 🛑
BTC is currently testing the $98,000 - $99,000 support zone.
This level has previously acted as a demand area, meaning buyers might step in.
2️⃣ 200 EMA (Exponential Moving Average) Resistance (Red Line) 📉
The 200 EMA at $100,718 is acting as dynamic resistance.
A break and close above this level would indicate bullish strength.
3️⃣ Key Resistance Levels 🚧
$100,718 (200 EMA Resistance)
$102,884 (Major Horizontal Resistance)
If price breaks these levels, next targets: $104,000 - $106,000.
4️⃣ Key Support Levels 🛠️
$98,000 - $99,000 (Current Demand Zone)
$90,000 - $89,184 (Next Major Support Below)
📈 Possible BTC Price Scenarios:
✅ Bullish Case (Price Bounces from Support) 🟢
If BTC holds above $98,000 - $99,000, a move toward $102,884 and higher is possible.
Breaking above $102,884 could trigger a rally toward $104,000 - $106,000.
Watch for volume increase & bullish candlestick confirmation.
❌ Bearish Case (Break Below Support) 🔴
If BTC breaks below $98,000, we could see a drop to $90,000 - $89,184.
A break below $90,000 could lead to further downside toward $88,000.
Watch for strong selling pressure & breakdown candle.
📊 Final Thoughts: BTC at a Critical Level!
🚨 Decision Point: BTC is at a key support level—will bulls step in, or will bears take control?
🔹 For Bulls: Need to reclaim $100,700+ for bullish continuation.
🔹 For Bears: Losing $98,000 could open the door for a drop toward $90,000.
👀 Keep an eye on price action & volume for the next big move!
🔥 What’s your bias? Bullish 🚀 or Bearish 📉? Let’s discuss!

ADA/USDT RECOVERY TIMEADA/USDT RECOVERY TIME
There is good chance that Ada/usdt will return to up 1 USD level

XAUUSD TODAY'S MAPPING IN 4H TF Hello Guy's Welcome To Another Day Of TRADING
Here we are mapping chart of XAUUSD ( GOLD ) in 4-Hour TF
This chart shows the price of gold (XAUUSD) over time. The price is moving in an upward trend (light blue channel).
Current Situation: The price recently dropped but is near a strong support area (gray zone).
Prediction: If the price stays above this support, it might bounce back up and continue rising.
Risk: If it falls below the support zone, the trend could change.
Basically, the idea is that gold might go up again after a small dip, but if it breaks below support, the trend could reverse.


EURUSDA trend it may or may not respect it but I only try my Tools should it respect my tool or my strategy is wrong that what am into it

SHORT SILVER (XAGUSD) Based on Trend Exhaustion & Mean ReversionThe line-work pretty much spells it out ...
Not shown are the pitchforks that generated some of the trendlines. The Resistance/Support Channel is derived from the same. The AVWAP establishes the "horizontal" (i.e. "momentary) component of the range, while the diagonals establish the "arguably more reliable"trading range. The anchored Volume Profile lends further corroboration.

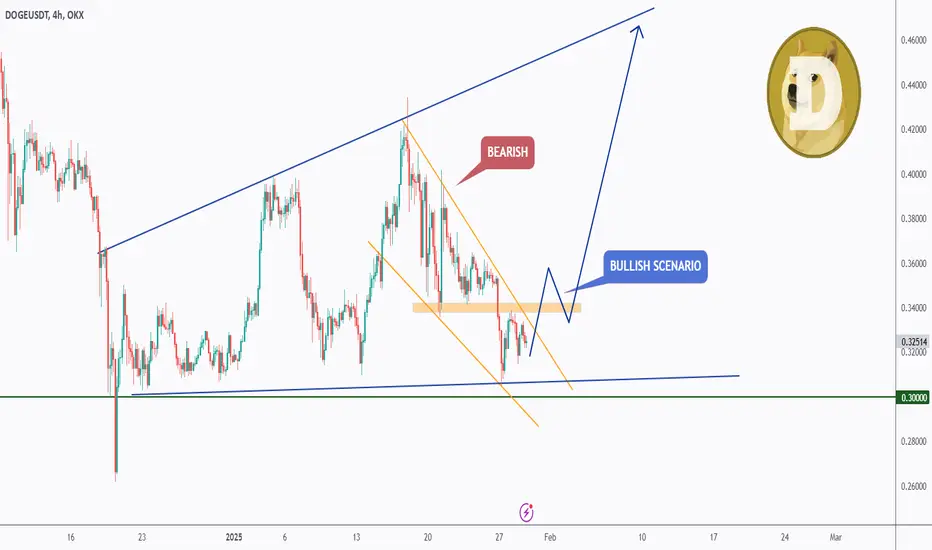
DOGE - DOGS vs BEARSHello TradingView Family / Fellow Traders. This is Richard, also known as theSignalyst.
📈 DOGE has been in a correction phase trading within the falling wedge pattern marked in orange.
🏹For the DOGS (bulls) to take over, and start the next impulse movement towards the upper bound of the blue wedge, a break above the last high marked in orange is needed.
For now, we wait! ⏱️
📚 Always follow your trading plan regarding entry, risk management, and trade management.
Good luck!
All Strategies Are Good; If Managed Properly!
~Rich
BULLISH ON $LINK as potential front runner for Alt of 2025?I know that’s a BIG STATEMENT but I do see merit here. ChainLink is a very powerful network with its capability’s.
Anyway the idea is simple the first circle's purple green yellow all smaller to larger are same as the right side but the last yellow circle you see only 1/6th so if the rim. All this is hard to make out when zoomed in on a long frame chart so it was easiest way and I added pitch fork to give the over-all tend-line with the fork set to the last trend change. For a more realistic outlook which is still FUCKING INSANE! “”IF IT CAME OR COMES TRUE!”” I will see when I look at this accounts ideas ain 1-10 years and to holy shit I actually owned that..!?? Haha
Alright THIS IS WHY I AM SO BULLISH ON BITCOIN I MEAN LINK! lol CRYPTOCAP:BTC WILL PULL CRYPTOCAP:LINK ID OWN BOTH JUST A IMO.
ALSO MOT FINACIAL ADVICE I AM NOT FINANCIAL ADVISOR OR STUDY FINANCE SO I ONLY TRADE WHAT I KNOW WHORKS AND SHARE WITH SOME PEOPLE BUT THIS WONT BE THE SAME ON ANOTHER TRADE AS IT ALWAYS CHANGES SO TRADE YOUR OWN STRATEGIES!
Below is the reason I own and will continue to HODL CRYPTOCAP:LINK #ChainLink
Chainlink ( CRYPTOCAP:LINK ) has as a decentralised oracle network that connects smart contracts with real-world data, APIs, and traditional banking systems. It’s absolutely next level and NEW businesses or entrepreneurs will want to build on or use the chain link blockchain to do business maybe just pay people or for BONUS salary or even a “second option” to “Superannuation” or CRYPTOCAP:BTC will do so for first time under Trump administration or a the least I have heard this from a random but human source.
Anyway so since blockchains cannot access external data on its own, Chainlink acts as a bridge, enabling smart contracts to execute based on real-world events, such as price feeds, weather data, or even sports scores.
For users being solo or business, Chainlink enhances most (if not all) blockchain applications by providing reliable and tamper-proof data, ensuring decentralised finance (DeFi) platforms, NFT projects, and other Smart Contract-Based services function accurately and securely. This reduces reliance with any centralised data providers, increasing transparency and trust amongst the entire user base and anyone who chooses to look on the chainlink block explorer.
For big company’s Chainlink offers a secure way to integrate blockchain technology without overhauling existing digital infrastructure. Businesses can leverage its oracles to automate processes, improve efficiency, and access new blockchain-based financial products. It enables smart contracts to be used in insurance, gaming, supply chain management, and more.
The benefits of Chainlink include its decentralized nature, security, and widespread adoption across major blockchain projects. However, drawbacks include potential scalability concerns, reliance on node operators for data accuracy, and competition from other oracle solutions. Despite these challenges, Chainlink remains the dominant oracle provider in the crypto space, powering many DeFi applications.
Now that there wasn’t me that’s a disc rip took of Link. This is why I BELIEVE it’s a contender FOR 2025 Altcoin of the year or at minimum top 5…! Heck it is just following CRYPTOCAP:BTC little bit of CRYPTOCAP:ETH moves it. Depends.. I just think the MARKET NOW is about to go KAPUT AND BE TRIAL FOR THSOE WHO ARE HOLDERS AND WHO ARENT. This is one of my final warnings.
It will happen the market is way over priced. It may SEEM not but it is and mathematically as well. So we need to be careful with “MEMES” always another threat which is so stupid people still fall for the Twitter or telegram or Instagram image of some random LOGO animal and name with a $ ticker so it seem “Legit” cut so many new people don’t know it’s easy to make a meme coin and has been for years now. It’s that no one knew or no one wanted to know and didn’t learn it and it wasn’t idealised by the ”masses” to look at. I mean even the church or the royal family’s ITS NEW for them and this is the whole thing with cryptocurrency even JUST CRYPTOCAP:BTC AND that’s why we say “JUST Bitcoin” because anything else HAS YET TO BE ADVERTISED largely on a world wide scale like bitcoin on the Bitcoin network. Notice the lower b and upper B single word bitcoin is reference to the coin I or you own. Or can mine then the Bitcoin network or even Bitcoin references the Bitcoin network.
Just for any future reference if it’s a book or something you will get it ;)

SHORT META Ahead of Earnings Report Based on Insider Selling"Meta Platforms Insider Sold Shares Worth $22,132,922"
Mark Zuckerberg, 10% Owner, Director, Chair of Board and Chief Executive Officer, on January 15, 2025, sold 35,921 shares in [eta Platforms. Following the Form 4 filing with the SEC, Zuckerberg has control over a total of 353,696 shares of the company, with 353,696 controlled indirectly.
Jennifer Newstead, Chief Legal Officer of Meta Platforms sold 905 shares of Class A Common Stock on January 14, 2025, at a price of $604.54 per share, totaling $547,108. Following the transaction, Newstead directly owns 31,105 shares of Meta Platforms.
Jennifer Newstead, Chief Legal Officer of Meta Platforms, sold 905 shares of Class A Common Stock on January 21, 2025, at a price of $618.0 per share, totaling $559,290. Following the transaction, Newstead directly owns 30,200 shares of Meta Platforms.
The sales were conducted under a Rule 10b5-1 trading plan adopted on November 30, 2023.
Olivan Javier, Chief Operating Officer of Meta Platforms, sold 413 shares of Class A Common Stock on January 21, 2025, at a price of $618.0 per share, totaling $255,234. Following the transaction, Javier directly owns 16,275 shares and indirectly owns 95,287 shares through various entities.
The sale was conducted under a Rule 10b5-1 trading plan adopted on August 30, 2023.

US500 - Short-Term Pain!Hello TradingView Family / Fellow Traders. This is Richard, also known as theSignalyst.
📈US500 has been in a correction phase and it is currently approaching the lower bound of the blue channel.
Moreover, the blue zone is a strong demand and structure.
🏹 Thus, the highlighted blue circle is a strong area to look for buy setups as it is the intersection of structure and lower blue trendline acting as a non-horizontal support.
📚 As per my trading style:
As #US500 approaches the blue circle, I will be looking for bullish reversal setups (like a double bottom pattern, trendline break , and so on...)
If the blue intersection is broken downward, a deeper correction towards the green intersection would be expected.
📚 Always follow your trading plan regarding entry, risk management, and trade management.
Good luck!
All Strategies Are Good; If Managed Properly!
~Rich
