RSI as a Trend ToolMost people use the RSI as a momentum indicator,
trying to find Overbought/Oversold (OBOS) conditions,
and/or divergences.
However there is also a way to use it as a Trend Tool.
There is a mathematical relationship that connects the RSI and EMA's.
The formula is RSI(x) cross-over 50-line = Close cross-over EMA(2x)
i.e. RSI(14) cross-over 50 line = Close cross-over EMA(28)
This one of the properties of the RSI,
which I discovered when taking a more indept look into momentum indicators,
which ultimately led to the discovery of the MACD-v in 2014/2015
The MACD-v was then publicly disclosed in 2022,
in the form of a a paper called
"MACD-v: Volatility Normalised Momentum",
which was awarded:
It has won 2 International Awards:
1. The “Founders Award” (2022),
for advances in Active Investment Management
from the National Association of Active Investment Managars (NAAIM)
2. The “Charles H. Dow Award” (2022)
for outstanding research in Technical Analysis,
from the Chartered Market Technicians Association (CMTA)
Trend

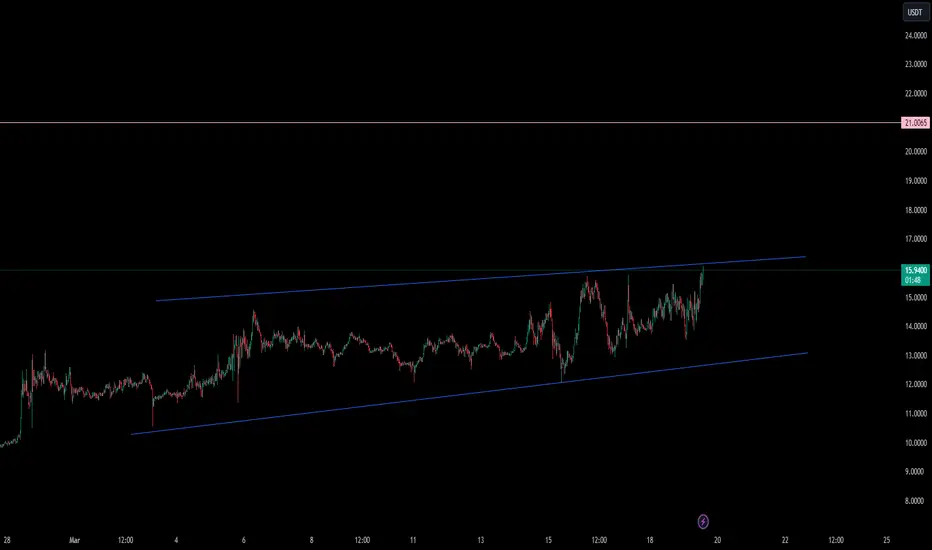
POLYX NEW INCREASE VOLUMEPolyx shows a new increase in volume, which could be confirmed in the coming time frames.
We will follow the coin to see if it's able to confirm.
The reason for the volume is the trend data that this coin shows.
This coin is a basic choice on daily trends.

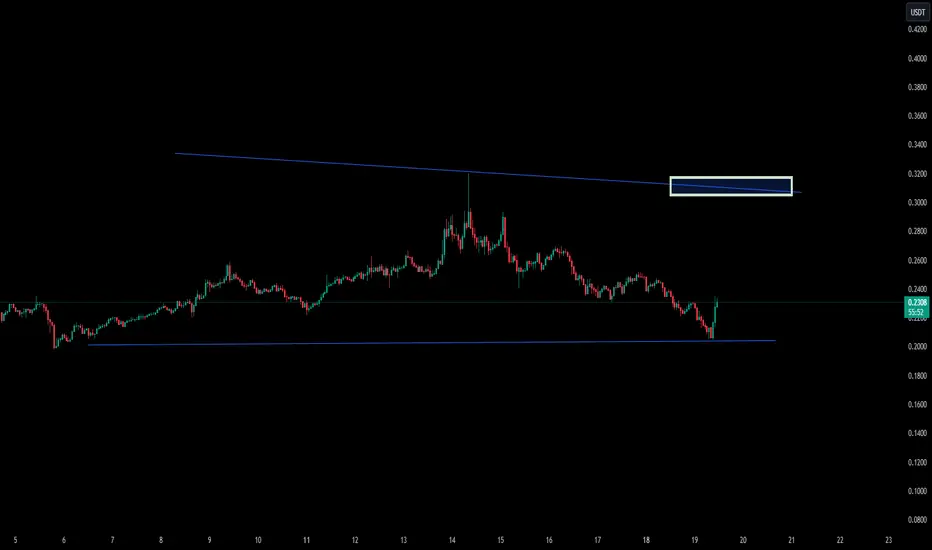
WEN BREAK POSSIBILITY
WEN shows a new increase in volume, which could be confirmed in the coming time frames.
We will follow the coin to see if it's able to confirm.
The reason for the volume is the trend data that this coin shows.
This coin is a basic choice on daily trends.
Data shows that WEN is at an important point and able to break soon.

Correlation between JPY strength and NIKKEIWe cannot treat the Japanese market similar to how we treat the west.
Traditionally, when a currency strengthen, the respective stock index will dip.
However, here we see that whenever USDJPY drops (aka JPY strengthens), the NIKKEI actually continues to rally or at least consolidates sideways.

ID ENTERING NEW IMPORTANT LEVELID shows a new increase in volume, which could be confirmed in the coming time frames.
We will follow the coin to see if it's able to confirm.
The reason for the volume is the trend data that this coin shows.
This coin is at basic choice on daily trends.

APT NEW INCREASE VOLUMEAPT shows a new increase in volume, which could be confirmed in the coming time frames.
We will follow the coin to see if it's able to confirm.
The reason for the volume is the trend data that this coin shows.
This coin is at basic choice on daily trends.
BTC - Correction Phase Started 📉📈Hello TradingView Family / Fellow Traders. This is Richard, also known as theSignalyst.
📈 After breaking below $70,000 , BTC started the bearish correction phase.
As long as the $70,000 resistance holds, we anticipate a movement towards the lower bound of the red wedge pattern.
Moreover, the $60,000 - $62,000 range is a massive support zone.
🏹 Thus, the highlighted red circle is a strong area to look for buy setups as it is the intersection of the blue support and lower red trendline.
📚 As per my trading style:
As #BTC approaches the red circle zone, I will be looking for bullish reversal setups (like a double bottom pattern, trendline break , and so on...)
📚 Always follow your trading plan regarding entry, risk management, and trade management.
Good luck!
All Strategies Are Good; If Managed Properly!
~Rich

ALPACA NEW INCREASE VOLUMEALPACA shows a new increase in volume, which could be confirmed in the coming time frames.
We will follow the coin to see if it's able to confirm.
The reason for the volume is the trend data that this coin shows.
This coin is at basic choice on daily trends.

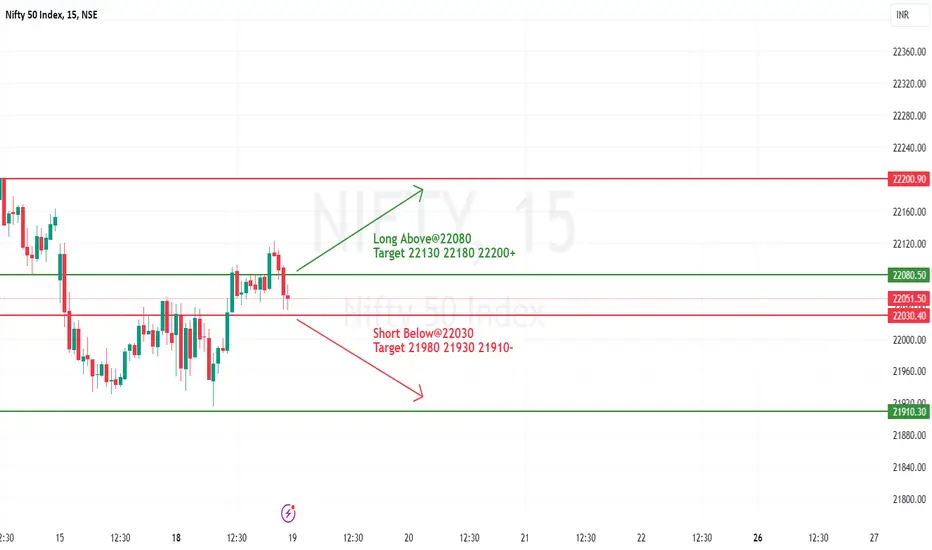
#NIFTY Intraday Support and Resistance Levels -19/03/2024Nifty will be gap up opening in today's session. After opening nifty sustain above 22080 level and then possible upside rally up to 22200 level in today's session. in case nifty trades below 22030 level then the downside target can go up to the 21910 level.
[INTRADAY] #BANKNIFTY PE & CE Levels(19/03/2024) Today will be gap up opening in BANKNIFTY. After opening if banknifty sustain above 46550 level then possible upside rally of 400-500 points upto 46950 level & this rally can extend another 400 points if market gives breakout 47050 level in todays session.Any Major downside only expected in case banknifty starts trading below 46450 level.

XRP SHOWING NEW TREND VOLUME FIRST TIME 2024Thanks for reading this update.
XRP seems to show new confirmation on the new opening time frame trend..

THE BREAK OF FORTHForth seems on the important level to make the next break trend in level.
We will follow the trend for confirmation.
The chance that FORTH can break is 80%
This all depends on high data.
Expecting the coin could do between $9.50 and $16.34

QI NEW INCREASE VOLUME QI seems to have entered an important level where it could get a new break volume.
We will follow the trend for new daily volume.

JOE NEW INCREASE VOLUMEJOE seems to enter a new increase volume trend which could confirm in the coming time frame to a break.
We will follow the trend.

#XAUUSD (UPDATE).Looking For Buy | Long
#XAUUSD (UPDATE )
Looking For Buy Setup| Long 🔥
Hey team, Hope you are Enjoying our ideas and Analysis, Today in Trading Session we are monitoring XAUUSD for a Buying Opportunity Around 2047, One More Buy Limit 2045 , Once we will receive any Bullish Conformation the Trade Will be Excuted
Good Luck 🤞🔥🚀💪

BOME NEW INCREASE TRENDBOME seems since the least hype trend to make a new increase volume.
We will follow the trend in the coming time frames.

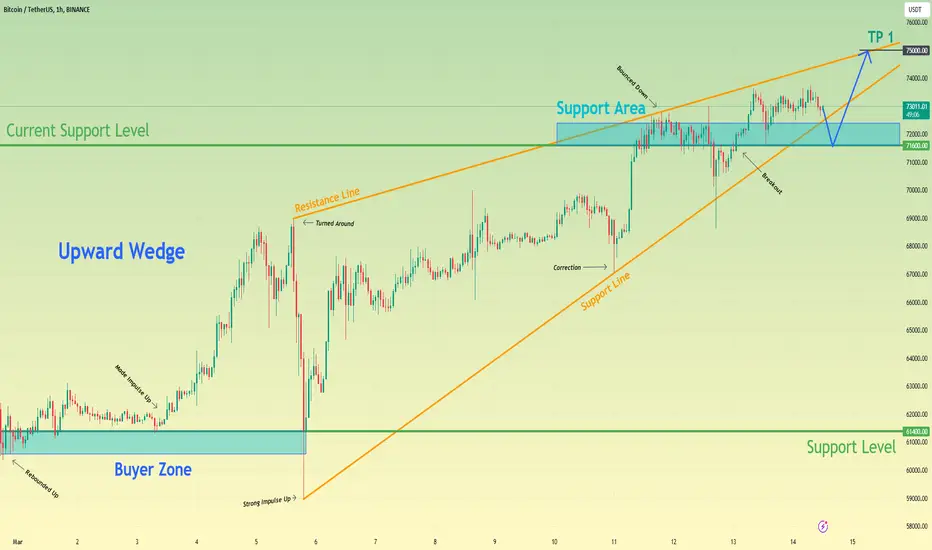
Bitcoin can make small correction and then continue to riseHello traders, I want share with you my opinion about Bitcoin. Observing the chart, we can see that the price some time ago fell to the buyer zone, which coincided with the support level, but at once rebounded and started to move up. But soon, BTC made a correction to the 61400 level and after this, the price made a strong upward impulse to 68500 points, but at once made a correction again. After correction price tried to rise one more time, but BTC turned around and in a short time declined to 59000 points, thereby breaking the 61400 level. As well later, the price started to trades in an upward wedge, where BTC turned around from 59000 points and made a strong upward impulse, breaking the 61400 level one more time. After this price continued to move up some time more, after which the price made a correction to support line of the wedge. Then BTC rebounded up to the current support level, which coincided with the support area, and even entered this area and reached the resistance line. Soon price bounced back to the support line, but recently BTC backed up to the support area, and now the price trades even higher this zone. So, I think Bitcoin can make a correction to the support area, after which the price will turn around and continue to move up to the resistance line. Therefore I set my target at the 75000 level, which coincided with this line. Please share this idea with your friends and click Boost 🚀

FLOKI SEEMS TO ENTER NEW VOLUME TIMEThank you for reading this update.
FLOKI seems to enter an important trend that could end in a break.
FLOKI have at this moment interesting view depending on TA.

HOT CAN SHOW HISTORICAL INCREASEHot seems to have an interesting volume, which could increase with the coming time frames, we will follow the trend to see for new changes in data.
will the trend follow FLoki, SHIBA's last hype? The chance is there high.
we did update before about Floki with same update

#NIFTY Intraday Support and Resistance Levels -13/03/2024Nifty will be gap up opening in today's session. After opening nifty sustain above 22340 level and then possible upside rally up to 22460 level in today's session. in case nifty trades below 22310 level then the downside target can go up to the 22190 level.

#SNX/USDT SPOT LONG ENTRY#SNX/USDT SPOT LONG ENTRY
Leverage: 3x
Entries: $4.425
Take profit 1: $7.292
Take profit 2: $15.066
Take profit 3: $50.929
Stop Loss: $2.733
NOTE: This is just my prediction. Be sure to use STOPLOSS and remember that I am not a financial adviser. your money, your risk!
BINANCE:SNXUSDT
Thanks
The sroced.
